Zip Codes with the Highest Percentage of Population Employed in Life, Physical & Social Science in Columbus, GA

RELATED REPORTS & OPTIONS

Life, Physical & Social Science
Population
Families and Households
Female Fertility
Female Fertility (Unmarried)
Race (Community Size)
Race (Percentage)
Ancestry (Community Size)
AfricanAmericanArabAustrianBarbadianBelgianBhutaneseBlackfeetBrazilianBritishBritish West IndianBurmeseCajunCanadianCentral AmericanCentral American IndianCherokeeColombianCosta RicanCreekCubanCzechDanishDominicanDutchEastern EuropeanEcuadorianEnglishEuropeanFinnishFrenchFrench CanadianGermanGreekGuamanian / ChamorroGuatemalanGuyaneseHaitianHonduranHungarianIndian (Asian)IranianIrishItalianJamaicanKoreanLatvianLebaneseLithuanianMalaysianMexicanMexican American IndianNative HawaiianNavajoNicaraguanNigerianNorthern EuropeanNorwegianPakistaniPanamanianPolishPortuguesePuerto RicanRomanianRussianSalvadoranSamoanScandinavianScotch-IrishScottishSeminoleSlavicSlovakSouth AmericanSpaniardSpanishSpanish AmericanSri LankanSubsaharan AfricanSwedishSwissSyrianThaiTrinidadian and TobagonianWelshWest Indian
Ancestry (Percentage)
AfricanAmericanArabAustrianBarbadianBelgianBhutaneseBlackfeetBrazilianBritishBritish West IndianBurmeseCajunCanadianCentral AmericanCentral American IndianCherokeeColombianCosta RicanCreekCubanCzechDanishDominicanDutchEastern EuropeanEcuadorianEnglishEuropeanFinnishFrenchFrench CanadianGermanGreekGuamanian / ChamorroGuatemalanGuyaneseHaitianHonduranHungarianIndian (Asian)IranianIrishItalianJamaicanKoreanLatvianLebaneseLithuanianMalaysianMexicanMexican American IndianNative HawaiianNavajoNicaraguanNigerianNorthern EuropeanNorwegianPakistaniPanamanianPolishPortuguesePuerto RicanRomanianRussianSalvadoranSamoanScandinavianScotch-IrishScottishSeminoleSlavicSlovakSouth AmericanSpaniardSpanishSpanish AmericanSri LankanSubsaharan AfricanSwedishSwissSyrianThaiTrinidadian and TobagonianWelshWest Indian
Immigrant Origin (Total)
Immigrant Origin (Percentage)
Income
Income (Families)
Income (Households)
Poverty
Poverty (Families)
Unemployment
Employment Occupations
Employment Industries
Employer Class
Commute Time
Commute Means
School Enrollment
Education by Degree Field
Occupancy
Finances
Physical Characteristics
Columbus
Compare Zip Codes
Comparison Subject

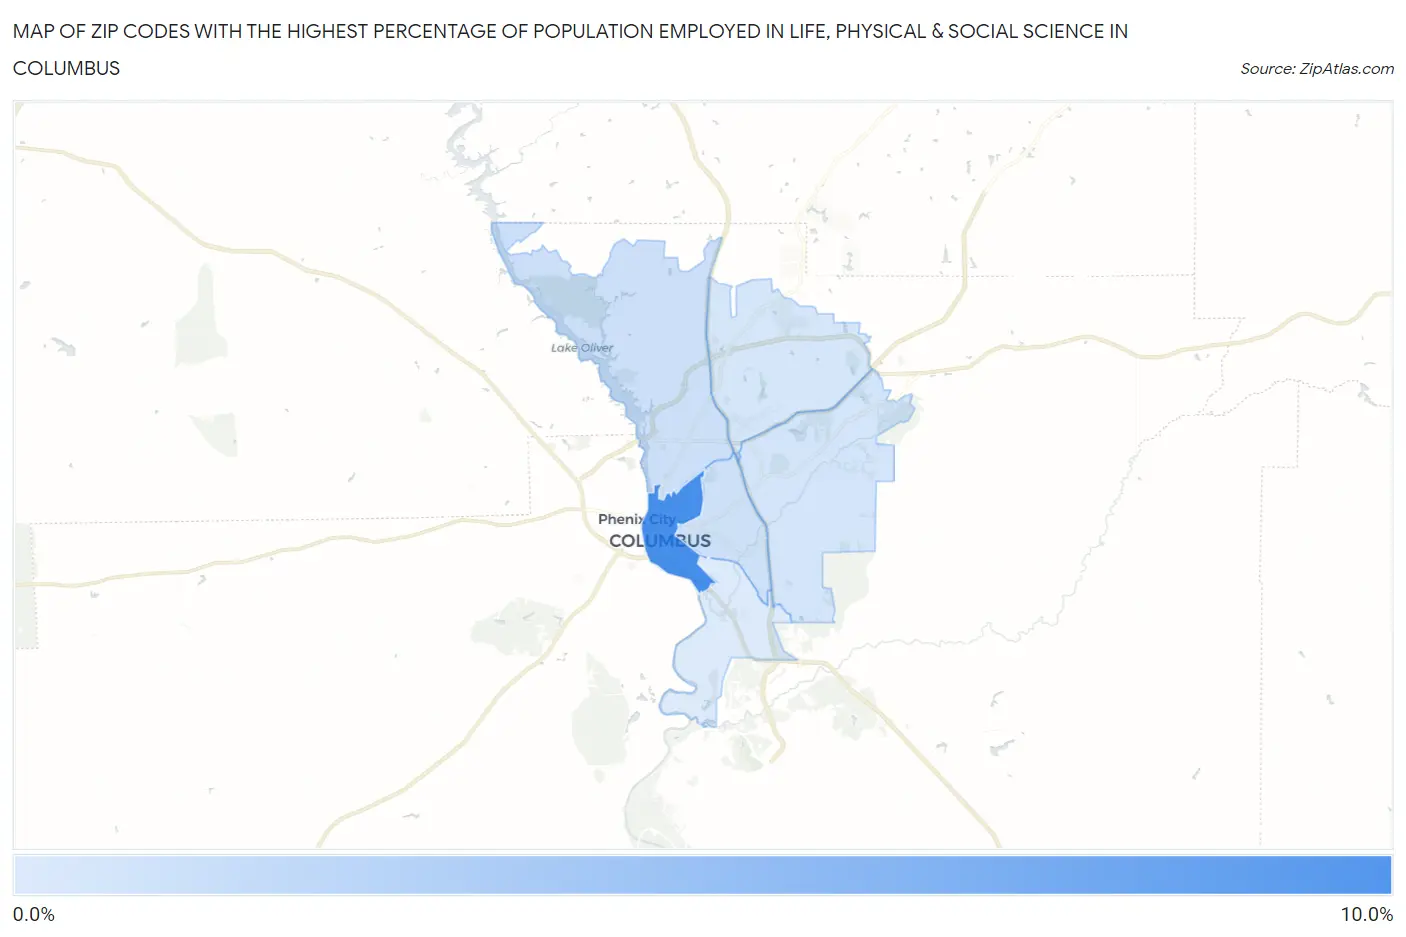
Map of Zip Codes with the Highest Percentage of Population Employed in Life, Physical & Social Science in Columbus

0.0%
10.0%
Zip Codes with the Highest Percentage of Population Employed in Life, Physical & Social Science in Columbus Map

Zip Codes with the Highest Percentage of Population Employed in Life, Physical & Social Science in Columbus, GA

Zip Code % Employed vs State vs National
1.319018.0%0.91%(+7.13)#21.1%(+6.95)#319
2.319040.93%0.91%(+0.020)#1981.1%(-0.158)#9,636
3.319060.86%0.91%(-0.052)#2141.1%(-0.230)#10,361
4.319070.59%0.91%(-0.327)#2811.1%(-0.505)#13,472
5.319090.40%0.91%(-0.512)#3341.1%(-0.690)#15,743
6.319030.093%0.91%(-0.820)#4351.1%(-0.998)#19,113

Common Questions

What are the Top 5 Zip Codes with the Highest Percentage of Population Employed in Life, Physical & Social Science in Columbus, GA?
Top 5 Zip Codes with the Highest Percentage of Population Employed in Life, Physical & Social Science in Columbus, GA are:
#1
8.0%
#2
0.93%
#3
0.86%
#4
0.59%
#5
0.40%
What zip code has the Highest Percentage of Population Employed in Life, Physical & Social Science in Columbus, GA?
31901 has the Highest Percentage of Population Employed in Life, Physical & Social Science in Columbus, GA with 8.0%.
What is the Percentage of Population Employed in Life, Physical & Social Science in Columbus, GA?
Percentage of Population Employed in Life, Physical & Social Science in Columbus is 0.85%.
What is the Percentage of Population Employed in Life, Physical & Social Science in Georgia?
Percentage of Population Employed in Life, Physical & Social Science in Georgia is 0.91%.
What is the Percentage of Population Employed in Life, Physical & Social Science in the United States?
Percentage of Population Employed in Life, Physical & Social Science in the United States is 1.1%.