Immigrants from El Salvador vs Lithuanian Married-couple Households

COMPARE

Immigrants from El Salvador
Race
Ancestry
AfghanAfricanAlaska NativeAlaskan AthabascanAlbanianAleutAlsatianAmericanApacheArabArapahoArgentineanArmenianAssyrian/Chaldean/SyriacAustralianAustrianBahamianBangladeshiBarbadianBasqueBelgianBelizeanBermudanBhutaneseBlackfeetBolivianBrazilianBritishBritish West IndianBulgarianBurmeseCajunCambodianCanadianCape VerdeanCarpatho RusynCelticCentral AmericanCentral American IndianCherokeeCheyenneChickasawChileanChineseChippewaChoctawColombianColvilleComancheCosta RicanCreeCreekCroatianCrowCubanCypriotCzechCzechoslovakianDanishDelawareDominicanDutchDutch West IndianEastern EuropeanEcuadorianEgyptianEnglishEstonianEthiopianEuropeanFijianFilipinoFinnishFrenchFrench American IndianFrench CanadianGermanGerman RussianGhanaianGreekGuamanian/ChamorroGuatemalanGuyaneseHaitianHmongHonduranHopiHoumaHungarianIcelanderIndian (Asian)IndonesianInupiatIranianIraqiIrishIroquoisIsraeliItalianJamaicanJapaneseJordanianKenyanKiowaKoreanLaotianLatvianLebaneseLiberianLumbeeLuxembourgerMacedonianMalaysianMalteseMarshalleseMenomineeMexicanMexican American IndianMongolianMoroccanNative HawaiianNavajoNepaleseNew ZealanderNicaraguanNigerianNorthern EuropeanNorwegianOkinawanOsageOttawaPaiutePakistaniPalestinianPanamanianParaguayanPennsylvania GermanPeruvianPimaPolishPortuguesePotawatomiPuebloPuerto RicanPuget Sound SalishRomanianRussianSalvadoranSamoanScandinavianScotch-IrishScottishSeminoleSenegaleseSerbianShoshoneSierra LeoneanSiouxSlavicSlovakSloveneSomaliSouth AfricanSouth AmericanSouth American IndianSoviet UnionSpaniardSpanishSpanish AmericanSpanish American IndianSri LankanSubsaharan AfricanSudaneseSwedishSwissSyrianTaiwaneseThaiTlingit-HaidaTohono O'OdhamTonganTrinidadian and TobagonianTsimshianTurkishU.S. Virgin IslanderUgandanUkrainianUruguayanUteVenezuelanVietnameseWelshWest IndianYakamaYaquiYugoslavianYumanYup'ikZimbabwean
Immigration
NonimmigrantsImmigrantsAfghanistanAfricaAlbaniaArgentinaArmeniaAsiaAustraliaAustriaBahamasBangladeshBarbadosBelarusBelgiumBelizeBoliviaBosnia and HerzegovinaBrazilBulgariaBurma/MyanmarCabo VerdeCambodiaCameroonCanadaCaribbeanCentral AmericaChileChinaColombiaCongoCosta RicaCroatiaCubaCzechoslovakiaDenmarkDominicaDominican RepublicEastern AfricaEastern AsiaEastern EuropeEcuadorEgyptEl SalvadorEnglandEritreaEthiopiaEuropeFijiFranceGermanyGhanaGreeceGrenadaGuatemalaGuyanaHaitiHondurasHong KongHungaryIndiaIndonesiaIranIraqIrelandIsraelItalyJamaicaJapanJordanKazakhstanKenyaKoreaKuwaitLaosLatin AmericaLatviaLebanonLiberiaLithuaniaMalaysiaMexicoMicronesiaMiddle AfricaMoldovaMoroccoNepalNetherlandsNicaraguaNigeriaNorth AmericaNorth MacedoniaNorthern AfricaNorthern EuropeNorwayOceaniaPakistanPanamaPeruPhilippinesPolandPortugalRomaniaRussiaSaudi ArabiaScotlandSenegalSerbiaSierra LeoneSingaporeSomaliaSouth AfricaSouth AmericaSouth Central AsiaSouth Eastern AsiaSouthern EuropeSpainSri LankaSt. Vincent and the GrenadinesSudanSwedenSwitzerlandSyriaTaiwanThailandTrinidad and TobagoTurkeyUgandaUkraineUruguayUzbekistanVenezuelaVietnamWest IndiesWestern AfricaWestern AsiaWestern EuropeYemenZaireZimbabweAzores
Lithuanian
Race
Ancestry
AfghanAfricanAlaska NativeAlaskan AthabascanAlbanianAleutAlsatianAmericanApacheArabArapahoArgentineanArmenianAssyrian/Chaldean/SyriacAustralianAustrianBahamianBangladeshiBarbadianBasqueBelgianBelizeanBermudanBhutaneseBlackfeetBolivianBrazilianBritishBritish West IndianBulgarianBurmeseCajunCambodianCanadianCape VerdeanCarpatho RusynCelticCentral AmericanCentral American IndianCherokeeCheyenneChickasawChileanChineseChippewaChoctawColombianColvilleComancheCosta RicanCreeCreekCroatianCrowCubanCypriotCzechCzechoslovakianDanishDelawareDominicanDutchDutch West IndianEastern EuropeanEcuadorianEgyptianEnglishEstonianEthiopianEuropeanFijianFilipinoFinnishFrenchFrench American IndianFrench CanadianGermanGerman RussianGhanaianGreekGuamanian/ChamorroGuatemalanGuyaneseHaitianHmongHonduranHopiHoumaHungarianIcelanderIndian (Asian)IndonesianInupiatIranianIraqiIrishIroquoisIsraeliItalianJamaicanJapaneseJordanianKenyanKiowaKoreanLaotianLatvianLebaneseLiberianLithuanianLumbeeLuxembourgerMacedonianMalaysianMalteseMarshalleseMenomineeMexicanMexican American IndianMongolianMoroccanNative HawaiianNavajoNepaleseNew ZealanderNicaraguanNigerianNorthern EuropeanNorwegianOkinawanOsageOttawaPaiutePakistaniPalestinianPanamanianParaguayanPennsylvania GermanPeruvianPimaPolishPortuguesePotawatomiPuebloPuerto RicanPuget Sound SalishRomanianRussianSalvadoranSamoanScandinavianScotch-IrishScottishSeminoleSenegaleseSerbianShoshoneSierra LeoneanSiouxSlavicSlovakSloveneSomaliSouth AfricanSouth AmericanSouth American IndianSoviet UnionSpaniardSpanishSpanish AmericanSpanish American IndianSri LankanSubsaharan AfricanSudaneseSwedishSwissSyrianTaiwaneseThaiTlingit-HaidaTohono O'OdhamTonganTrinidadian and TobagonianTsimshianTurkishU.S. Virgin IslanderUgandanUkrainianUruguayanUteVenezuelanVietnameseWelshWest IndianYakamaYaquiYugoslavianYumanYup'ikZimbabwean
Immigration
NonimmigrantsImmigrantsAfghanistanAfricaAlbaniaArgentinaArmeniaAsiaAustraliaAustriaBahamasBangladeshBarbadosBelarusBelgiumBelizeBoliviaBosnia and HerzegovinaBrazilBulgariaBurma/MyanmarCabo VerdeCambodiaCameroonCanadaCaribbeanCentral AmericaChileChinaColombiaCongoCosta RicaCroatiaCubaCzechoslovakiaDenmarkDominicaDominican RepublicEastern AfricaEastern AsiaEastern EuropeEcuadorEgyptEnglandEritreaEthiopiaEuropeFijiFranceGermanyGhanaGreeceGrenadaGuatemalaGuyanaHaitiHondurasHong KongHungaryIndiaIndonesiaIranIraqIrelandIsraelItalyJamaicaJapanJordanKazakhstanKenyaKoreaKuwaitLaosLatin AmericaLatviaLebanonLiberiaLithuaniaMalaysiaMexicoMicronesiaMiddle AfricaMoldovaMoroccoNepalNetherlandsNicaraguaNigeriaNorth AmericaNorth MacedoniaNorthern AfricaNorthern EuropeNorwayOceaniaPakistanPanamaPeruPhilippinesPolandPortugalRomaniaRussiaSaudi ArabiaScotlandSenegalSerbiaSierra LeoneSingaporeSomaliaSouth AfricaSouth AmericaSouth Central AsiaSouth Eastern AsiaSouthern EuropeSpainSri LankaSt. Vincent and the GrenadinesSudanSwedenSwitzerlandSyriaTaiwanThailandTrinidad and TobagoTurkeyUgandaUkraineUruguayUzbekistanVenezuelaVietnamWest IndiesWestern AfricaWestern AsiaWestern EuropeYemenZaireZimbabweAzores
Married-couple Households
Income
Poverty
Unemployment
Labor Participation
Family Structure
Vehicle Availability
Education Level
Disability

Married-couple Households Comparison

Immigrants from El Salvador

Lithuanians

Tragic
Exceptional
44.3%
MARRIED-COUPLE HOUSEHOLDS
0.7/ 100
METRIC RATING
245th/ 347
METRIC RANK
48.9%
MARRIED-COUPLE HOUSEHOLDS
99.6/ 100
METRIC RATING
39th/ 347
METRIC RANK

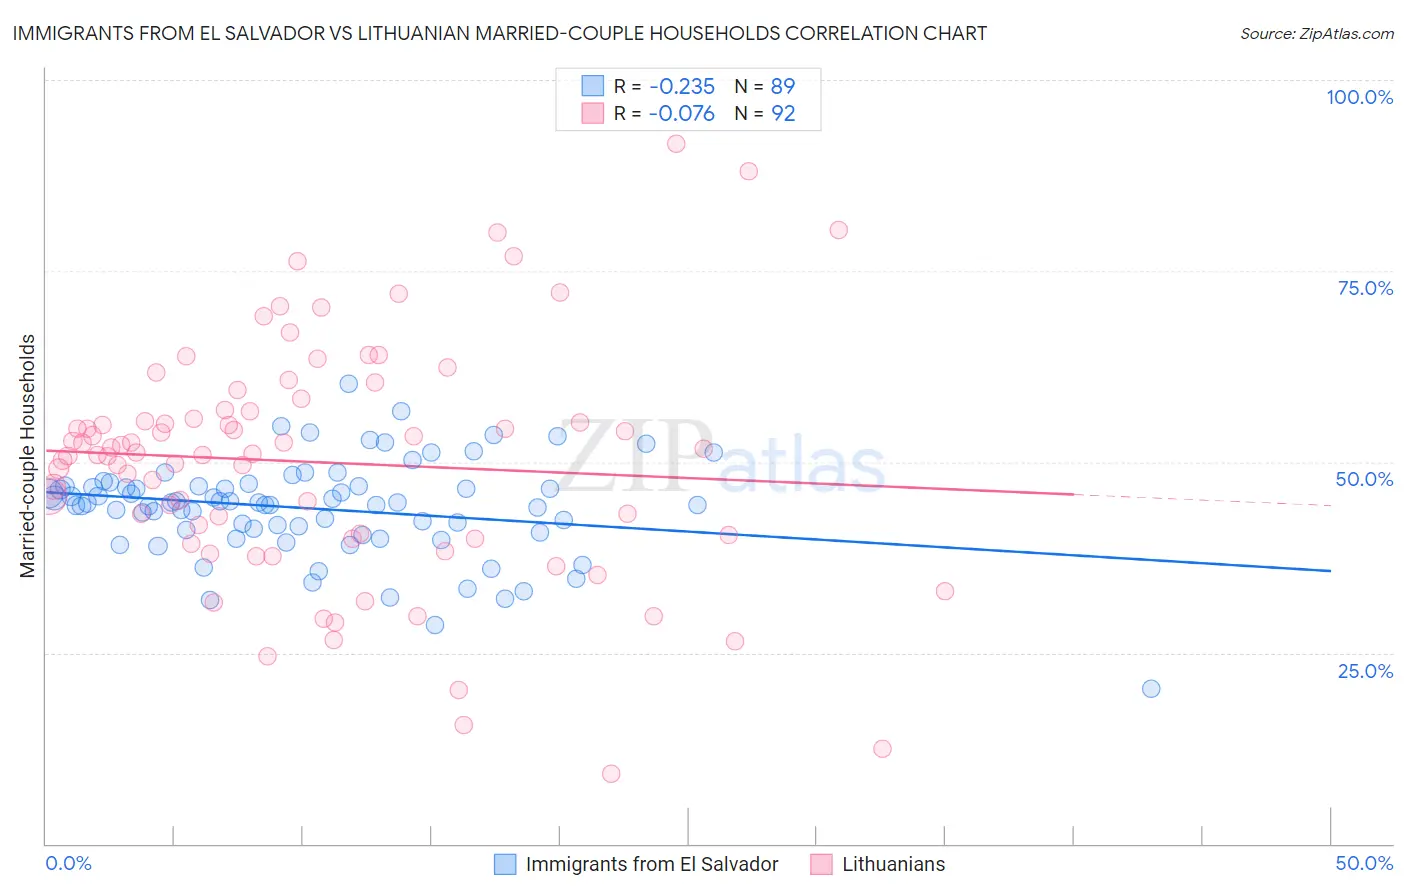
Immigrants from El Salvador vs Lithuanian Married-couple Households Correlation Chart

The statistical analysis conducted on geographies consisting of 357,701,715 people shows a weak negative correlation between the proportion of Immigrants from El Salvador and percentage of married-couple family households in the United States with a correlation coefficient (R) of -0.235 and weighted average of 44.3%. Similarly, the statistical analysis conducted on geographies consisting of 421,720,983 people shows a slight negative correlation between the proportion of Lithuanians and percentage of married-couple family households in the United States with a correlation coefficient (R) of -0.076 and weighted average of 48.9%, a difference of 10.4%.
Immigrants from El Salvador vs Lithuanian Married-couple Households

Married-couple Households Correlation Summary

MeasurementImmigrants from El SalvadorLithuanian
Minimum20.3%9.2%
Maximum60.3%91.7%
Range40.0%82.5%
Mean43.9%49.9%
Median44.6%51.1%
Interquartile 25% (IQ1)40.9%40.2%
Interquartile 75% (IQ3)46.8%56.7%
Interquartile Range (IQR)6.0%16.5%
Standard Deviation (Sample)6.4%15.6%
Standard Deviation (Population)6.3%15.5%

Similar Demographics by Married-couple Households

Demographics Similar to Immigrants from El Salvador by Married-couple Households

In terms of married-couple households, the demographic groups most similar to Immigrants from El Salvador are Immigrants from Armenia (44.3%, a difference of 0.010%), Immigrants from Cuba (44.2%, a difference of 0.15%), Immigrants from Morocco (44.2%, a difference of 0.15%), Immigrants from Saudi Arabia (44.4%, a difference of 0.29%), and Immigrants from Albania (44.4%, a difference of 0.36%).
DemographicsRating | RankMarried-couple Households
Immigrants | Uruguay
1.1
/100
|
#238
Tragic
44.5%
Spanish Americans
1.1
/100
|
#239
Tragic
44.5%
Ute
1.0
/100
|
#240
Tragic
44.4%
Immigrants | Bosnia and Herzegovina
1.0
/100
|
#241
Tragic
44.4%
Immigrants | Albania
1.0
/100
|
#242
Tragic
44.4%
Immigrants | Saudi Arabia
0.9
/100
|
#243
Tragic
44.4%
Immigrants | Armenia
0.7
/100
|
#244
Tragic
44.3%
Immigrants | El Salvador
0.7
/100
|
#245
Tragic
44.3%
Immigrants | Cuba
0.6
/100
|
#246
Tragic
44.2%
Immigrants | Morocco
0.6
/100
|
#247
Tragic
44.2%
Yup'ik
0.4
/100
|
#248
Tragic
44.1%
Immigrants | Kenya
0.4
/100
|
#249
Tragic
44.1%
French American Indians
0.4
/100
|
#250
Tragic
44.1%
German Russians
0.4
/100
|
#251
Tragic
44.0%
Seminole
0.4
/100
|
#252
Tragic
44.0%

Demographics Similar to Lithuanians by Married-couple Households

In terms of married-couple households, the demographic groups most similar to Lithuanians are Immigrants from Bolivia (48.9%, a difference of 0.010%), Immigrants from Lebanon (48.9%, a difference of 0.050%), Greek (48.9%, a difference of 0.080%), Immigrants from Vietnam (48.8%, a difference of 0.090%), and Immigrants from Iran (48.8%, a difference of 0.15%).
DemographicsRating | RankMarried-couple Households
Hungarians
99.8
/100
|
#32
Exceptional
49.1%
Immigrants | Asia
99.7
/100
|
#33
Exceptional
49.1%
Italians
99.7
/100
|
#34
Exceptional
49.0%
Scottish
99.7
/100
|
#35
Exceptional
49.0%
Iranians
99.7
/100
|
#36
Exceptional
49.0%
Sri Lankans
99.7
/100
|
#37
Exceptional
49.0%
Greeks
99.7
/100
|
#38
Exceptional
48.9%
Lithuanians
99.6
/100
|
#39
Exceptional
48.9%
Immigrants | Bolivia
99.6
/100
|
#40
Exceptional
48.9%
Immigrants | Lebanon
99.6
/100
|
#41
Exceptional
48.9%
Immigrants | Vietnam
99.6
/100
|
#42
Exceptional
48.8%
Immigrants | Iran
99.6
/100
|
#43
Exceptional
48.8%
Welsh
99.5
/100
|
#44
Exceptional
48.8%
Immigrants | Eastern Asia
99.5
/100
|
#45
Exceptional
48.8%
Tsimshian
99.5
/100
|
#46
Exceptional
48.7%