Immigrants from Syria vs Immigrants from Burma/Myanmar GED/Equivalency
COMPARE
Immigrants from Syria
Immigrants from Burma/Myanmar
GED/Equivalency
GED/Equivalency Comparison
Immigrants from Syria
Immigrants from Burma/Myanmar
86.1%
GED/EQUIVALENCY
69.3/ 100
METRIC RATING
161st/ 347
METRIC RANK
83.0%
GED/EQUIVALENCY
0.2/ 100
METRIC RATING
268th/ 347
METRIC RANK
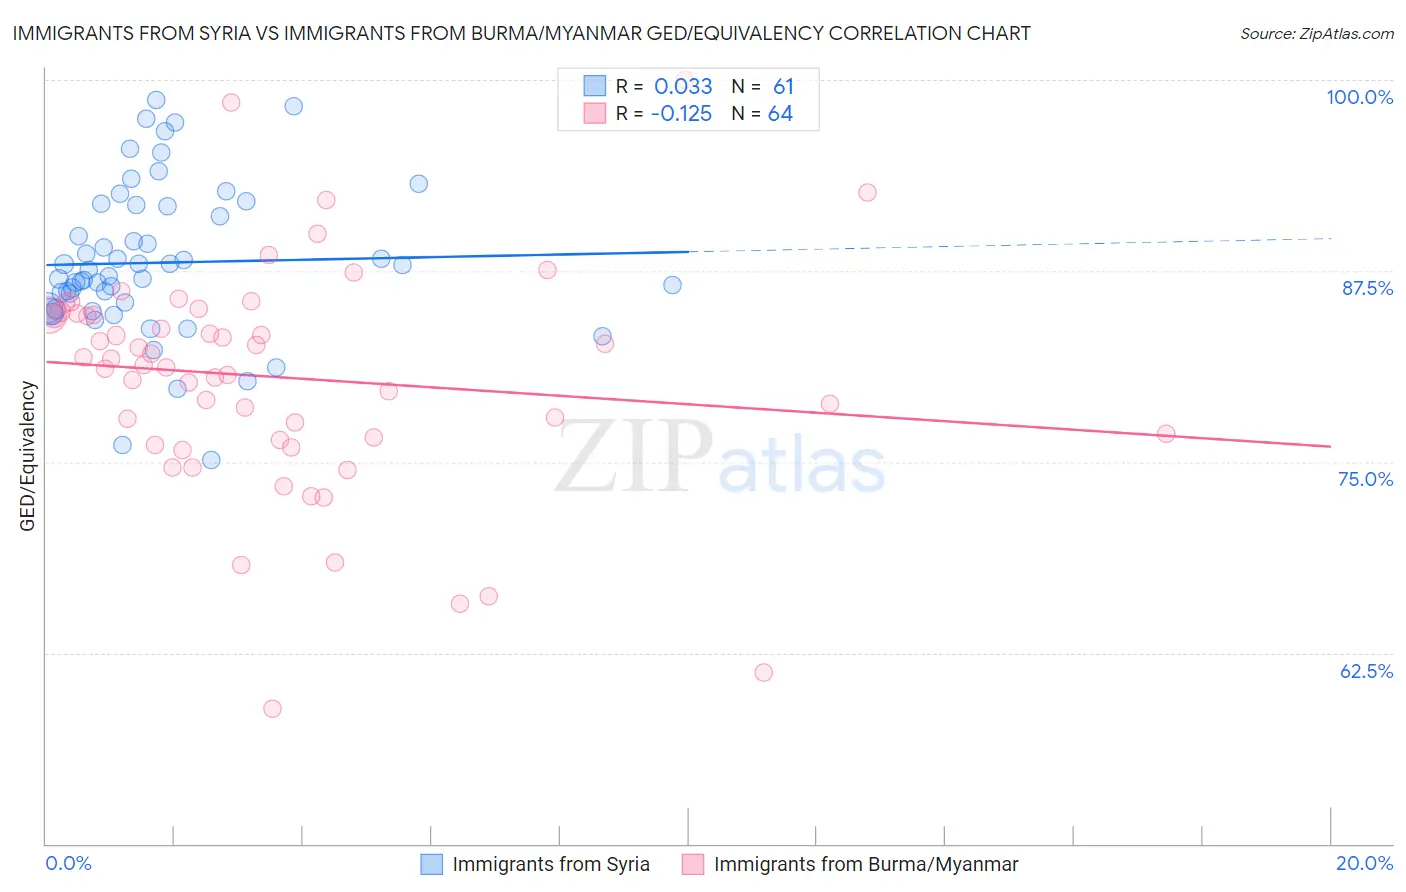
Immigrants from Syria vs Immigrants from Burma/Myanmar GED/Equivalency Correlation Chart
The statistical analysis conducted on geographies consisting of 174,108,882 people shows no correlation between the proportion of Immigrants from Syria and percentage of population with at least ged/equivalency education in the United States with a correlation coefficient (R) of 0.033 and weighted average of 86.1%. Similarly, the statistical analysis conducted on geographies consisting of 172,357,706 people shows a poor negative correlation between the proportion of Immigrants from Burma/Myanmar and percentage of population with at least ged/equivalency education in the United States with a correlation coefficient (R) of -0.125 and weighted average of 83.0%, a difference of 3.7%.
GED/Equivalency Correlation Summary
| Measurement | Immigrants from Syria | Immigrants from Burma/Myanmar |
| Minimum | 75.1% | 58.8% |
| Maximum | 98.7% | 100.0% |
| Range | 23.5% | 41.2% |
| Mean | 88.0% | 80.5% |
| Median | 87.1% | 81.5% |
| Interquartile 25% (IQ1) | 85.0% | 76.5% |
| Interquartile 75% (IQ3) | 91.8% | 84.7% |
| Interquartile Range (IQR) | 6.7% | 8.1% |
| Standard Deviation (Sample) | 5.0% | 7.5% |
| Standard Deviation (Population) | 4.9% | 7.4% |
Similar Demographics by GED/Equivalency
Demographics Similar to Immigrants from Syria by GED/Equivalency
In terms of ged/equivalency, the demographic groups most similar to Immigrants from Syria are Immigrants from Morocco (86.1%, a difference of 0.010%), Immigrants from Iraq (86.1%, a difference of 0.030%), Immigrants from Kenya (86.2%, a difference of 0.060%), White/Caucasian (86.2%, a difference of 0.070%), and German Russian (86.2%, a difference of 0.070%).
| Demographics | Rating | Rank | GED/Equivalency |
| Armenians | 76.4 /100 | #154 | Good 86.3% |
| Iraqis | 75.2 /100 | #155 | Good 86.2% |
| Immigrants | Nepal | 73.3 /100 | #156 | Good 86.2% |
| Whites/Caucasians | 72.2 /100 | #157 | Good 86.2% |
| German Russians | 72.1 /100 | #158 | Good 86.2% |
| Immigrants | Kenya | 71.8 /100 | #159 | Good 86.2% |
| Immigrants | Morocco | 69.5 /100 | #160 | Good 86.1% |
| Immigrants | Syria | 69.3 /100 | #161 | Good 86.1% |
| Immigrants | Iraq | 68.1 /100 | #162 | Good 86.1% |
| Ugandans | 66.3 /100 | #163 | Good 86.1% |
| Venezuelans | 65.5 /100 | #164 | Good 86.0% |
| Alsatians | 64.3 /100 | #165 | Good 86.0% |
| Immigrants | Albania | 64.2 /100 | #166 | Good 86.0% |
| Ethiopians | 63.7 /100 | #167 | Good 86.0% |
| Sierra Leoneans | 61.8 /100 | #168 | Good 86.0% |
Demographics Similar to Immigrants from Burma/Myanmar by GED/Equivalency
In terms of ged/equivalency, the demographic groups most similar to Immigrants from Burma/Myanmar are Trinidadian and Tobagonian (83.0%, a difference of 0.040%), Hopi (83.0%, a difference of 0.040%), West Indian (83.1%, a difference of 0.060%), Kiowa (83.1%, a difference of 0.060%), and Bangladeshi (83.1%, a difference of 0.070%).
| Demographics | Rating | Rank | GED/Equivalency |
| Inupiat | 0.2 /100 | #261 | Tragic 83.1% |
| Immigrants | Armenia | 0.2 /100 | #262 | Tragic 83.1% |
| Immigrants | Congo | 0.2 /100 | #263 | Tragic 83.1% |
| Bangladeshis | 0.2 /100 | #264 | Tragic 83.1% |
| West Indians | 0.2 /100 | #265 | Tragic 83.1% |
| Kiowa | 0.2 /100 | #266 | Tragic 83.1% |
| Trinidadians and Tobagonians | 0.2 /100 | #267 | Tragic 83.0% |
| Immigrants | Burma/Myanmar | 0.2 /100 | #268 | Tragic 83.0% |
| Hopi | 0.2 /100 | #269 | Tragic 83.0% |
| Immigrants | Jamaica | 0.2 /100 | #270 | Tragic 82.9% |
| U.S. Virgin Islanders | 0.2 /100 | #271 | Tragic 82.9% |
| Barbadians | 0.1 /100 | #272 | Tragic 82.9% |
| Pennsylvania Germans | 0.1 /100 | #273 | Tragic 82.9% |
| Immigrants | Trinidad and Tobago | 0.1 /100 | #274 | Tragic 82.8% |
| Seminole | 0.1 /100 | #275 | Tragic 82.8% |