Immigrants from Korea vs Puget Sound Salish GED/Equivalency
COMPARE
Immigrants from Korea
Puget Sound Salish
GED/Equivalency
GED/Equivalency Comparison
Immigrants from Korea
Puget Sound Salish
88.1%
GED/EQUIVALENCY
99.5/ 100
METRIC RATING
50th/ 347
METRIC RANK
85.2%
GED/EQUIVALENCY
20.8/ 100
METRIC RATING
194th/ 347
METRIC RANK
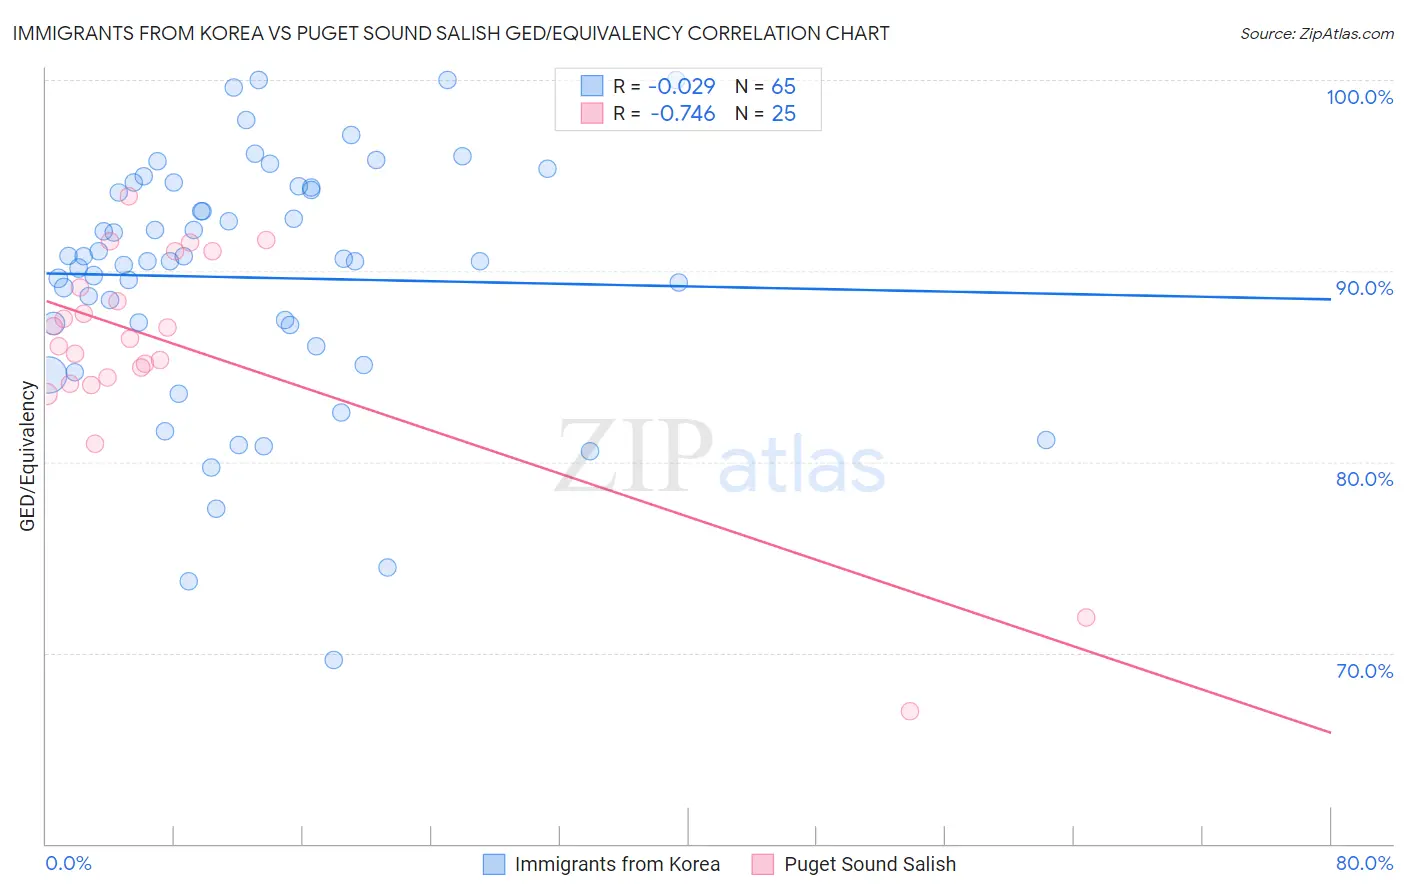
Immigrants from Korea vs Puget Sound Salish GED/Equivalency Correlation Chart
The statistical analysis conducted on geographies consisting of 416,280,217 people shows no correlation between the proportion of Immigrants from Korea and percentage of population with at least ged/equivalency education in the United States with a correlation coefficient (R) of -0.029 and weighted average of 88.1%. Similarly, the statistical analysis conducted on geographies consisting of 46,155,775 people shows a strong negative correlation between the proportion of Puget Sound Salish and percentage of population with at least ged/equivalency education in the United States with a correlation coefficient (R) of -0.746 and weighted average of 85.2%, a difference of 3.4%.
GED/Equivalency Correlation Summary
| Measurement | Immigrants from Korea | Puget Sound Salish |
| Minimum | 69.6% | 66.9% |
| Maximum | 100.0% | 93.9% |
| Range | 30.4% | 26.9% |
| Mean | 89.7% | 85.9% |
| Median | 90.5% | 86.5% |
| Interquartile 25% (IQ1) | 86.6% | 84.3% |
| Interquartile 75% (IQ3) | 94.4% | 90.1% |
| Interquartile Range (IQR) | 7.8% | 5.8% |
| Standard Deviation (Sample) | 6.5% | 5.9% |
| Standard Deviation (Population) | 6.5% | 5.8% |
Similar Demographics by GED/Equivalency
Demographics Similar to Immigrants from Korea by GED/Equivalency
In terms of ged/equivalency, the demographic groups most similar to Immigrants from Korea are Australian (88.1%, a difference of 0.010%), Greek (88.1%, a difference of 0.020%), Immigrants from Latvia (88.1%, a difference of 0.030%), Immigrants from Switzerland (88.1%, a difference of 0.040%), and Czech (88.1%, a difference of 0.050%).
| Demographics | Rating | Rank | GED/Equivalency |
| Immigrants | Scotland | 99.6 /100 | #43 | Exceptional 88.2% |
| Macedonians | 99.5 /100 | #44 | Exceptional 88.1% |
| Czechs | 99.5 /100 | #45 | Exceptional 88.1% |
| Immigrants | Switzerland | 99.5 /100 | #46 | Exceptional 88.1% |
| Immigrants | Latvia | 99.5 /100 | #47 | Exceptional 88.1% |
| Greeks | 99.5 /100 | #48 | Exceptional 88.1% |
| Australians | 99.5 /100 | #49 | Exceptional 88.1% |
| Immigrants | Korea | 99.5 /100 | #50 | Exceptional 88.1% |
| Immigrants | Netherlands | 99.4 /100 | #51 | Exceptional 88.0% |
| Zimbabweans | 99.4 /100 | #52 | Exceptional 88.0% |
| Immigrants | South Africa | 99.4 /100 | #53 | Exceptional 88.0% |
| Soviet Union | 99.4 /100 | #54 | Exceptional 88.0% |
| New Zealanders | 99.4 /100 | #55 | Exceptional 88.0% |
| Immigrants | Denmark | 99.4 /100 | #56 | Exceptional 88.0% |
| Immigrants | Czechoslovakia | 99.3 /100 | #57 | Exceptional 87.9% |
Demographics Similar to Puget Sound Salish by GED/Equivalency
In terms of ged/equivalency, the demographic groups most similar to Puget Sound Salish are Chippewa (85.2%, a difference of 0.0%), Tongan (85.2%, a difference of 0.0%), Costa Rican (85.2%, a difference of 0.010%), Delaware (85.2%, a difference of 0.040%), and South American Indian (85.2%, a difference of 0.060%).
| Demographics | Rating | Rank | GED/Equivalency |
| Immigrants | Afghanistan | 29.8 /100 | #187 | Fair 85.4% |
| Immigrants | Sierra Leone | 29.0 /100 | #188 | Fair 85.4% |
| Guamanians/Chamorros | 28.4 /100 | #189 | Fair 85.3% |
| Alaskan Athabascans | 27.5 /100 | #190 | Fair 85.3% |
| South American Indians | 22.8 /100 | #191 | Fair 85.2% |
| Immigrants | Nonimmigrants | 22.7 /100 | #192 | Fair 85.2% |
| Delaware | 22.2 /100 | #193 | Fair 85.2% |
| Puget Sound Salish | 20.8 /100 | #194 | Fair 85.2% |
| Chippewa | 20.8 /100 | #195 | Fair 85.2% |
| Tongans | 20.7 /100 | #196 | Fair 85.2% |
| Costa Ricans | 20.4 /100 | #197 | Fair 85.2% |
| Immigrants | Africa | 17.5 /100 | #198 | Poor 85.1% |
| Somalis | 16.4 /100 | #199 | Poor 85.0% |
| Uruguayans | 16.0 /100 | #200 | Poor 85.0% |
| Portuguese | 15.9 /100 | #201 | Poor 85.0% |