Shoshone vs Chilean Disability Age Under 5
COMPARE
Shoshone
Chilean
Disability Age Under 5
Disability Age Under 5 Comparison
Shoshone
Chileans
1.6%
DISABILITY AGE UNDER 5
0.0/ 100
METRIC RATING
300th/ 347
METRIC RANK
1.3%
DISABILITY AGE UNDER 5
18.8/ 100
METRIC RATING
212th/ 347
METRIC RANK
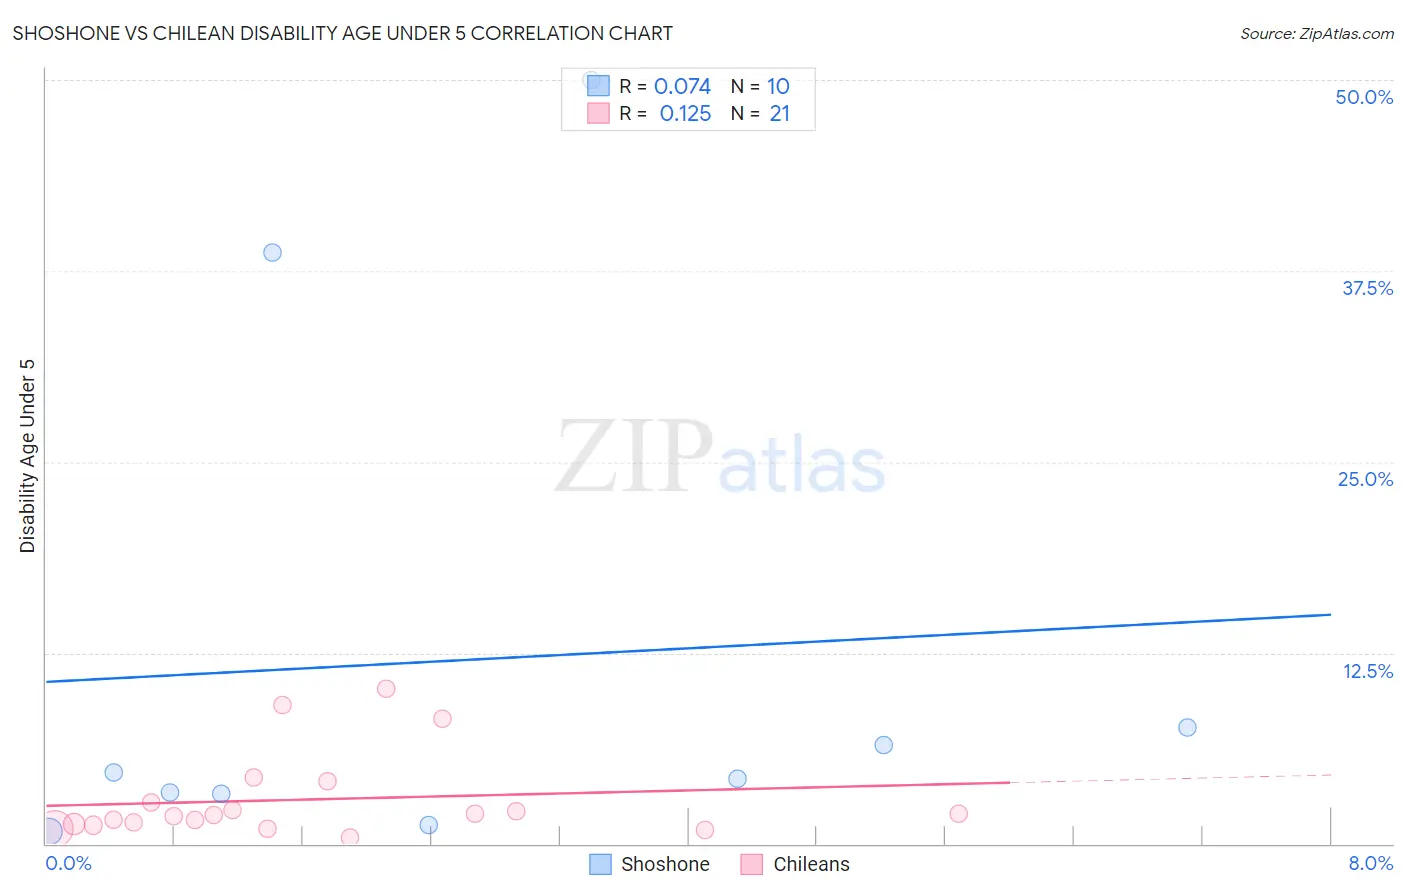
Shoshone vs Chilean Disability Age Under 5 Correlation Chart
The statistical analysis conducted on geographies consisting of 55,591,533 people shows a slight positive correlation between the proportion of Shoshone and percentage of population with a disability under the age of 5 in the United States with a correlation coefficient (R) of 0.074 and weighted average of 1.6%. Similarly, the statistical analysis conducted on geographies consisting of 158,592,796 people shows a poor positive correlation between the proportion of Chileans and percentage of population with a disability under the age of 5 in the United States with a correlation coefficient (R) of 0.125 and weighted average of 1.3%, a difference of 26.5%.
Disability Age Under 5 Correlation Summary
| Measurement | Shoshone | Chilean |
| Minimum | 0.81% | 0.43% |
| Maximum | 50.0% | 10.1% |
| Range | 49.2% | 9.7% |
| Mean | 12.0% | 2.9% |
| Median | 4.5% | 1.9% |
| Interquartile 25% (IQ1) | 3.3% | 1.3% |
| Interquartile 75% (IQ3) | 7.6% | 3.4% |
| Interquartile Range (IQR) | 4.3% | 2.1% |
| Standard Deviation (Sample) | 17.4% | 2.8% |
| Standard Deviation (Population) | 16.5% | 2.7% |
Similar Demographics by Disability Age Under 5
Demographics Similar to Shoshone by Disability Age Under 5
In terms of disability age under 5, the demographic groups most similar to Shoshone are Portuguese (1.6%, a difference of 0.33%), German Russian (1.6%, a difference of 0.44%), Welsh (1.6%, a difference of 0.56%), Swiss (1.6%, a difference of 0.72%), and Nonimmigrants (1.6%, a difference of 0.91%).
| Demographics | Rating | Rank | Disability Age Under 5 |
| Lithuanians | 0.0 /100 | #293 | Tragic 1.6% |
| Swedes | 0.0 /100 | #294 | Tragic 1.6% |
| Finns | 0.0 /100 | #295 | Tragic 1.6% |
| Poles | 0.0 /100 | #296 | Tragic 1.6% |
| Immigrants | Nonimmigrants | 0.0 /100 | #297 | Tragic 1.6% |
| Cajuns | 0.0 /100 | #298 | Tragic 1.6% |
| Portuguese | 0.0 /100 | #299 | Tragic 1.6% |
| Shoshone | 0.0 /100 | #300 | Tragic 1.6% |
| German Russians | 0.0 /100 | #301 | Tragic 1.6% |
| Welsh | 0.0 /100 | #302 | Tragic 1.6% |
| Swiss | 0.0 /100 | #303 | Tragic 1.6% |
| Seminole | 0.0 /100 | #304 | Tragic 1.6% |
| Blackfeet | 0.0 /100 | #305 | Tragic 1.6% |
| Creek | 0.0 /100 | #306 | Tragic 1.6% |
| Scottish | 0.0 /100 | #307 | Tragic 1.6% |
Demographics Similar to Chileans by Disability Age Under 5
In terms of disability age under 5, the demographic groups most similar to Chileans are Immigrants from Sudan (1.3%, a difference of 0.010%), Immigrants from Greece (1.3%, a difference of 0.040%), Bulgarian (1.3%, a difference of 0.090%), Pakistani (1.3%, a difference of 0.090%), and Immigrants from Chile (1.3%, a difference of 0.24%).
| Demographics | Rating | Rank | Disability Age Under 5 |
| Romanians | 22.5 /100 | #205 | Fair 1.3% |
| Immigrants | Poland | 22.4 /100 | #206 | Fair 1.3% |
| Nigerians | 21.2 /100 | #207 | Fair 1.3% |
| Mexicans | 20.8 /100 | #208 | Fair 1.3% |
| Bulgarians | 19.5 /100 | #209 | Poor 1.3% |
| Pakistanis | 19.4 /100 | #210 | Poor 1.3% |
| Immigrants | Greece | 19.1 /100 | #211 | Poor 1.3% |
| Chileans | 18.8 /100 | #212 | Poor 1.3% |
| Immigrants | Sudan | 18.7 /100 | #213 | Poor 1.3% |
| Immigrants | Chile | 17.2 /100 | #214 | Poor 1.3% |
| Syrians | 16.1 /100 | #215 | Poor 1.3% |
| Bangladeshis | 15.5 /100 | #216 | Poor 1.3% |
| Cypriots | 14.9 /100 | #217 | Poor 1.3% |
| Malaysians | 13.2 /100 | #218 | Poor 1.3% |
| Immigrants | Croatia | 11.2 /100 | #219 | Poor 1.3% |