Zip Codes with the Highest Percentage of Population with a Degree in Liberal Arts and History in Broomfield, CO
RELATED REPORTS & OPTIONS
Liberal Arts and History
Broomfield
Compare Zip Codes
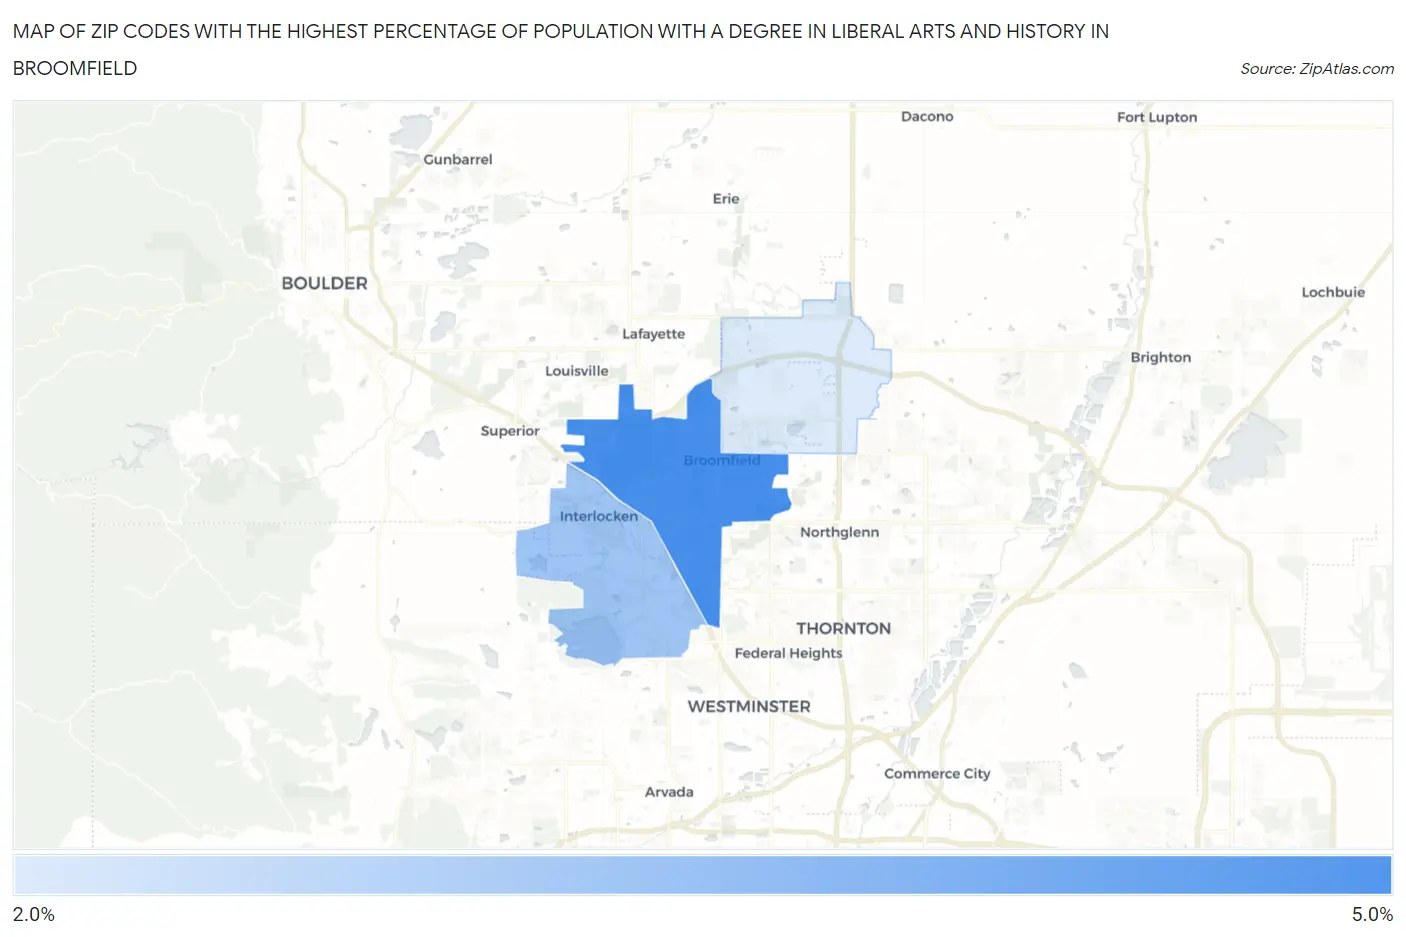
Map of Zip Codes with the Highest Percentage of Population with a Degree in Liberal Arts and History in Broomfield
0.0%
5.0%
Zip Codes with the Highest Percentage of Population with a Degree in Liberal Arts and History in Broomfield, CO
| Zip Code | % Graduates | vs State | vs National | |
| 1. | 80020 | 4.8% | 4.6%(+0.193)#163 | 4.9%(-0.048)#11,909 |
| 2. | 80021 | 3.2% | 4.6%(-1.44)#290 | 4.9%(-1.69)#17,705 |
| 3. | 80023 | 2.0% | 4.6%(-2.61)#336 | 4.9%(-2.85)#21,329 |
1
Common Questions
What are the Top Zip Codes with the Highest Percentage of Population with a Degree in Liberal Arts and History in Broomfield, CO?
Top Zip Codes with the Highest Percentage of Population with a Degree in Liberal Arts and History in Broomfield, CO are:
What zip code has the Highest Percentage of Population with a Degree in Liberal Arts and History in Broomfield, CO?
80020 has the Highest Percentage of Population with a Degree in Liberal Arts and History in Broomfield, CO with 4.8%.
What is the Percentage of Population with a Degree in Liberal Arts and History in Broomfield, CO?
Percentage of Population with a Degree in Liberal Arts and History in Broomfield is 3.6%.
What is the Percentage of Population with a Degree in Liberal Arts and History in Colorado?
Percentage of Population with a Degree in Liberal Arts and History in Colorado is 4.6%.
What is the Percentage of Population with a Degree in Liberal Arts and History in the United States?
Percentage of Population with a Degree in Liberal Arts and History in the United States is 4.9%.