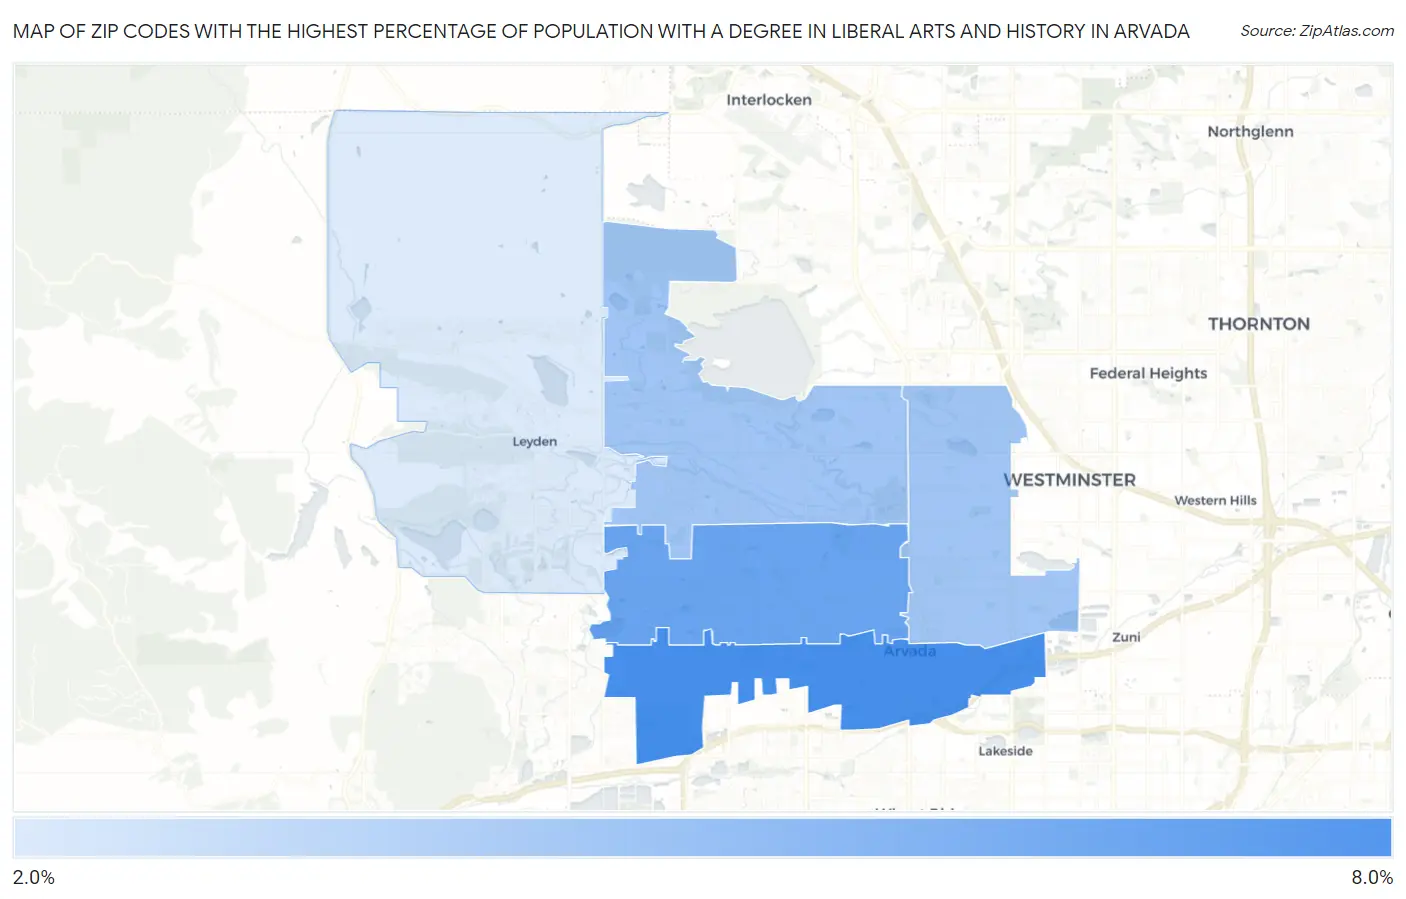
Zip Codes with the Highest Percentage of Population with a Degree in Liberal Arts and History in Arvada, CO
RELATED REPORTS & OPTIONS
Liberal Arts and History
Arvada
Compare Zip Codes
Map of Zip Codes with the Highest Percentage of Population with a Degree in Liberal Arts and History in Arvada
0.0%
8.0%
Zip Codes with the Highest Percentage of Population with a Degree in Liberal Arts and History in Arvada, CO
| Zip Code | % Graduates | vs State | vs National | |
| 1. | 80002 | 6.3% | 4.6%(+1.66)#98 | 4.9%(+1.42)#7,815 |
| 2. | 80004 | 5.4% | 4.6%(+0.725)#136 | 4.9%(+0.484)#10,261 |
| 3. | 80005 | 4.0% | 4.6%(-0.671)#237 | 4.9%(-0.912)#14,940 |
| 4. | 80003 | 4.0% | 4.6%(-0.674)#238 | 4.9%(-0.915)#14,955 |
| 5. | 80007 | 2.4% | 4.6%(-2.23)#322 | 4.9%(-2.47)#20,270 |
1
Common Questions
What are the Top 3 Zip Codes with the Highest Percentage of Population with a Degree in Liberal Arts and History in Arvada, CO?
Top 3 Zip Codes with the Highest Percentage of Population with a Degree in Liberal Arts and History in Arvada, CO are:
What zip code has the Highest Percentage of Population with a Degree in Liberal Arts and History in Arvada, CO?
80002 has the Highest Percentage of Population with a Degree in Liberal Arts and History in Arvada, CO with 6.3%.
What is the Percentage of Population with a Degree in Liberal Arts and History in Arvada, CO?
Percentage of Population with a Degree in Liberal Arts and History in Arvada is 4.2%.
What is the Percentage of Population with a Degree in Liberal Arts and History in Colorado?
Percentage of Population with a Degree in Liberal Arts and History in Colorado is 4.6%.
What is the Percentage of Population with a Degree in Liberal Arts and History in the United States?
Percentage of Population with a Degree in Liberal Arts and History in the United States is 4.9%.