Zip Codes with the Highest Percentage of Population with a Degree in Liberal Arts and History in Englewood, CO
RELATED REPORTS & OPTIONS
Liberal Arts and History
Englewood
Compare Zip Codes
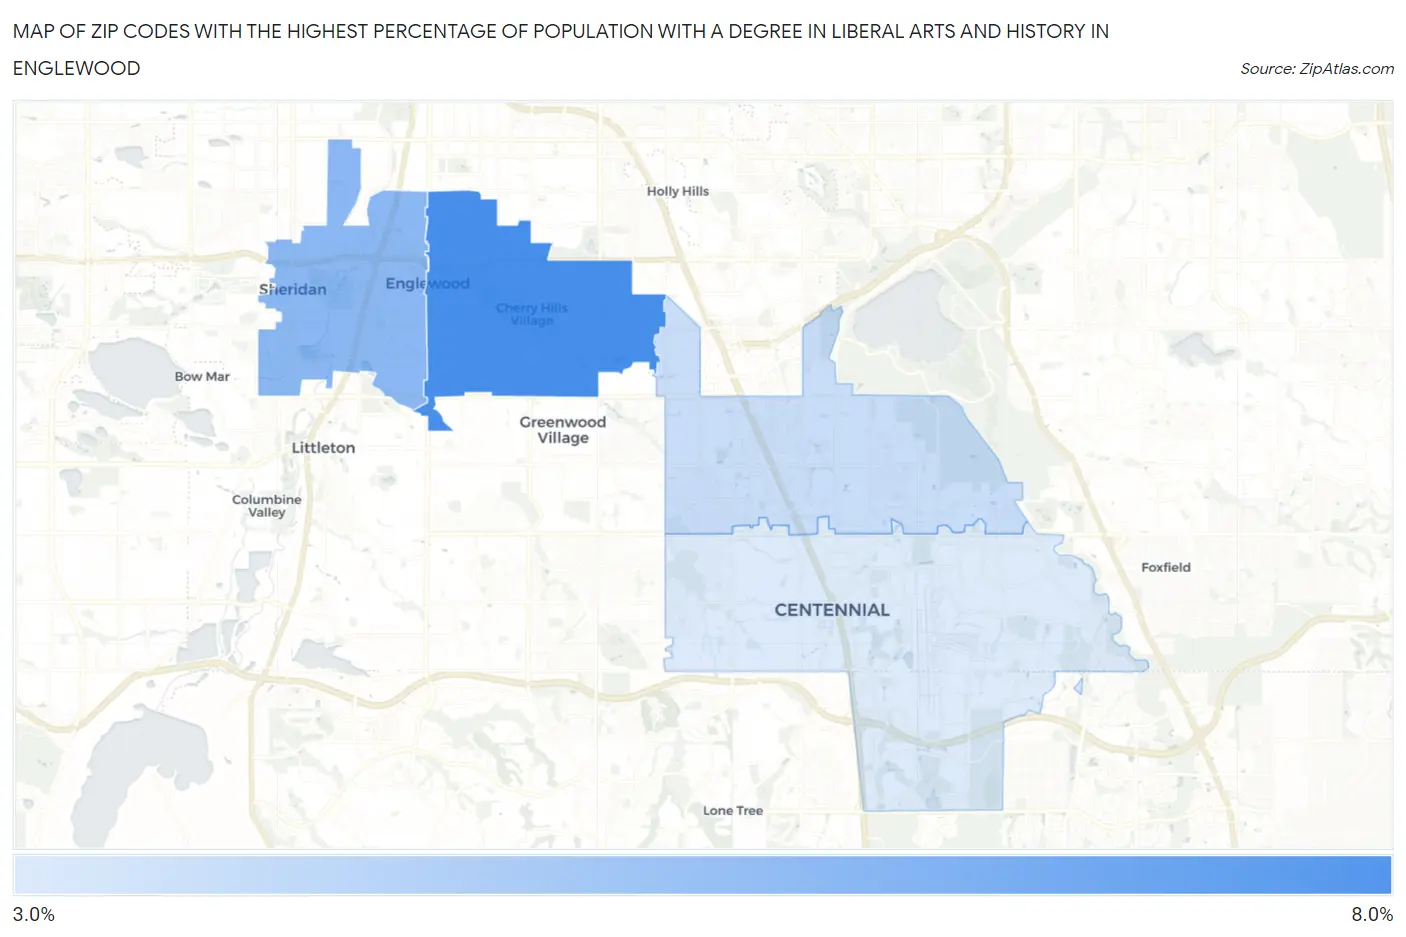
Map of Zip Codes with the Highest Percentage of Population with a Degree in Liberal Arts and History in Englewood
0.0%
8.0%
Zip Codes with the Highest Percentage of Population with a Degree in Liberal Arts and History in Englewood, CO
| Zip Code | % Graduates | vs State | vs National | |
| 1. | 80113 | 6.1% | 4.6%(+1.45)#104 | 4.9%(+1.21)#8,313 |
| 2. | 80110 | 4.8% | 4.6%(+0.161)#166 | 4.9%(-0.080)#11,997 |
| 3. | 80111 | 3.6% | 4.6%(-1.01)#262 | 4.9%(-1.25)#16,155 |
| 4. | 80112 | 3.3% | 4.6%(-1.38)#285 | 4.9%(-1.62)#17,472 |
1
Common Questions
What are the Top 3 Zip Codes with the Highest Percentage of Population with a Degree in Liberal Arts and History in Englewood, CO?
Top 3 Zip Codes with the Highest Percentage of Population with a Degree in Liberal Arts and History in Englewood, CO are:
What zip code has the Highest Percentage of Population with a Degree in Liberal Arts and History in Englewood, CO?
80113 has the Highest Percentage of Population with a Degree in Liberal Arts and History in Englewood, CO with 6.1%.
What is the Percentage of Population with a Degree in Liberal Arts and History in Englewood, CO?
Percentage of Population with a Degree in Liberal Arts and History in Englewood is 5.2%.
What is the Percentage of Population with a Degree in Liberal Arts and History in Colorado?
Percentage of Population with a Degree in Liberal Arts and History in Colorado is 4.6%.
What is the Percentage of Population with a Degree in Liberal Arts and History in the United States?
Percentage of Population with a Degree in Liberal Arts and History in the United States is 4.9%.