Zip Codes with the Highest Percentage of Population with a Degree in Liberal Arts and History in Boulder, CO
RELATED REPORTS & OPTIONS
Liberal Arts and History
Boulder
Compare Zip Codes
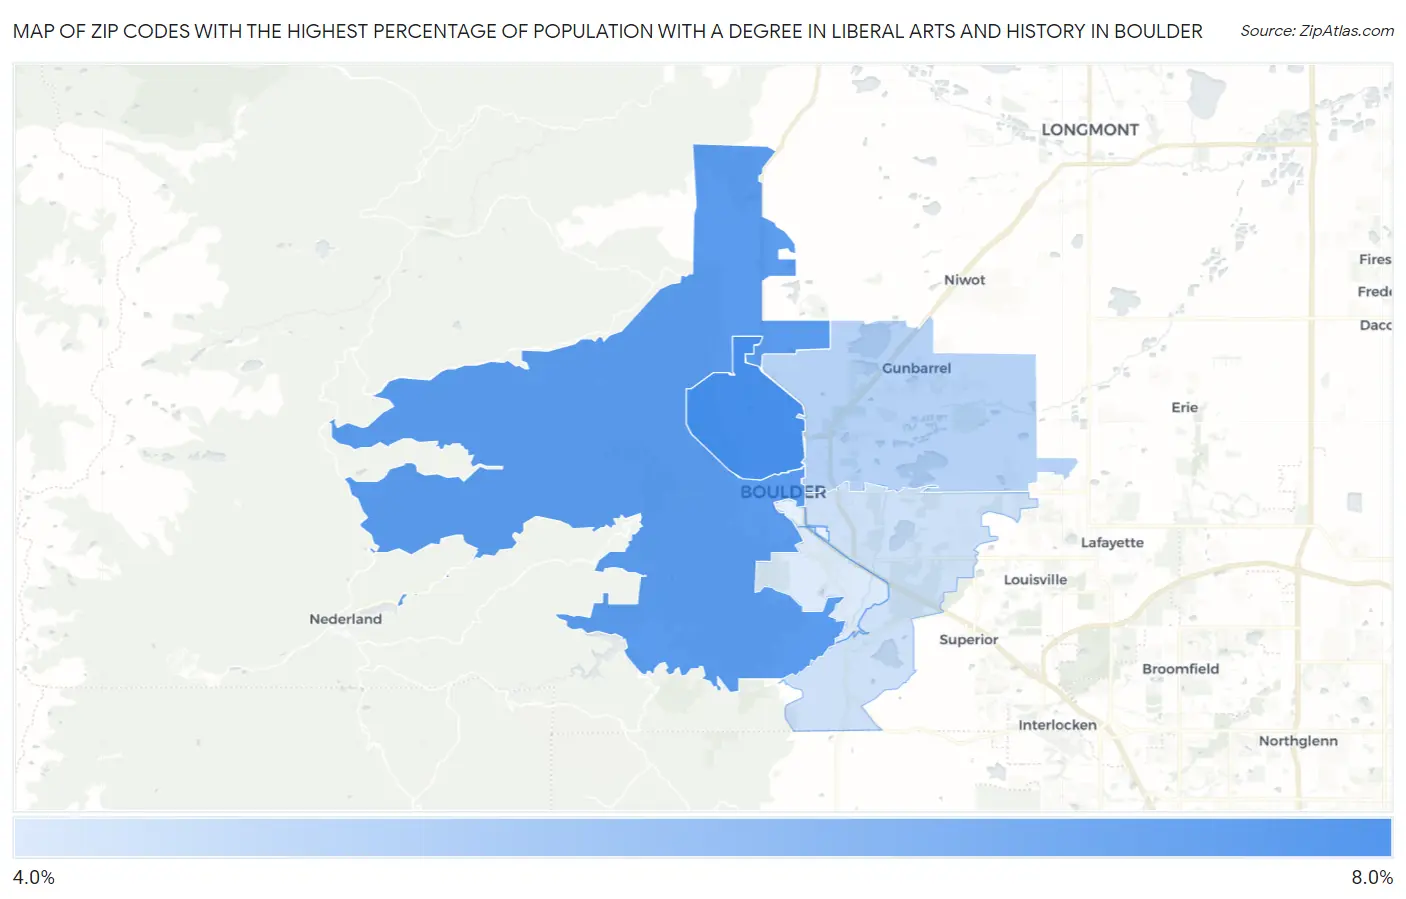
Map of Zip Codes with the Highest Percentage of Population with a Degree in Liberal Arts and History in Boulder
0.0%
8.0%
Zip Codes with the Highest Percentage of Population with a Degree in Liberal Arts and History in Boulder, CO
| Zip Code | % Graduates | vs State | vs National | |
| 1. | 80304 | 7.3% | 4.6%(+2.69)#57 | 4.9%(+2.45)#5,841 |
| 2. | 80302 | 6.9% | 4.6%(+2.31)#63 | 4.9%(+2.07)#6,490 |
| 3. | 80301 | 4.9% | 4.6%(+0.252)#158 | 4.9%(+0.011)#11,694 |
| 4. | 80303 | 4.4% | 4.6%(-0.260)#196 | 4.9%(-0.501)#13,396 |
| 5. | 80305 | 4.1% | 4.6%(-0.571)#225 | 4.9%(-0.812)#14,544 |
1
Common Questions
What are the Top 5 Zip Codes with the Highest Percentage of Population with a Degree in Liberal Arts and History in Boulder, CO?
Top 5 Zip Codes with the Highest Percentage of Population with a Degree in Liberal Arts and History in Boulder, CO are:
What zip code has the Highest Percentage of Population with a Degree in Liberal Arts and History in Boulder, CO?
80304 has the Highest Percentage of Population with a Degree in Liberal Arts and History in Boulder, CO with 7.3%.
What is the Percentage of Population with a Degree in Liberal Arts and History in Boulder, CO?
Percentage of Population with a Degree in Liberal Arts and History in Boulder is 5.7%.
What is the Percentage of Population with a Degree in Liberal Arts and History in Colorado?
Percentage of Population with a Degree in Liberal Arts and History in Colorado is 4.6%.
What is the Percentage of Population with a Degree in Liberal Arts and History in the United States?
Percentage of Population with a Degree in Liberal Arts and History in the United States is 4.9%.