Zip Codes with the Highest Percentage of Population Employed in Business & Financial in San Jose, CA
RELATED REPORTS & OPTIONS
Business & Financial
San Jose
Compare Zip Codes
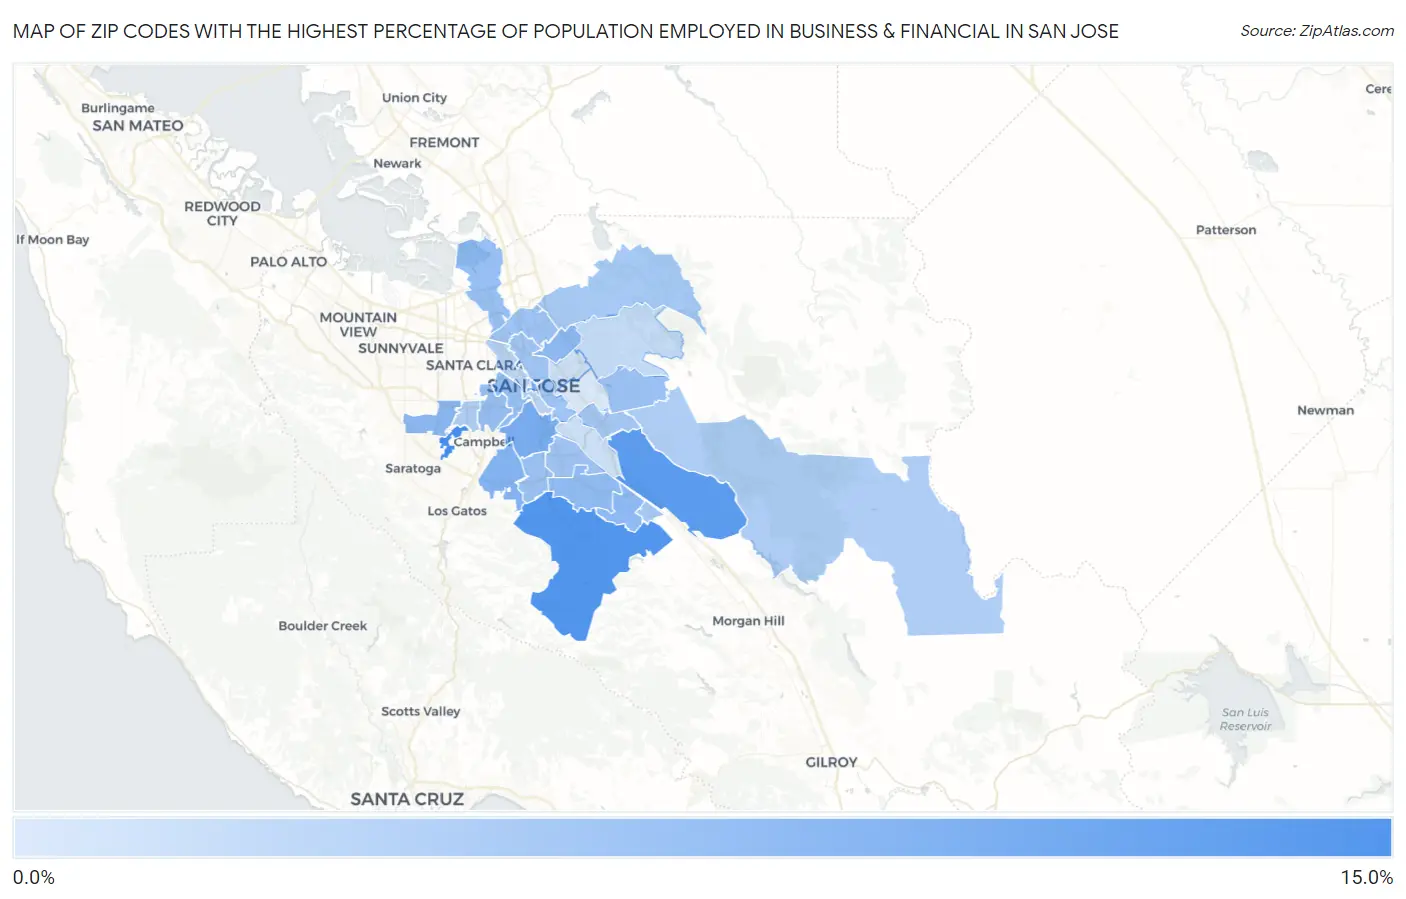
Map of Zip Codes with the Highest Percentage of Population Employed in Business & Financial in San Jose
0.0%
15.0%
Zip Codes with the Highest Percentage of Population Employed in Business & Financial in San Jose, CA
| Zip Code | % Employed | vs State | vs National | |
| 1. | 95130 | 11.7% | 5.8%(+5.86)#94 | 5.8%(+5.89)#1,341 |
| 2. | 95120 | 11.0% | 5.8%(+5.16)#125 | 5.8%(+5.20)#1,672 |
| 3. | 95138 | 10.5% | 5.8%(+4.68)#149 | 5.8%(+4.71)#1,915 |
| 4. | 95125 | 8.5% | 5.8%(+2.75)#294 | 5.8%(+2.78)#3,543 |
| 5. | 95113 | 8.1% | 5.8%(+2.29)#330 | 5.8%(+2.32)#4,139 |
| 6. | 95124 | 7.8% | 5.8%(+2.03)#359 | 5.8%(+2.07)#4,489 |
| 7. | 95129 | 7.4% | 5.8%(+1.63)#412 | 5.8%(+1.67)#5,089 |
| 8. | 95119 | 7.4% | 5.8%(+1.59)#420 | 5.8%(+1.62)#5,167 |
| 9. | 95133 | 7.3% | 5.8%(+1.47)#432 | 5.8%(+1.51)#5,361 |
| 10. | 95123 | 7.2% | 5.8%(+1.43)#438 | 5.8%(+1.46)#5,434 |
| 11. | 95134 | 6.8% | 5.8%(+1.01)#485 | 5.8%(+1.04)#6,163 |
| 12. | 95126 | 6.7% | 5.8%(+0.941)#491 | 5.8%(+0.975)#6,294 |
| 13. | 95128 | 6.7% | 5.8%(+0.926)#494 | 5.8%(+0.960)#6,321 |
| 14. | 95118 | 6.5% | 5.8%(+0.740)#520 | 5.8%(+0.774)#6,696 |
| 15. | 95148 | 6.5% | 5.8%(+0.695)#529 | 5.8%(+0.729)#6,793 |
| 16. | 95131 | 6.3% | 5.8%(+0.541)#541 | 5.8%(+0.575)#7,082 |
| 17. | 95112 | 6.3% | 5.8%(+0.477)#553 | 5.8%(+0.511)#7,210 |
| 18. | 95136 | 6.2% | 5.8%(+0.391)#575 | 5.8%(+0.426)#7,400 |
| 19. | 95121 | 5.9% | 5.8%(+0.134)#616 | 5.8%(+0.168)#7,993 |
| 20. | 95139 | 5.8% | 5.8%(+0.051)#627 | 5.8%(+0.085)#8,191 |
| 21. | 95132 | 5.8% | 5.8%(+0.040)#630 | 5.8%(+0.074)#8,215 |
| 22. | 95135 | 5.5% | 5.8%(-0.318)#686 | 5.8%(-0.284)#9,090 |
| 23. | 95117 | 5.3% | 5.8%(-0.453)#706 | 5.8%(-0.418)#9,458 |
| 24. | 95110 | 4.5% | 5.8%(-1.25)#855 | 5.8%(-1.22)#11,930 |
| 25. | 95127 | 4.1% | 5.8%(-1.73)#929 | 5.8%(-1.69)#13,601 |
| 26. | 95116 | 3.6% | 5.8%(-2.19)#1,023 | 5.8%(-2.16)#15,395 |
| 27. | 95111 | 3.6% | 5.8%(-2.20)#1,026 | 5.8%(-2.16)#15,429 |
| 28. | 95122 | 2.8% | 5.8%(-3.04)#1,187 | 5.8%(-3.01)#18,837 |
1
Common Questions
What are the Top 10 Zip Codes with the Highest Percentage of Population Employed in Business & Financial in San Jose, CA?
Top 10 Zip Codes with the Highest Percentage of Population Employed in Business & Financial in San Jose, CA are:
What zip code has the Highest Percentage of Population Employed in Business & Financial in San Jose, CA?
95130 has the Highest Percentage of Population Employed in Business & Financial in San Jose, CA with 11.7%.
What is the Percentage of Population Employed in Business & Financial in San Jose, CA?
Percentage of Population Employed in Business & Financial in San Jose is 6.4%.
What is the Percentage of Population Employed in Business & Financial in California?
Percentage of Population Employed in Business & Financial in California is 5.8%.
What is the Percentage of Population Employed in Business & Financial in the United States?
Percentage of Population Employed in Business & Financial in the United States is 5.8%.