Zip Codes with the Highest Percentage of Population Employed in Administrative & Support Services in La Puente, CA
RELATED REPORTS & OPTIONS
Administrative & Support Services
La Puente
Compare Zip Codes
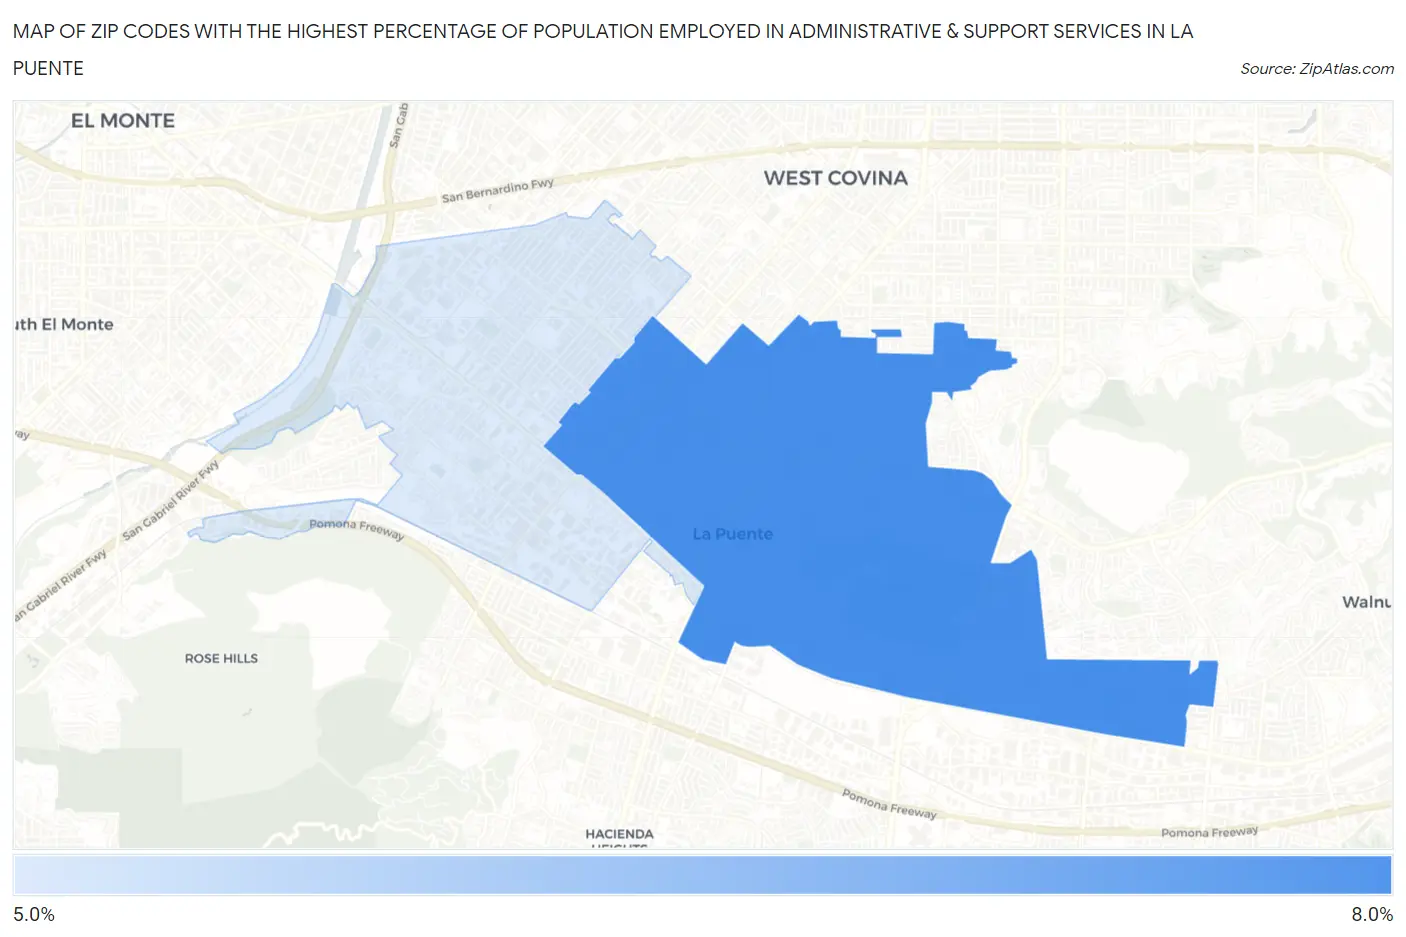
Map of Zip Codes with the Highest Percentage of Population Employed in Administrative & Support Services in La Puente
0.0%
8.0%
Zip Codes with the Highest Percentage of Population Employed in Administrative & Support Services in La Puente, CA
| Zip Code | % Employed | vs State | vs National | |
| 1. | 91744 | 6.6% | 4.6%(+2.00)#281 | 4.1%(+2.42)#3,810 |
| 2. | 91746 | 5.9% | 4.6%(+1.28)#371 | 4.1%(+1.70)#5,044 |
1
Common Questions
What are the Top Zip Codes with the Highest Percentage of Population Employed in Administrative & Support Services in La Puente, CA?
Top Zip Codes with the Highest Percentage of Population Employed in Administrative & Support Services in La Puente, CA are:
What zip code has the Highest Percentage of Population Employed in Administrative & Support Services in La Puente, CA?
91744 has the Highest Percentage of Population Employed in Administrative & Support Services in La Puente, CA with 6.6%.
What is the Percentage of Population Employed in Administrative & Support Services in La Puente, CA?
Percentage of Population Employed in Administrative & Support Services in La Puente is 6.2%.
What is the Percentage of Population Employed in Administrative & Support Services in California?
Percentage of Population Employed in Administrative & Support Services in California is 4.6%.
What is the Percentage of Population Employed in Administrative & Support Services in the United States?
Percentage of Population Employed in Administrative & Support Services in the United States is 4.1%.