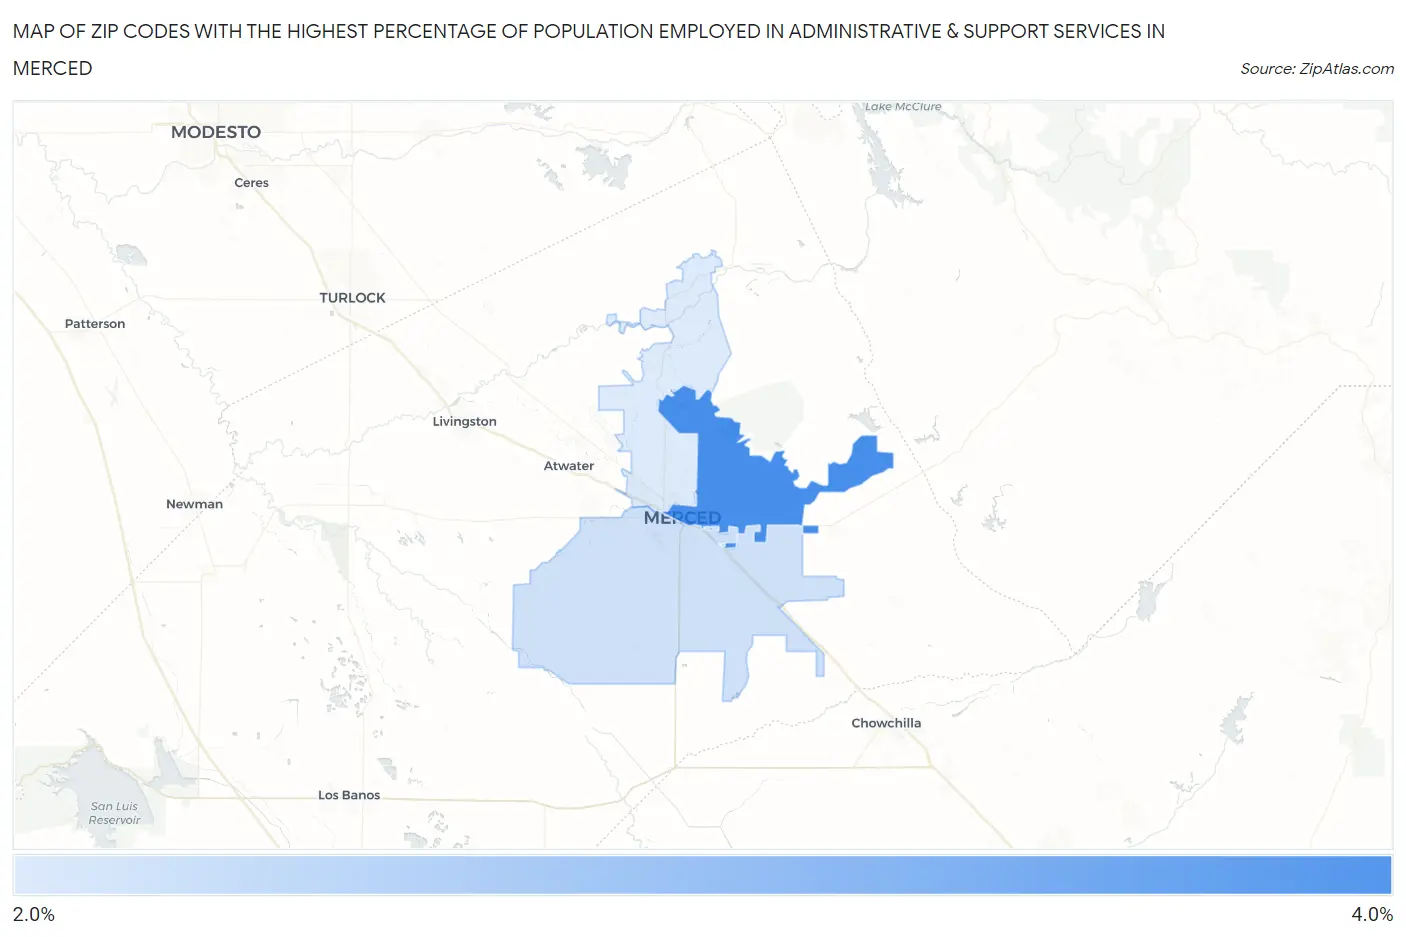
Zip Codes with the Highest Percentage of Population Employed in Administrative & Support Services in Merced, CA
RELATED REPORTS & OPTIONS
Administrative & Support Services
Merced
Compare Zip Codes
Map of Zip Codes with the Highest Percentage of Population Employed in Administrative & Support Services in Merced
0.0%
4.0%
Zip Codes with the Highest Percentage of Population Employed in Administrative & Support Services in Merced, CA
| Zip Code | % Employed | vs State | vs National | |
| 1. | 95340 | 3.6% | 4.6%(-0.940)#887 | 4.1%(-0.521)#12,337 |
| 2. | 95341 | 3.0% | 4.6%(-1.58)#1,084 | 4.1%(-1.16)#15,534 |
| 3. | 95348 | 2.9% | 4.6%(-1.64)#1,104 | 4.1%(-1.22)#15,856 |
1
Common Questions
What are the Top Zip Codes with the Highest Percentage of Population Employed in Administrative & Support Services in Merced, CA?
Top Zip Codes with the Highest Percentage of Population Employed in Administrative & Support Services in Merced, CA are:
What zip code has the Highest Percentage of Population Employed in Administrative & Support Services in Merced, CA?
95340 has the Highest Percentage of Population Employed in Administrative & Support Services in Merced, CA with 3.6%.
What is the Percentage of Population Employed in Administrative & Support Services in Merced, CA?
Percentage of Population Employed in Administrative & Support Services in Merced is 3.0%.
What is the Percentage of Population Employed in Administrative & Support Services in California?
Percentage of Population Employed in Administrative & Support Services in California is 4.6%.
What is the Percentage of Population Employed in Administrative & Support Services in the United States?
Percentage of Population Employed in Administrative & Support Services in the United States is 4.1%.