Zip Codes with the Highest Percentage of Population Employed in Legal Services & Support in La Puente, CA
RELATED REPORTS & OPTIONS
Legal Services & Support
La Puente
Compare Zip Codes
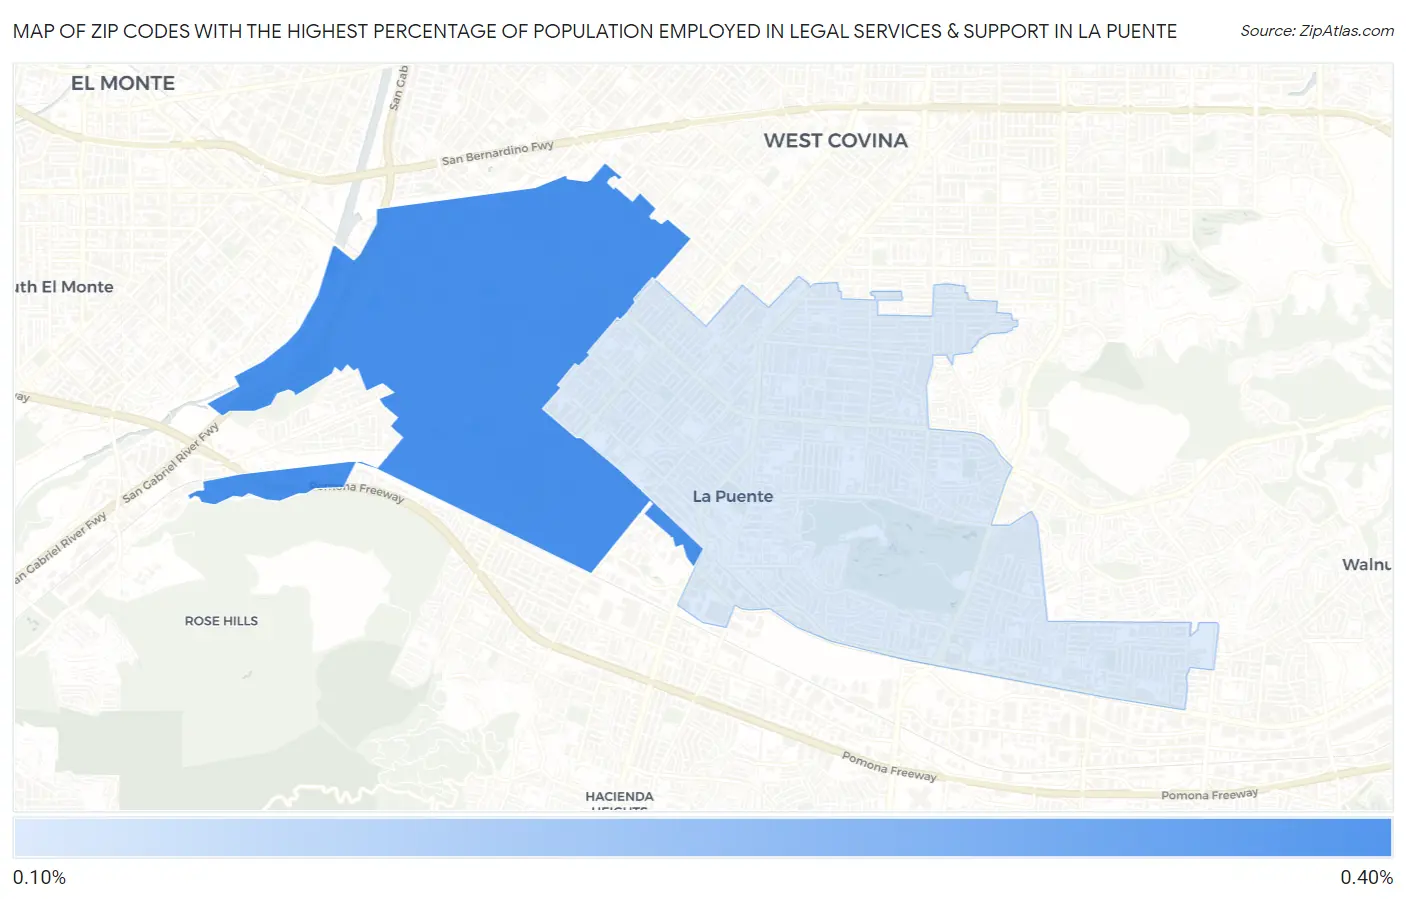
Map of Zip Codes with the Highest Percentage of Population Employed in Legal Services & Support in La Puente
0.0%
0.40%
Zip Codes with the Highest Percentage of Population Employed in Legal Services & Support in La Puente, CA
| Zip Code | % Employed | vs State | vs National | |
| 1. | 91746 | 0.39% | 1.3%(-0.868)#1,010 | 1.2%(-0.794)#13,941 |
| 2. | 91744 | 0.14% | 1.3%(-1.11)#1,146 | 1.2%(-1.04)#16,751 |
1
Common Questions
What are the Top Zip Codes with the Highest Percentage of Population Employed in Legal Services & Support in La Puente, CA?
Top Zip Codes with the Highest Percentage of Population Employed in Legal Services & Support in La Puente, CA are:
What zip code has the Highest Percentage of Population Employed in Legal Services & Support in La Puente, CA?
91746 has the Highest Percentage of Population Employed in Legal Services & Support in La Puente, CA with 0.39%.
What is the Percentage of Population Employed in Legal Services & Support in La Puente, CA?
Percentage of Population Employed in Legal Services & Support in La Puente is 0.12%.
What is the Percentage of Population Employed in Legal Services & Support in California?
Percentage of Population Employed in Legal Services & Support in California is 1.3%.
What is the Percentage of Population Employed in Legal Services & Support in the United States?
Percentage of Population Employed in Legal Services & Support in the United States is 1.2%.