Zip Codes with the Highest Percentage of Population Employed in Administrative & Support Services in San Clemente, CA
RELATED REPORTS & OPTIONS
Administrative & Support Services
San Clemente
Compare Zip Codes
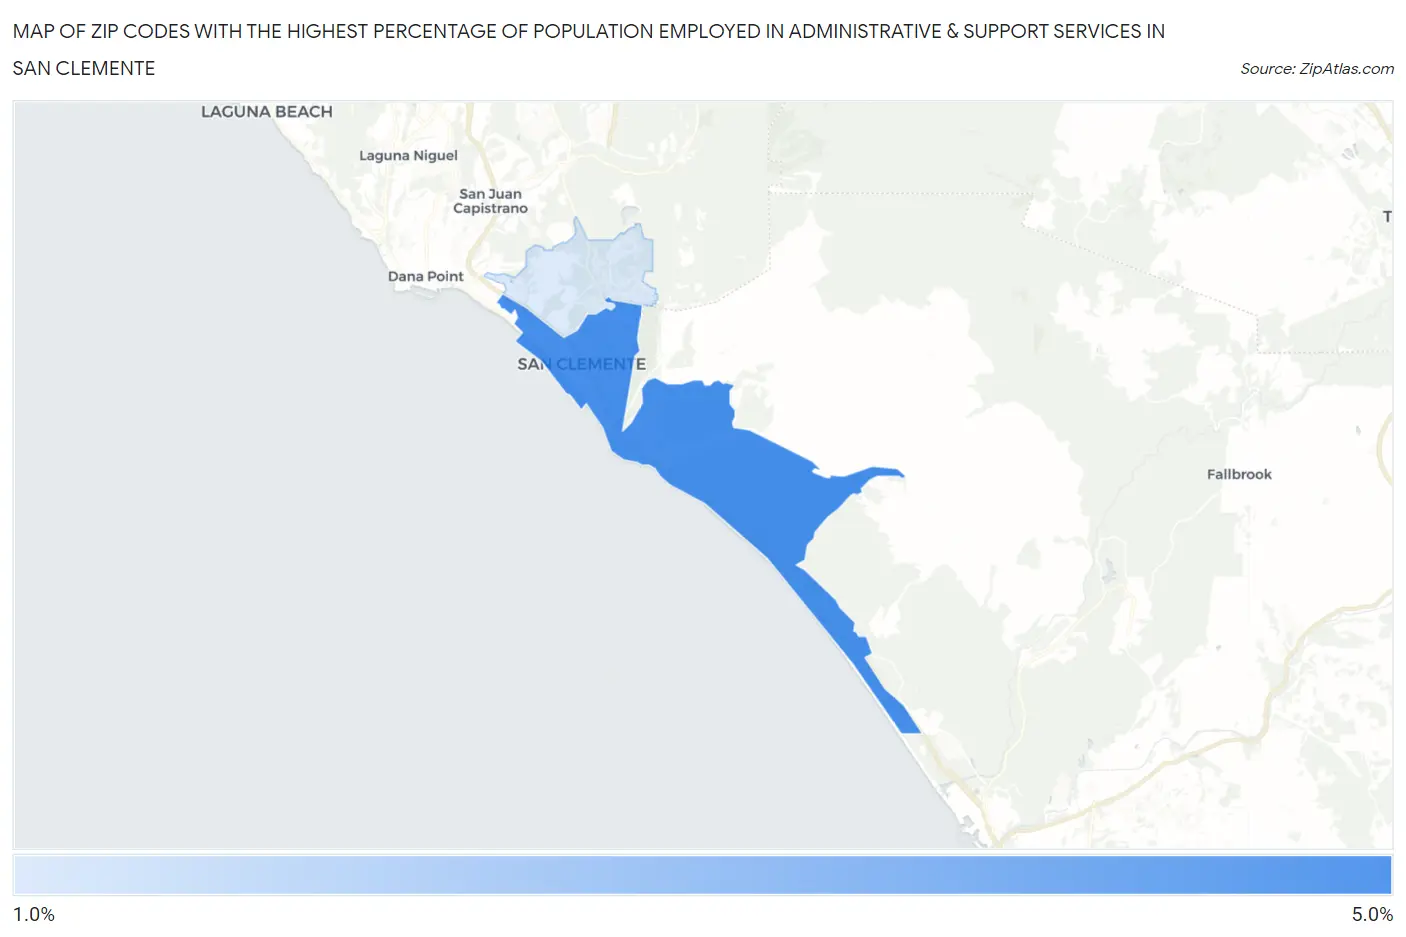
Map of Zip Codes with the Highest Percentage of Population Employed in Administrative & Support Services in San Clemente
0.0%
5.0%
Zip Codes with the Highest Percentage of Population Employed in Administrative & Support Services in San Clemente, CA
| Zip Code | % Employed | vs State | vs National | |
| 1. | 92672 | 4.3% | 4.6%(-0.224)#699 | 4.1%(+0.196)#9,308 |
| 2. | 92673 | 1.7% | 4.6%(-2.86)#1,375 | 4.1%(-2.44)#21,907 |
1
Common Questions
What are the Top Zip Codes with the Highest Percentage of Population Employed in Administrative & Support Services in San Clemente, CA?
Top Zip Codes with the Highest Percentage of Population Employed in Administrative & Support Services in San Clemente, CA are:
What zip code has the Highest Percentage of Population Employed in Administrative & Support Services in San Clemente, CA?
92672 has the Highest Percentage of Population Employed in Administrative & Support Services in San Clemente, CA with 4.3%.
What is the Percentage of Population Employed in Administrative & Support Services in San Clemente, CA?
Percentage of Population Employed in Administrative & Support Services in San Clemente is 3.3%.
What is the Percentage of Population Employed in Administrative & Support Services in California?
Percentage of Population Employed in Administrative & Support Services in California is 4.6%.
What is the Percentage of Population Employed in Administrative & Support Services in the United States?
Percentage of Population Employed in Administrative & Support Services in the United States is 4.1%.