Zip Codes with the Highest Percentage of Population Employed in Administrative & Support Services in Victorville, CA
RELATED REPORTS & OPTIONS
Administrative & Support Services
Victorville
Compare Zip Codes
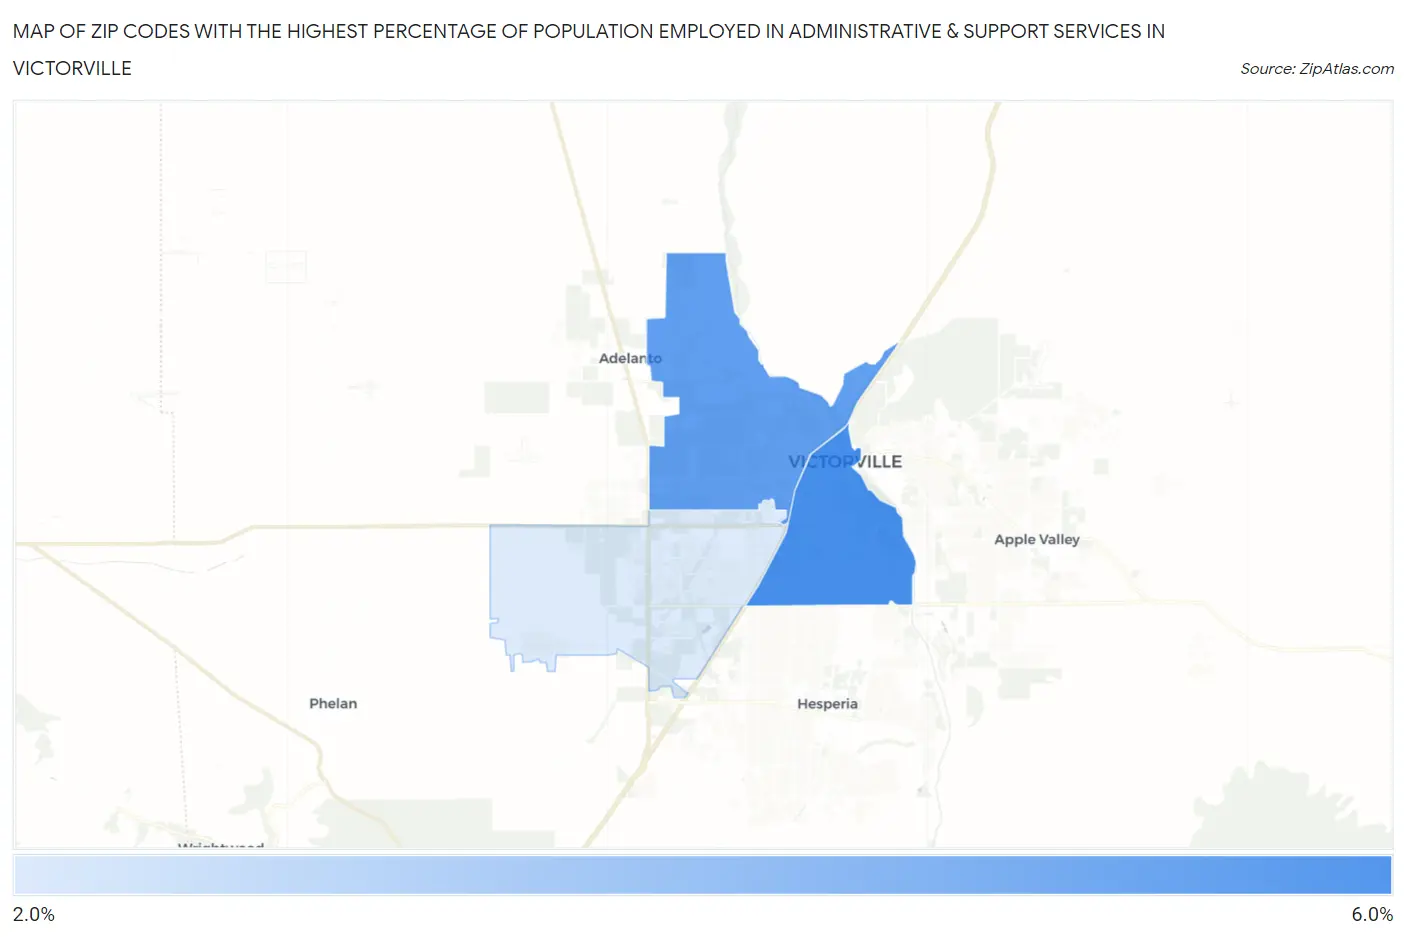
Map of Zip Codes with the Highest Percentage of Population Employed in Administrative & Support Services in Victorville
0.0%
6.0%
Zip Codes with the Highest Percentage of Population Employed in Administrative & Support Services in Victorville, CA
| Zip Code | % Employed | vs State | vs National | |
| 1. | 92395 | 5.4% | 4.6%(+0.849)#447 | 4.1%(+1.27)#6,028 |
| 2. | 92394 | 5.0% | 4.6%(+0.398)#528 | 4.1%(+0.817)#7,197 |
| 3. | 92392 | 2.8% | 4.6%(-1.76)#1,135 | 4.1%(-1.34)#16,517 |
1
Common Questions
What are the Top Zip Codes with the Highest Percentage of Population Employed in Administrative & Support Services in Victorville, CA?
Top Zip Codes with the Highest Percentage of Population Employed in Administrative & Support Services in Victorville, CA are:
What zip code has the Highest Percentage of Population Employed in Administrative & Support Services in Victorville, CA?
92395 has the Highest Percentage of Population Employed in Administrative & Support Services in Victorville, CA with 5.4%.
What is the Percentage of Population Employed in Administrative & Support Services in Victorville, CA?
Percentage of Population Employed in Administrative & Support Services in Victorville is 4.2%.
What is the Percentage of Population Employed in Administrative & Support Services in California?
Percentage of Population Employed in Administrative & Support Services in California is 4.6%.
What is the Percentage of Population Employed in Administrative & Support Services in the United States?
Percentage of Population Employed in Administrative & Support Services in the United States is 4.1%.