Zip Codes with the Highest Percentage of Population Employed in Administrative & Support Services in Hemet, CA
RELATED REPORTS & OPTIONS
Administrative & Support Services
Hemet
Compare Zip Codes
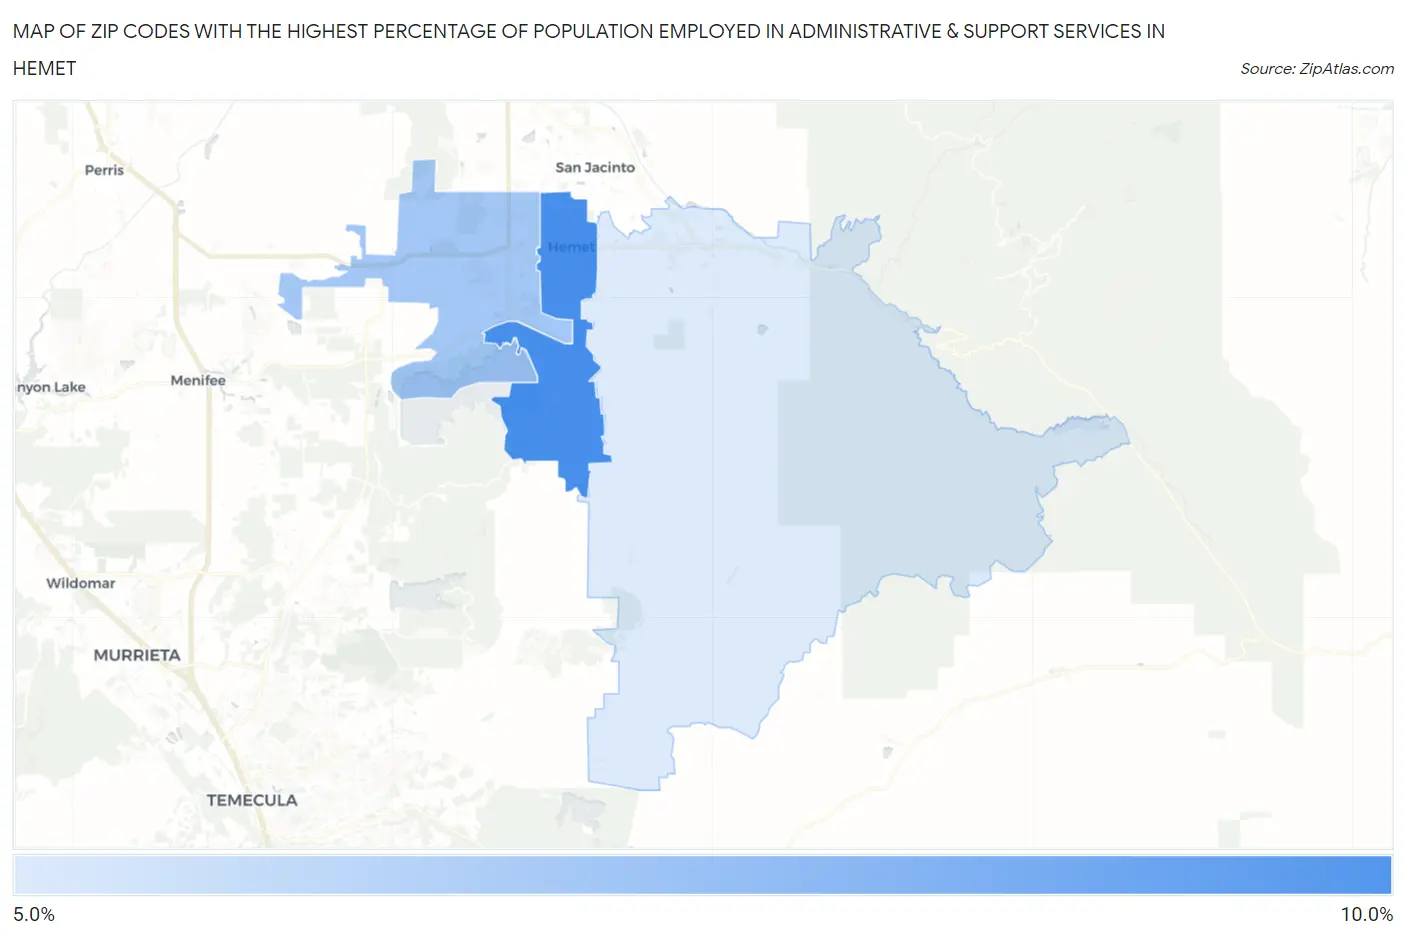
Map of Zip Codes with the Highest Percentage of Population Employed in Administrative & Support Services in Hemet
0.0%
10.0%
Zip Codes with the Highest Percentage of Population Employed in Administrative & Support Services in Hemet, CA
| Zip Code | % Employed | vs State | vs National | |
| 1. | 92543 | 8.1% | 4.6%(+3.56)#146 | 4.1%(+3.98)#2,187 |
| 2. | 92545 | 6.7% | 4.6%(+2.09)#266 | 4.1%(+2.51)#3,694 |
| 3. | 92544 | 5.7% | 4.6%(+1.15)#397 | 4.1%(+1.57)#5,316 |
1
Common Questions
What are the Top Zip Codes with the Highest Percentage of Population Employed in Administrative & Support Services in Hemet, CA?
Top Zip Codes with the Highest Percentage of Population Employed in Administrative & Support Services in Hemet, CA are:
What zip code has the Highest Percentage of Population Employed in Administrative & Support Services in Hemet, CA?
92543 has the Highest Percentage of Population Employed in Administrative & Support Services in Hemet, CA with 8.1%.
What is the Percentage of Population Employed in Administrative & Support Services in Hemet, CA?
Percentage of Population Employed in Administrative & Support Services in Hemet is 6.7%.
What is the Percentage of Population Employed in Administrative & Support Services in California?
Percentage of Population Employed in Administrative & Support Services in California is 4.6%.
What is the Percentage of Population Employed in Administrative & Support Services in the United States?
Percentage of Population Employed in Administrative & Support Services in the United States is 4.1%.