Zip Codes with the Highest Percentage of Population Employed in Administrative & Support Services in Los Altos, CA
RELATED REPORTS & OPTIONS
Administrative & Support Services
Los Altos
Compare Zip Codes
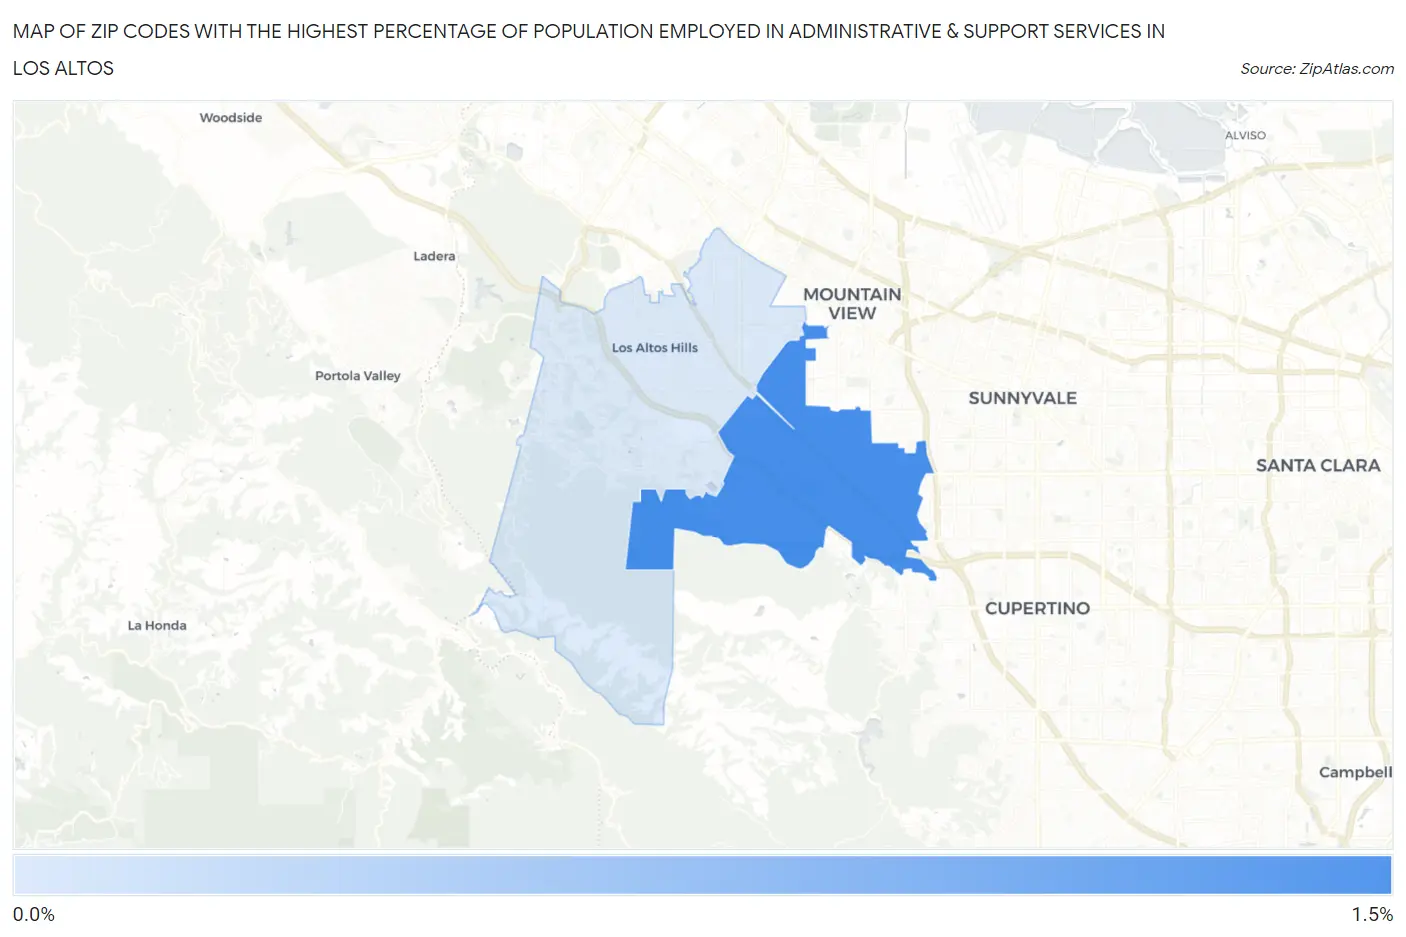
Map of Zip Codes with the Highest Percentage of Population Employed in Administrative & Support Services in Los Altos
0.0%
1.5%
Zip Codes with the Highest Percentage of Population Employed in Administrative & Support Services in Los Altos, CA
| Zip Code | % Employed | vs State | vs National | |
| 1. | 94024 | 1.1% | 4.6%(-3.43)#1,439 | 4.1%(-3.01)#24,043 |
| 2. | 94022 | 0.38% | 4.6%(-4.19)#1,475 | 4.1%(-3.77)#26,102 |
1
Common Questions
What are the Top Zip Codes with the Highest Percentage of Population Employed in Administrative & Support Services in Los Altos, CA?
Top Zip Codes with the Highest Percentage of Population Employed in Administrative & Support Services in Los Altos, CA are:
What zip code has the Highest Percentage of Population Employed in Administrative & Support Services in Los Altos, CA?
94024 has the Highest Percentage of Population Employed in Administrative & Support Services in Los Altos, CA with 1.1%.
What is the Percentage of Population Employed in Administrative & Support Services in Los Altos, CA?
Percentage of Population Employed in Administrative & Support Services in Los Altos is 0.57%.
What is the Percentage of Population Employed in Administrative & Support Services in California?
Percentage of Population Employed in Administrative & Support Services in California is 4.6%.
What is the Percentage of Population Employed in Administrative & Support Services in the United States?
Percentage of Population Employed in Administrative & Support Services in the United States is 4.1%.