Zip Codes with the Highest Percentage of Households Without a Vehicle in Fresno, CA
RELATED REPORTS & OPTIONS
Households without a Cars
Fresno
Compare Zip Codes
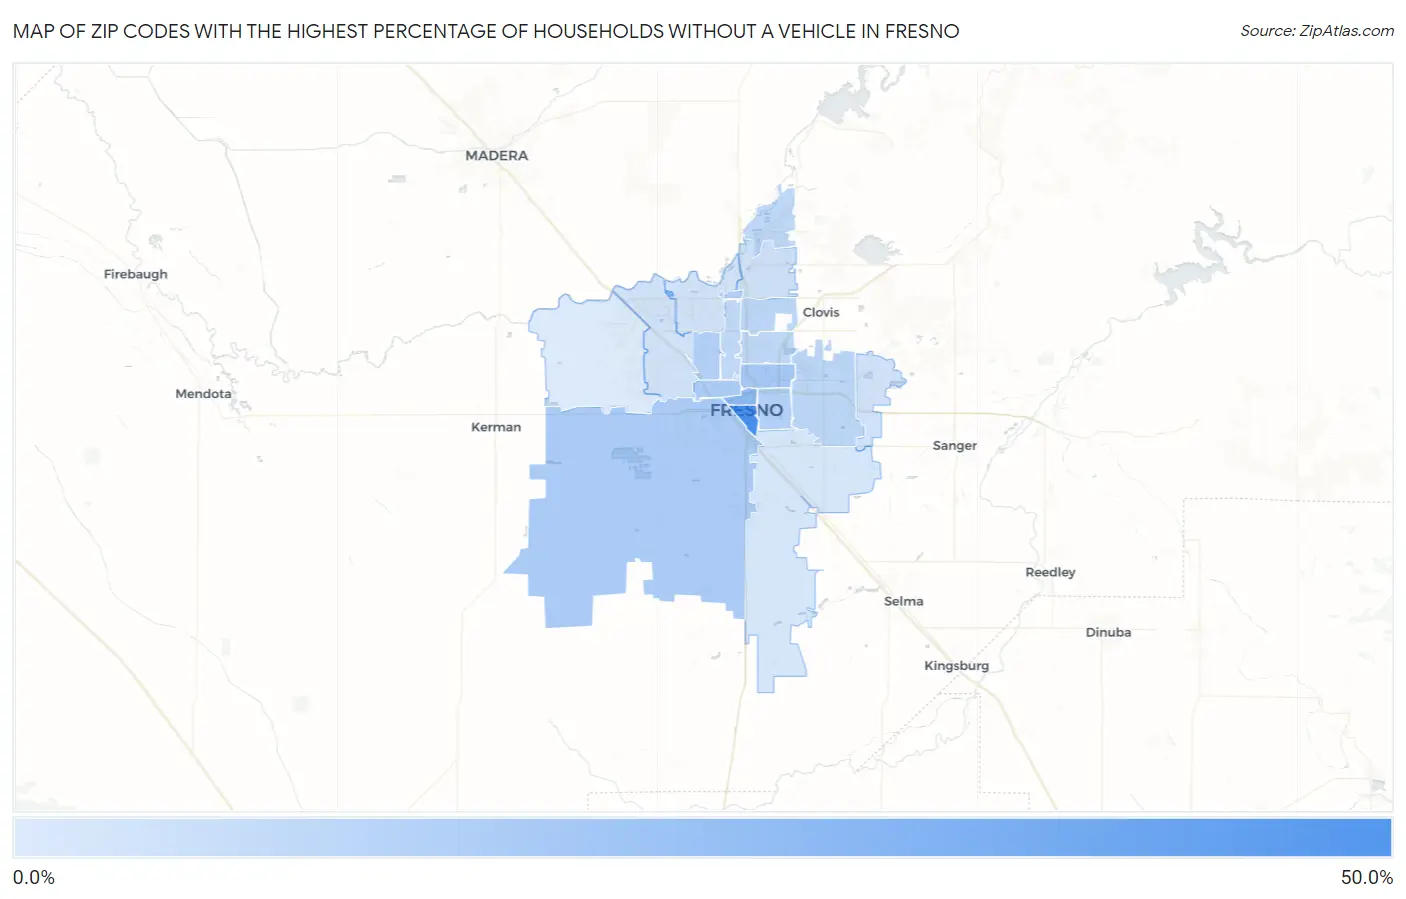
Map of Zip Codes with the Highest Percentage of Households Without a Vehicle in Fresno
0.0%
50.0%
Zip Codes with the Highest Percentage of Households Without a Vehicle in Fresno, CA
| Zip Code | Housholds Without a Car | vs State | vs National | |
| 1. | 93721 | 41.3% | 6.9%(+34.4)#21 | 8.3%(+33.0)#487 |
| 2. | 93701 | 20.6% | 6.9%(+13.7)#60 | 8.3%(+12.3)#1,431 |
| 3. | 93703 | 14.1% | 6.9%(+7.20)#131 | 8.3%(+5.80)#2,659 |
| 4. | 93706 | 13.2% | 6.9%(+6.30)#148 | 8.3%(+4.90)#3,002 |
| 5. | 93728 | 12.8% | 6.9%(+5.90)#156 | 8.3%(+4.50)#3,184 |
| 6. | 93705 | 11.1% | 6.9%(+4.20)#188 | 8.3%(+2.80)#4,070 |
| 7. | 93650 | 10.8% | 6.9%(+3.90)#196 | 8.3%(+2.50)#4,277 |
| 8. | 93702 | 10.6% | 6.9%(+3.70)#205 | 8.3%(+2.30)#4,375 |
| 9. | 93727 | 8.5% | 6.9%(+1.60)#309 | 8.3%(+0.200)#6,292 |
| 10. | 93710 | 8.4% | 6.9%(+1.50)#327 | 8.3%(+0.100)#6,428 |
| 11. | 93726 | 8.1% | 6.9%(+1.20)#351 | 8.3%(-0.200)#6,781 |
| 12. | 93730 | 8.1% | 6.9%(+1.20)#353 | 8.3%(-0.200)#6,824 |
| 13. | 93704 | 7.5% | 6.9%(+0.600)#403 | 8.3%(-0.800)#7,699 |
| 14. | 93720 | 4.1% | 6.9%(-2.80)#901 | 8.3%(-4.20)#15,359 |
| 15. | 93711 | 3.9% | 6.9%(-3.00)#948 | 8.3%(-4.40)#15,993 |
| 16. | 93737 | 3.8% | 6.9%(-3.10)#975 | 8.3%(-4.50)#16,454 |
| 17. | 93722 | 3.5% | 6.9%(-3.40)#1,018 | 8.3%(-4.80)#17,278 |
| 18. | 93725 | 2.6% | 6.9%(-4.30)#1,196 | 8.3%(-5.70)#20,429 |
| 19. | 93723 | 1.0% | 6.9%(-5.90)#1,434 | 8.3%(-7.30)#25,630 |
1
Common Questions
What are the Top 10 Zip Codes with the Highest Percentage of Households Without a Vehicle in Fresno, CA?
Top 10 Zip Codes with the Highest Percentage of Households Without a Vehicle in Fresno, CA are:
What zip code has the Highest Percentage of Households Without a Vehicle in Fresno, CA?
93721 has the Highest Percentage of Households Without a Vehicle in Fresno, CA with 41.3%.
What is the Percentage of Households Without a Vehicle in Fresno, CA?
Percentage of Households Without a Vehicle in Fresno is 8.8%.
What is the Percentage of Households Without a Vehicle in California?
Percentage of Households Without a Vehicle in California is 6.9%.
What is the Percentage of Households Without a Vehicle in the United States?
Percentage of Households Without a Vehicle in the United States is 8.3%.