Zip Codes with the Highest Percentage of Population Employed in Administrative & Support Services in Phoenix, AZ
RELATED REPORTS & OPTIONS
Administrative & Support Services
Phoenix
Compare Zip Codes
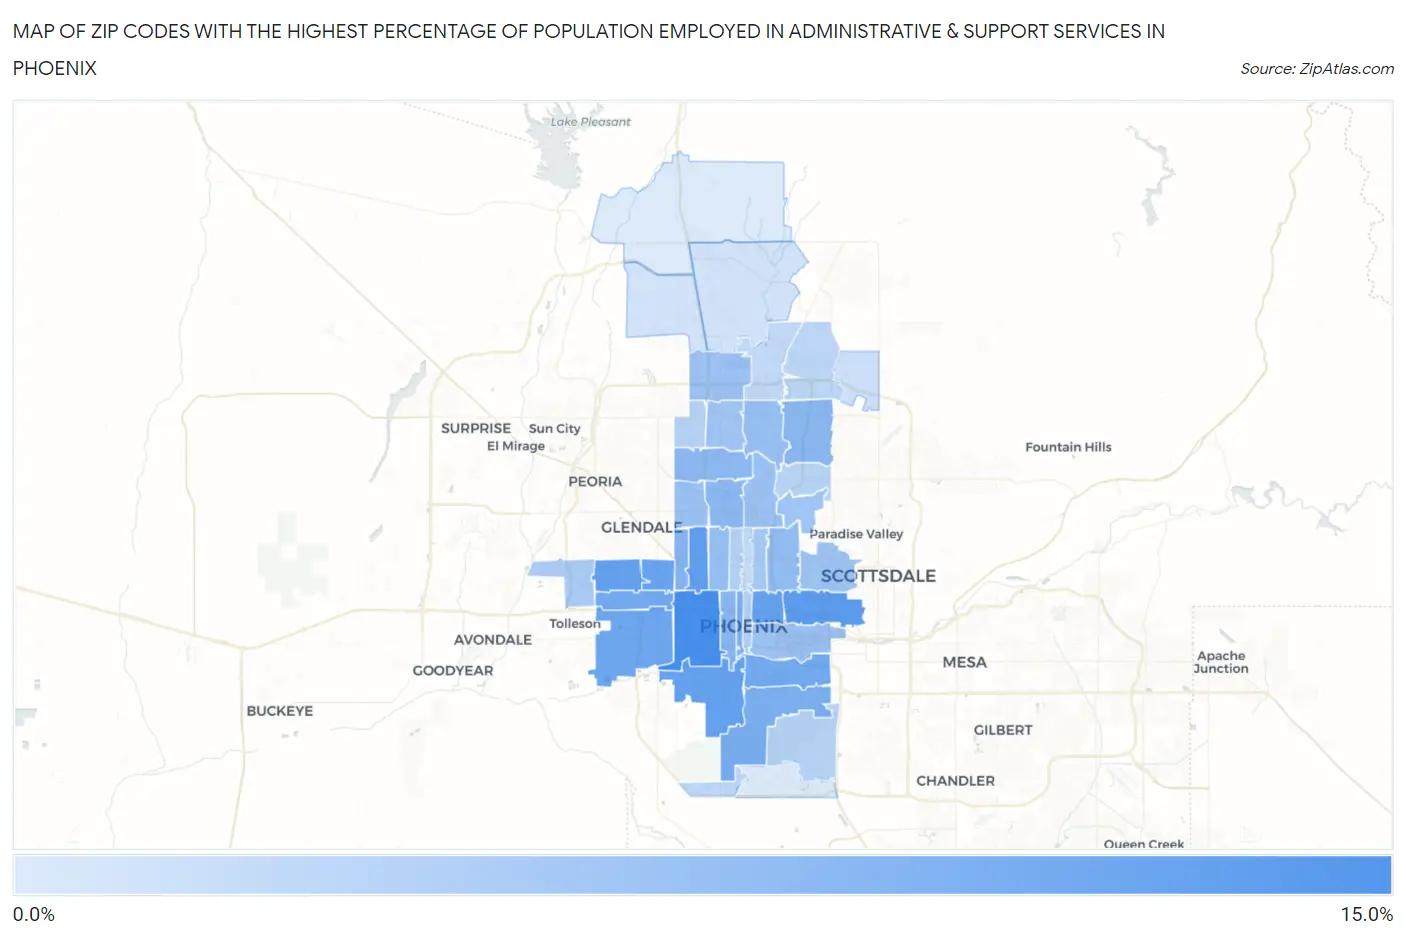
Map of Zip Codes with the Highest Percentage of Population Employed in Administrative & Support Services in Phoenix
0.0%
15.0%
Zip Codes with the Highest Percentage of Population Employed in Administrative & Support Services in Phoenix, AZ
| Zip Code | % Employed | vs State | vs National | |
| 1. | 85009 | 11.7% | 5.4%(+6.35)#12 | 4.1%(+7.55)#891 |
| 2. | 85008 | 10.5% | 5.4%(+5.12)#20 | 4.1%(+6.32)#1,159 |
| 3. | 85017 | 10.0% | 5.4%(+4.65)#21 | 4.1%(+5.86)#1,281 |
| 4. | 85033 | 9.9% | 5.4%(+4.50)#24 | 4.1%(+5.70)#1,340 |
| 5. | 85006 | 9.7% | 5.4%(+4.37)#26 | 4.1%(+5.57)#1,388 |
| 6. | 85041 | 9.6% | 5.4%(+4.26)#31 | 4.1%(+5.47)#1,426 |
| 7. | 85031 | 9.4% | 5.4%(+4.00)#33 | 4.1%(+5.20)#1,527 |
| 8. | 85043 | 9.0% | 5.4%(+3.67)#36 | 4.1%(+4.88)#1,678 |
| 9. | 85040 | 8.8% | 5.4%(+3.45)#40 | 4.1%(+4.65)#1,792 |
| 10. | 85035 | 8.8% | 5.4%(+3.43)#41 | 4.1%(+4.63)#1,802 |
| 11. | 85042 | 8.1% | 5.4%(+2.74)#49 | 4.1%(+3.94)#2,211 |
| 12. | 85003 | 7.9% | 5.4%(+2.58)#54 | 4.1%(+3.79)#2,322 |
| 13. | 85019 | 7.6% | 5.4%(+2.22)#57 | 4.1%(+3.43)#2,617 |
| 14. | 85007 | 7.4% | 5.4%(+2.09)#61 | 4.1%(+3.30)#2,743 |
| 15. | 85032 | 7.3% | 5.4%(+1.92)#66 | 4.1%(+3.13)#2,912 |
| 16. | 85029 | 7.1% | 5.4%(+1.72)#72 | 4.1%(+2.92)#3,139 |
| 17. | 85021 | 7.1% | 5.4%(+1.71)#73 | 4.1%(+2.91)#3,156 |
| 18. | 85016 | 6.7% | 5.4%(+1.35)#84 | 4.1%(+2.56)#3,611 |
| 19. | 85022 | 6.4% | 5.4%(+1.06)#93 | 4.1%(+2.26)#4,055 |
| 20. | 85015 | 6.3% | 5.4%(+0.935)#98 | 4.1%(+2.14)#4,254 |
| 21. | 85034 | 6.2% | 5.4%(+0.861)#100 | 4.1%(+2.07)#4,379 |
| 22. | 85020 | 6.2% | 5.4%(+0.852)#101 | 4.1%(+2.06)#4,395 |
| 23. | 85051 | 6.2% | 5.4%(+0.822)#103 | 4.1%(+2.03)#4,453 |
| 24. | 85027 | 6.0% | 5.4%(+0.680)#110 | 4.1%(+1.88)#4,713 |
| 25. | 85018 | 6.0% | 5.4%(+0.596)#114 | 4.1%(+1.80)#4,878 |
| 26. | 85023 | 5.8% | 5.4%(+0.437)#118 | 4.1%(+1.64)#5,168 |
| 27. | 85014 | 5.3% | 5.4%(-0.089)#136 | 4.1%(+1.12)#6,416 |
| 28. | 85037 | 5.1% | 5.4%(-0.231)#141 | 4.1%(+0.973)#6,787 |
| 29. | 85004 | 4.8% | 5.4%(-0.585)#160 | 4.1%(+0.619)#7,824 |
| 30. | 85013 | 4.5% | 5.4%(-0.900)#174 | 4.1%(+0.305)#8,863 |
| 31. | 85053 | 4.4% | 5.4%(-0.996)#180 | 4.1%(+0.209)#9,243 |
| 32. | 85044 | 4.3% | 5.4%(-1.01)#181 | 4.1%(+0.192)#9,317 |
| 33. | 85028 | 4.1% | 5.4%(-1.26)#196 | 4.1%(-0.055)#10,252 |
| 34. | 85050 | 4.0% | 5.4%(-1.36)#204 | 4.1%(-0.153)#10,709 |
| 35. | 85045 | 3.8% | 5.4%(-1.53)#212 | 4.1%(-0.327)#11,432 |
| 36. | 85024 | 3.7% | 5.4%(-1.64)#220 | 4.1%(-0.432)#11,913 |
| 37. | 85012 | 3.5% | 5.4%(-1.90)#233 | 4.1%(-0.698)#13,204 |
| 38. | 85054 | 3.0% | 5.4%(-2.38)#257 | 4.1%(-1.18)#15,612 |
| 39. | 85085 | 2.8% | 5.4%(-2.60)#266 | 4.1%(-1.39)#16,807 |
| 40. | 85083 | 2.7% | 5.4%(-2.62)#267 | 4.1%(-1.42)#16,935 |
| 41. | 85048 | 2.0% | 5.4%(-3.32)#295 | 4.1%(-2.12)#20,472 |
| 42. | 85086 | 2.0% | 5.4%(-3.37)#296 | 4.1%(-2.17)#20,712 |
1
Common Questions
What are the Top 10 Zip Codes with the Highest Percentage of Population Employed in Administrative & Support Services in Phoenix, AZ?
Top 10 Zip Codes with the Highest Percentage of Population Employed in Administrative & Support Services in Phoenix, AZ are:
What zip code has the Highest Percentage of Population Employed in Administrative & Support Services in Phoenix, AZ?
85009 has the Highest Percentage of Population Employed in Administrative & Support Services in Phoenix, AZ with 11.7%.
What is the Percentage of Population Employed in Administrative & Support Services in Phoenix, AZ?
Percentage of Population Employed in Administrative & Support Services in Phoenix is 6.6%.
What is the Percentage of Population Employed in Administrative & Support Services in Arizona?
Percentage of Population Employed in Administrative & Support Services in Arizona is 5.4%.
What is the Percentage of Population Employed in Administrative & Support Services in the United States?
Percentage of Population Employed in Administrative & Support Services in the United States is 4.1%.