Zip Codes with the Highest Percentage of Population Employed in Administrative & Support Services in Lake Havasu City, AZ
RELATED REPORTS & OPTIONS
Administrative & Support Services
Lake Havasu City
Compare Zip Codes
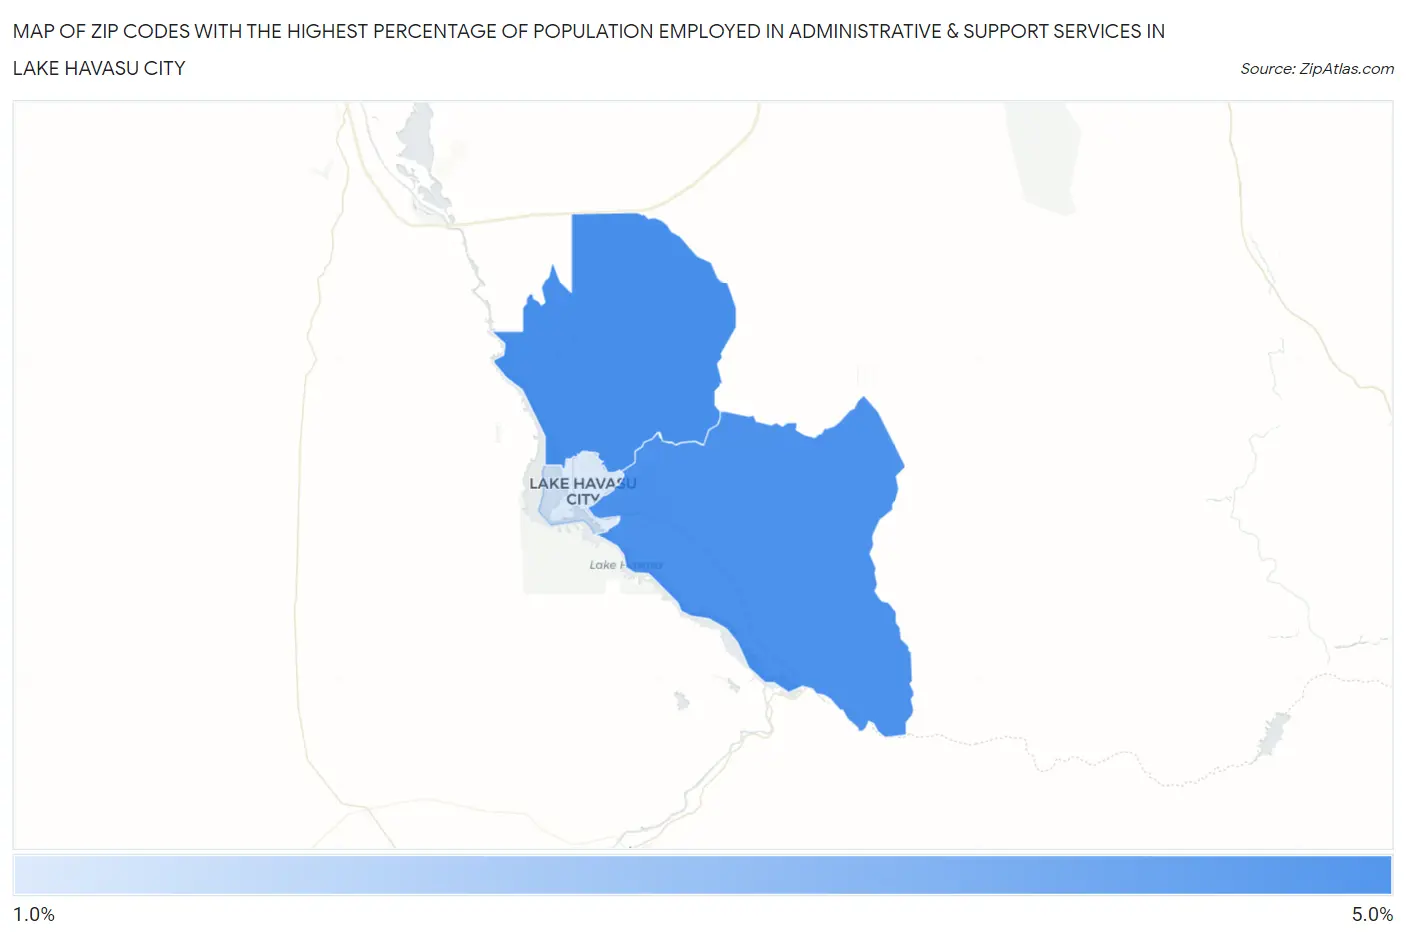
Map of Zip Codes with the Highest Percentage of Population Employed in Administrative & Support Services in Lake Havasu City
0.0%
5.0%
Zip Codes with the Highest Percentage of Population Employed in Administrative & Support Services in Lake Havasu City, AZ
| Zip Code | % Employed | vs State | vs National | |
| 1. | 86404 | 4.5% | 5.4%(-0.854)#172 | 4.1%(+0.350)#8,720 |
| 2. | 86406 | 4.4% | 5.4%(-0.920)#175 | 4.1%(+0.284)#8,941 |
| 3. | 86403 | 1.7% | 5.4%(-3.64)#305 | 4.1%(-2.44)#21,895 |
1
Common Questions
What are the Top Zip Codes with the Highest Percentage of Population Employed in Administrative & Support Services in Lake Havasu City, AZ?
Top Zip Codes with the Highest Percentage of Population Employed in Administrative & Support Services in Lake Havasu City, AZ are:
What zip code has the Highest Percentage of Population Employed in Administrative & Support Services in Lake Havasu City, AZ?
86404 has the Highest Percentage of Population Employed in Administrative & Support Services in Lake Havasu City, AZ with 4.5%.
What is the Percentage of Population Employed in Administrative & Support Services in Lake Havasu City, AZ?
Percentage of Population Employed in Administrative & Support Services in Lake Havasu City is 3.8%.
What is the Percentage of Population Employed in Administrative & Support Services in Arizona?
Percentage of Population Employed in Administrative & Support Services in Arizona is 5.4%.
What is the Percentage of Population Employed in Administrative & Support Services in the United States?
Percentage of Population Employed in Administrative & Support Services in the United States is 4.1%.