Zip Codes with the Highest Percentage of Households Without a Vehicle in Sedona, AZ
RELATED REPORTS & OPTIONS
Households without a Cars
Sedona
Compare Zip Codes
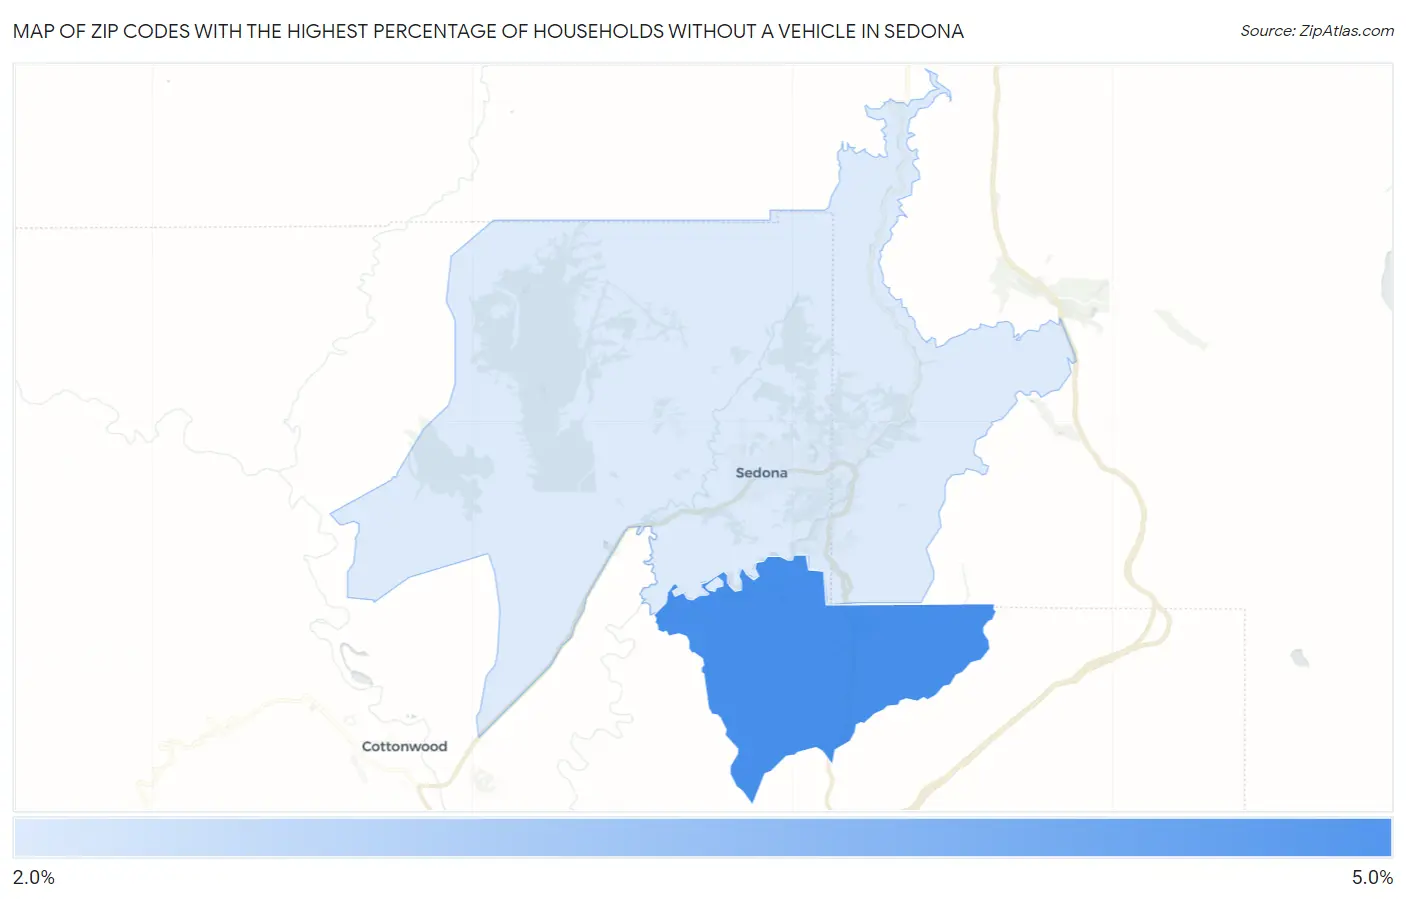
Map of Zip Codes with the Highest Percentage of Households Without a Vehicle in Sedona
0.0%
5.0%
Zip Codes with the Highest Percentage of Households Without a Vehicle in Sedona, AZ
| Zip Code | Housholds Without a Car | vs State | vs National | |
| 1. | 86351 | 4.8% | 5.5%(-0.700)#178 | 8.3%(-3.50)#13,475 |
| 2. | 86336 | 2.1% | 5.5%(-3.40)#294 | 8.3%(-6.20)#22,132 |
1
Common Questions
What are the Top Zip Codes with the Highest Percentage of Households Without a Vehicle in Sedona, AZ?
Top Zip Codes with the Highest Percentage of Households Without a Vehicle in Sedona, AZ are:
What zip code has the Highest Percentage of Households Without a Vehicle in Sedona, AZ?
86351 has the Highest Percentage of Households Without a Vehicle in Sedona, AZ with 4.8%.
What is the Percentage of Households Without a Vehicle in Sedona, AZ?
Percentage of Households Without a Vehicle in Sedona is 2.3%.
What is the Percentage of Households Without a Vehicle in Arizona?
Percentage of Households Without a Vehicle in Arizona is 5.5%.
What is the Percentage of Households Without a Vehicle in the United States?
Percentage of Households Without a Vehicle in the United States is 8.3%.