Zip Codes with the Highest Percentage of Population Employed in Farming, Fishing & Forestry in San Tan Valley, AZ
RELATED REPORTS & OPTIONS
Farming, Fishing & Forestry
San Tan Valley
Compare Zip Codes
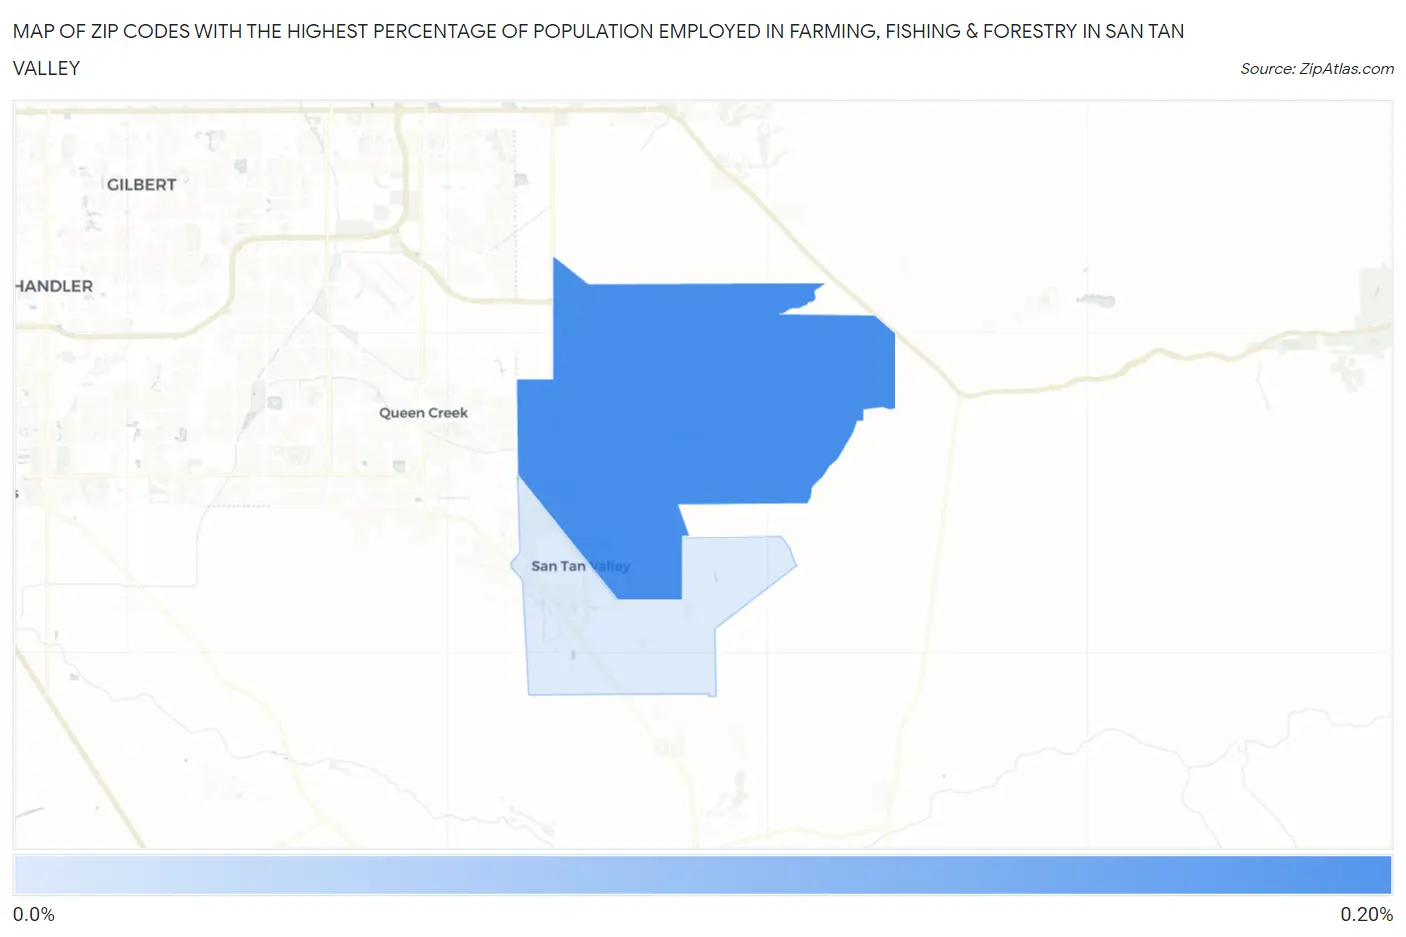
Map of Zip Codes with the Highest Percentage of Population Employed in Farming, Fishing & Forestry in San Tan Valley
0.0%
0.20%
Zip Codes with the Highest Percentage of Population Employed in Farming, Fishing & Forestry in San Tan Valley, AZ
| Zip Code | % Employed | vs State | vs National | |
| 1. | 85140 | 0.19% | 0.51%(-0.313)#160 | 0.61%(-0.411)#16,217 |
| 2. | 85143 | 0.078% | 0.51%(-0.429)#195 | 0.61%(-0.528)#18,162 |
1
Common Questions
What are the Top Zip Codes with the Highest Percentage of Population Employed in Farming, Fishing & Forestry in San Tan Valley, AZ?
Top Zip Codes with the Highest Percentage of Population Employed in Farming, Fishing & Forestry in San Tan Valley, AZ are:
What zip code has the Highest Percentage of Population Employed in Farming, Fishing & Forestry in San Tan Valley, AZ?
85140 has the Highest Percentage of Population Employed in Farming, Fishing & Forestry in San Tan Valley, AZ with 0.19%.
What is the Percentage of Population Employed in Farming, Fishing & Forestry in San Tan Valley, AZ?
Percentage of Population Employed in Farming, Fishing & Forestry in San Tan Valley is 0.25%.
What is the Percentage of Population Employed in Farming, Fishing & Forestry in Arizona?
Percentage of Population Employed in Farming, Fishing & Forestry in Arizona is 0.51%.
What is the Percentage of Population Employed in Farming, Fishing & Forestry in the United States?
Percentage of Population Employed in Farming, Fishing & Forestry in the United States is 0.61%.