Zip Codes with the Highest Percentage of Population Employed in Installation, Maintenance & Repair in San Tan Valley, AZ
RELATED REPORTS & OPTIONS
Installation, Maintenance & Repair
San Tan Valley
Compare Zip Codes
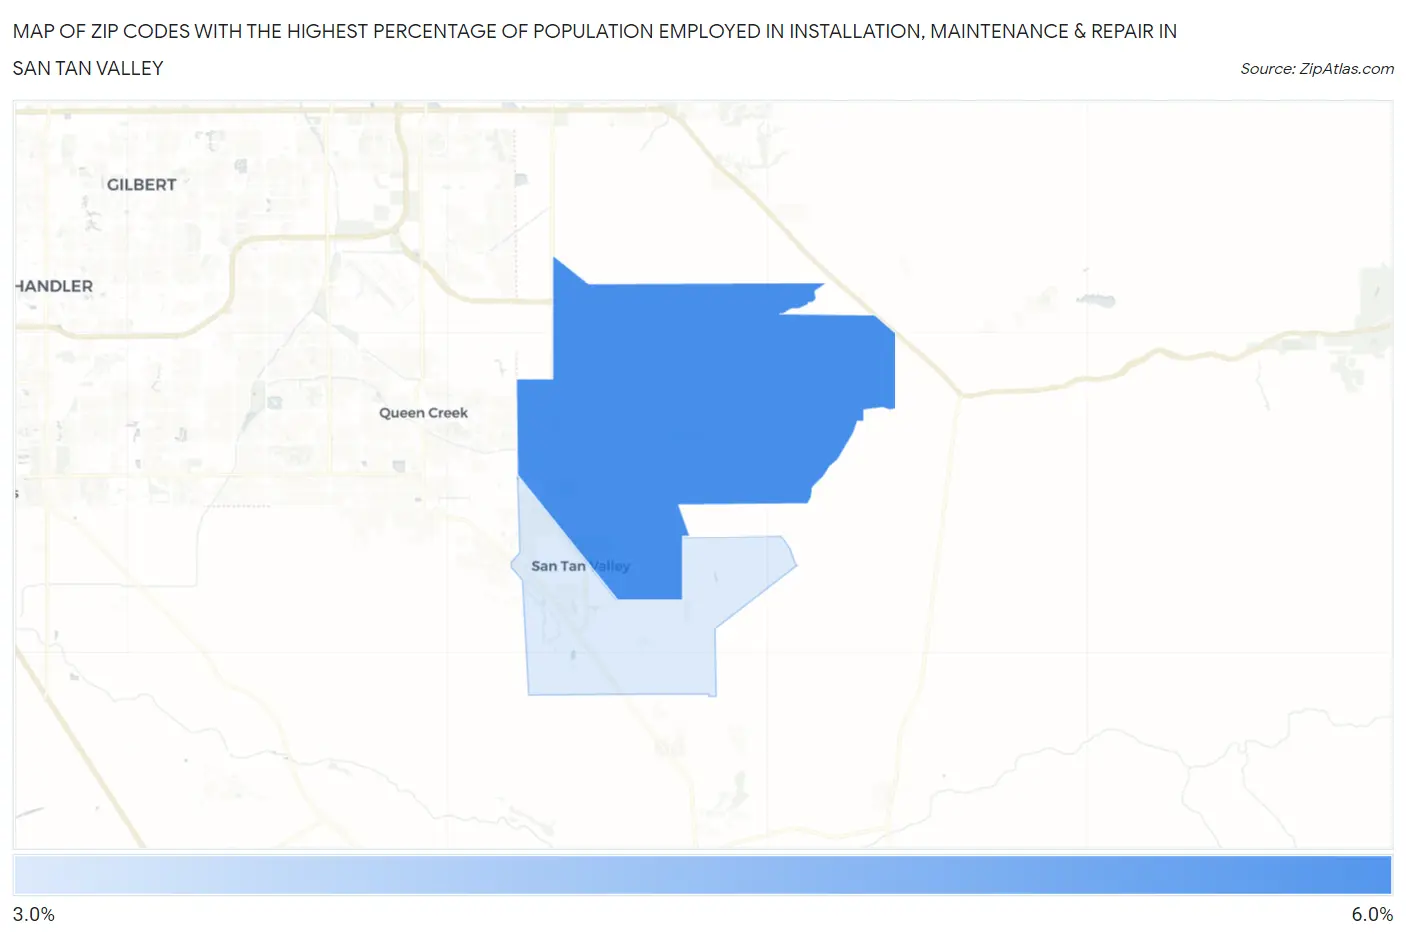
Map of Zip Codes with the Highest Percentage of Population Employed in Installation, Maintenance & Repair in San Tan Valley
0.0%
6.0%
Zip Codes with the Highest Percentage of Population Employed in Installation, Maintenance & Repair in San Tan Valley, AZ
| Zip Code | % Employed | vs State | vs National | |
| 1. | 85140 | 5.8% | 3.3%(+2.59)#46 | 3.1%(+2.78)#6,456 |
| 2. | 85143 | 3.7% | 3.3%(+0.395)#133 | 3.1%(+0.585)#13,912 |
1
Common Questions
What are the Top Zip Codes with the Highest Percentage of Population Employed in Installation, Maintenance & Repair in San Tan Valley, AZ?
Top Zip Codes with the Highest Percentage of Population Employed in Installation, Maintenance & Repair in San Tan Valley, AZ are:
What zip code has the Highest Percentage of Population Employed in Installation, Maintenance & Repair in San Tan Valley, AZ?
85140 has the Highest Percentage of Population Employed in Installation, Maintenance & Repair in San Tan Valley, AZ with 5.8%.
What is the Percentage of Population Employed in Installation, Maintenance & Repair in San Tan Valley, AZ?
Percentage of Population Employed in Installation, Maintenance & Repair in San Tan Valley is 5.0%.
What is the Percentage of Population Employed in Installation, Maintenance & Repair in Arizona?
Percentage of Population Employed in Installation, Maintenance & Repair in Arizona is 3.3%.
What is the Percentage of Population Employed in Installation, Maintenance & Repair in the United States?
Percentage of Population Employed in Installation, Maintenance & Repair in the United States is 3.1%.