Mountain Home, AR
Mountain Home Map
Mountain Home Overview
12,876
TOTAL POPULATION
6,253
MALE POPULATION
6,623
FEMALE POPULATION
94.41
MALES / 100 FEMALES
105.92
FEMALES / 100 MALES
41.8
MEDIAN AGE
3.0
AVG FAMILY SIZE
2.1
AVG HOUSEHOLD SIZE
$30,884
PER CAPITA INCOME
$59,720
AVG FAMILY INCOME
$42,281
AVG HOUSEHOLD INCOME
17.7%
WAGE / INCOME GAP [ % ]
82.3¢/ $1
WAGE / INCOME GAP [ $ ]
$8,655
FAMILY INCOME DEFICIT
0.48
INEQUALITY / GINI INDEX
5,300
LABOR FORCE [ PEOPLE ]
49.5%
PERCENT IN LABOR FORCE
6.6%
UNEMPLOYMENT RATE
Mountain Home Zip Codes
Mountain Home Area Codes
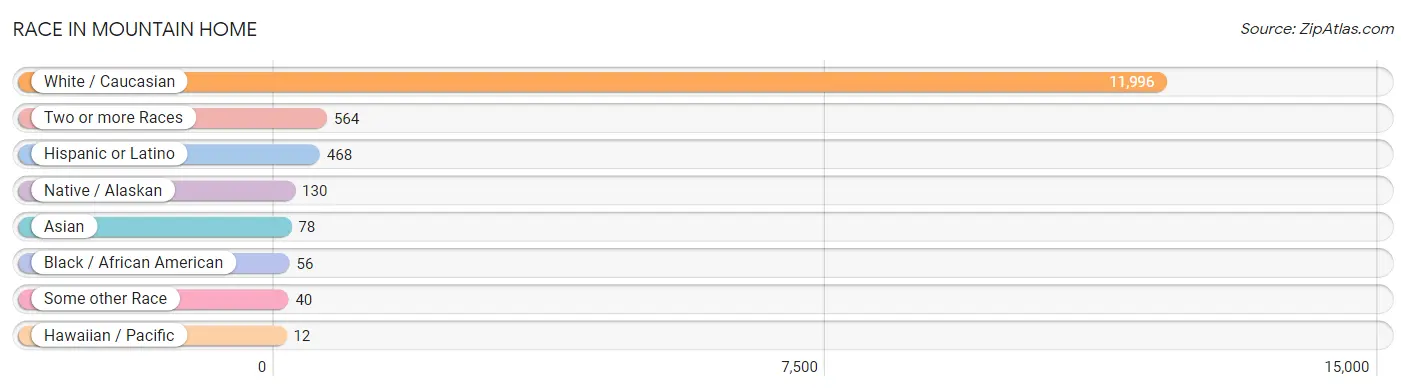
Race in Mountain Home
The most populous races in Mountain Home are White / Caucasian (11,996 | 93.2%), Two or more Races (564 | 4.4%), and Hispanic or Latino (468 | 3.6%).
| Race | # Population | % Population |
| Asian | 78 | 0.6% |
| Black / African American | 56 | 0.4% |
| Hawaiian / Pacific | 12 | 0.1% |
| Hispanic or Latino | 468 | 3.6% |
| Native / Alaskan | 130 | 1.0% |
| White / Caucasian | 11,996 | 93.2% |
| Two or more Races | 564 | 4.4% |
| Some other Race | 40 | 0.3% |
| Total | 12,876 | 100.0% |
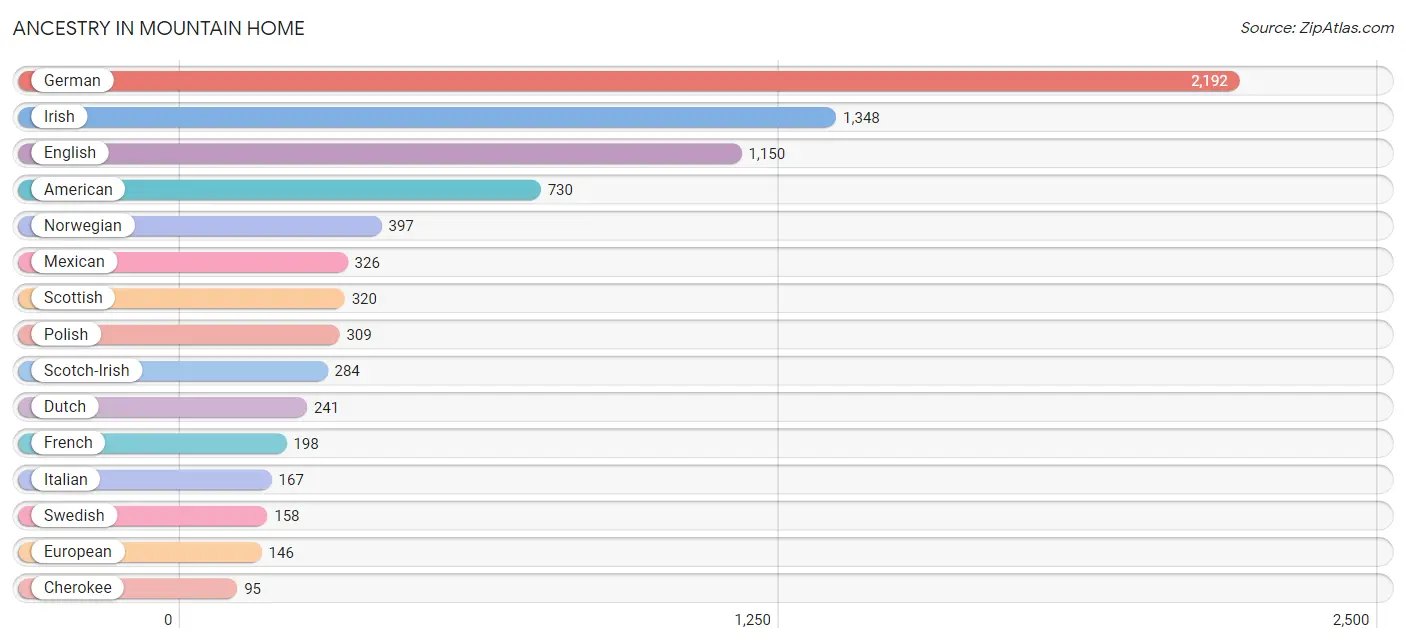
Ancestry in Mountain Home
The most populous ancestries reported in Mountain Home are German (2,192 | 17.0%), Irish (1,348 | 10.5%), English (1,150 | 8.9%), American (730 | 5.7%), and Norwegian (397 | 3.1%), together accounting for 45.2% of all Mountain Home residents.
| Ancestry | # Population | % Population |
| American | 730 | 5.7% |
| Austrian | 20 | 0.2% |
| Belgian | 34 | 0.3% |
| Brazilian | 39 | 0.3% |
| British | 7 | 0.1% |
| Central American | 44 | 0.3% |
| Cherokee | 95 | 0.7% |
| Choctaw | 54 | 0.4% |
| Comanche | 3 | 0.0% |
| Costa Rican | 38 | 0.3% |
| Croatian | 50 | 0.4% |
| Cuban | 28 | 0.2% |
| Czech | 86 | 0.7% |
| Czechoslovakian | 16 | 0.1% |
| Danish | 16 | 0.1% |
| Delaware | 10 | 0.1% |
| Dutch | 241 | 1.9% |
| Dutch West Indian | 17 | 0.1% |
| Eastern European | 12 | 0.1% |
| English | 1,150 | 8.9% |
| European | 146 | 1.1% |
| Fijian | 4 | 0.0% |
| Finnish | 14 | 0.1% |
| French | 198 | 1.5% |
| French Canadian | 43 | 0.3% |
| German | 2,192 | 17.0% |
| German Russian | 25 | 0.2% |
| Hungarian | 6 | 0.1% |
| Indian (Asian) | 24 | 0.2% |
| Irish | 1,348 | 10.5% |
| Italian | 167 | 1.3% |
| Korean | 1 | 0.0% |
| Lithuanian | 24 | 0.2% |
| Malaysian | 53 | 0.4% |
| Maltese | 28 | 0.2% |
| Mexican | 326 | 2.5% |
| Mexican American Indian | 49 | 0.4% |
| Navajo | 18 | 0.1% |
| Nicaraguan | 6 | 0.1% |
| Northern European | 25 | 0.2% |
| Norwegian | 397 | 3.1% |
| Polish | 309 | 2.4% |
| Puerto Rican | 69 | 0.5% |
| Russian | 11 | 0.1% |
| Samoan | 25 | 0.2% |
| Scandinavian | 16 | 0.1% |
| Scotch-Irish | 284 | 2.2% |
| Scottish | 320 | 2.5% |
| Sioux | 16 | 0.1% |
| Swedish | 158 | 1.2% |
| Swiss | 40 | 0.3% | View All 51 Rows |
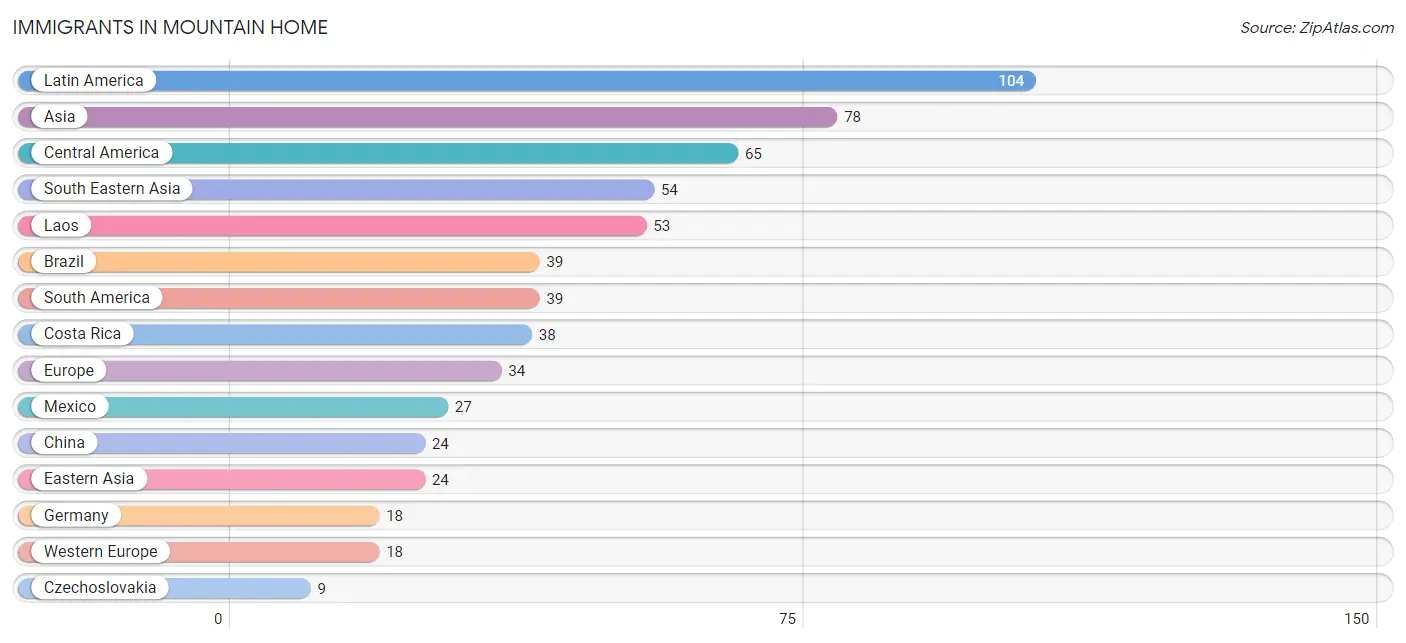
Immigrants in Mountain Home
The most numerous immigrant groups reported in Mountain Home came from Latin America (104 | 0.8%), Asia (78 | 0.6%), Central America (65 | 0.5%), South Eastern Asia (54 | 0.4%), and Laos (53 | 0.4%), together accounting for 2.8% of all Mountain Home residents.
| Immigration Origin | # Population | % Population |
| Asia | 78 | 0.6% |
| Brazil | 39 | 0.3% |
| Central America | 65 | 0.5% |
| China | 24 | 0.2% |
| Costa Rica | 38 | 0.3% |
| Czechoslovakia | 9 | 0.1% |
| Eastern Asia | 24 | 0.2% |
| Eastern Europe | 9 | 0.1% |
| Europe | 34 | 0.3% |
| Germany | 18 | 0.1% |
| Laos | 53 | 0.4% |
| Latin America | 104 | 0.8% |
| Mexico | 27 | 0.2% |
| Northern Europe | 7 | 0.1% |
| Oceania | 4 | 0.0% |
| Philippines | 1 | 0.0% |
| South America | 39 | 0.3% |
| South Eastern Asia | 54 | 0.4% |
| Western Europe | 18 | 0.1% | View All 19 Rows |
Sex and Age in Mountain Home
Sex and Age in Mountain Home
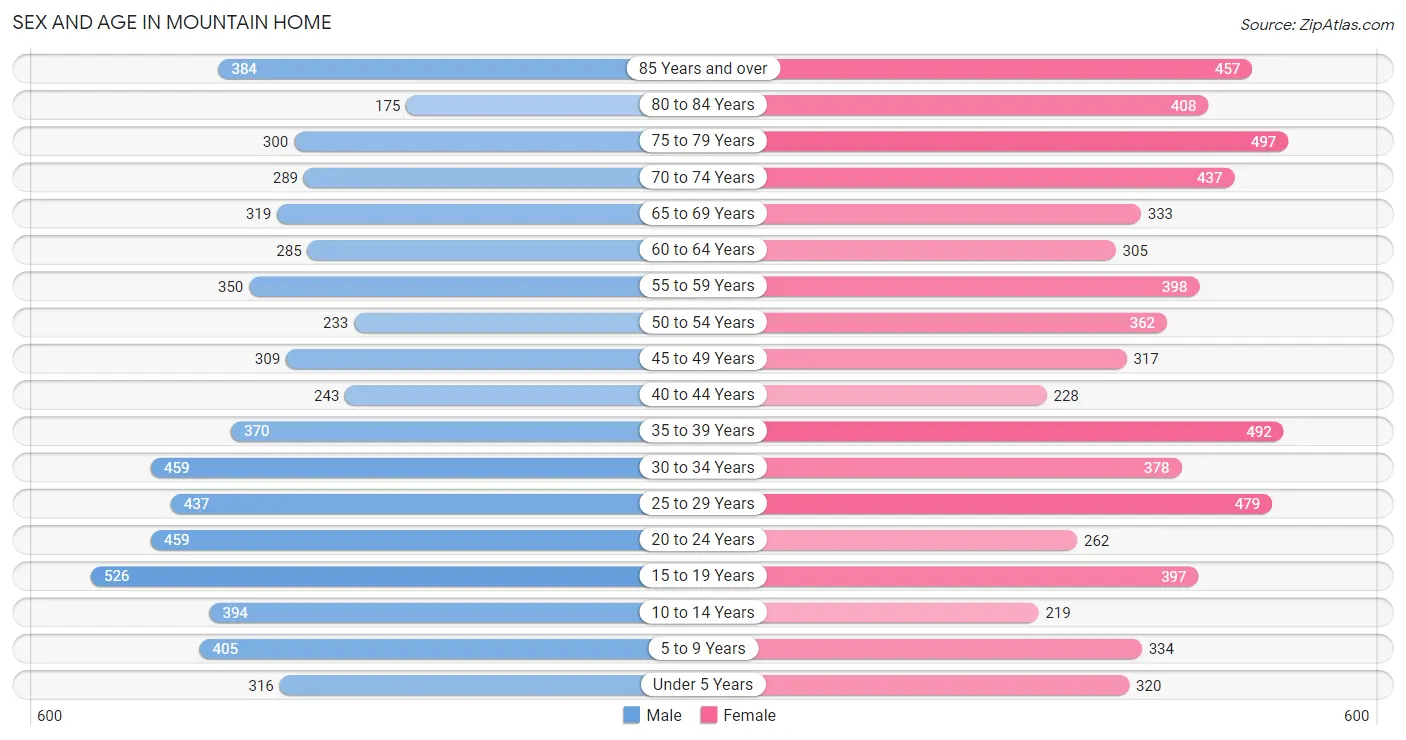
The most populous age groups in Mountain Home are 15 to 19 Years (526 | 8.4%) for men and 75 to 79 Years (497 | 7.5%) for women.
| Age Bracket | Male | Female |
| Under 5 Years | 316 (5.1%) | 320 (4.8%) |
| 5 to 9 Years | 405 (6.5%) | 334 (5.0%) |
| 10 to 14 Years | 394 (6.3%) | 219 (3.3%) |
| 15 to 19 Years | 526 (8.4%) | 397 (6.0%) |
| 20 to 24 Years | 459 (7.3%) | 262 (4.0%) |
| 25 to 29 Years | 437 (7.0%) | 479 (7.2%) |
| 30 to 34 Years | 459 (7.3%) | 378 (5.7%) |
| 35 to 39 Years | 370 (5.9%) | 492 (7.4%) |
| 40 to 44 Years | 243 (3.9%) | 228 (3.4%) |
| 45 to 49 Years | 309 (4.9%) | 317 (4.8%) |
| 50 to 54 Years | 233 (3.7%) | 362 (5.5%) |
| 55 to 59 Years | 350 (5.6%) | 398 (6.0%) |
| 60 to 64 Years | 285 (4.6%) | 305 (4.6%) |
| 65 to 69 Years | 319 (5.1%) | 333 (5.0%) |
| 70 to 74 Years | 289 (4.6%) | 437 (6.6%) |
| 75 to 79 Years | 300 (4.8%) | 497 (7.5%) |
| 80 to 84 Years | 175 (2.8%) | 408 (6.2%) |
| 85 Years and over | 384 (6.1%) | 457 (6.9%) |
| Total | 6,253 (100.0%) | 6,623 (100.0%) |
Families and Households in Mountain Home
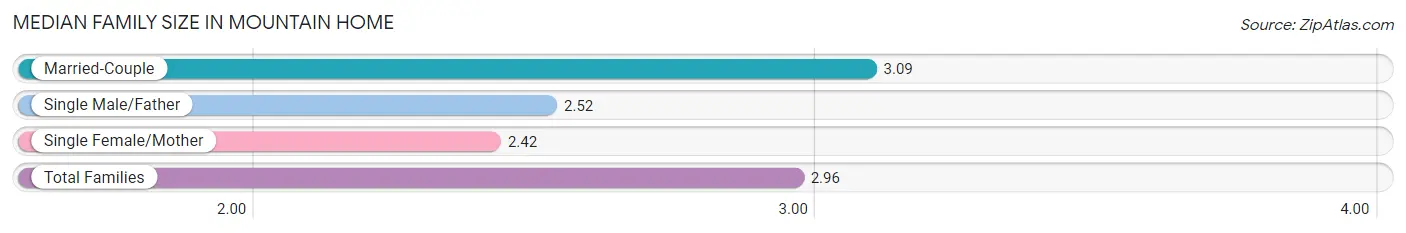
Median Family Size in Mountain Home
The median family size in Mountain Home is 2.96 persons per family, with married-couple families (2,328 | 80.3%) accounting for the largest median family size of 3.09 persons per family. On the other hand, single female/mother families (452 | 15.6%) represent the smallest median family size with 2.42 persons per family.
| Family Type | # Families | Family Size |
| Married-Couple | 2,328 (80.3%) | 3.09 |
| Single Male/Father | 120 (4.1%) | 2.52 |
| Single Female/Mother | 452 (15.6%) | 2.42 |
| Total Families | 2,900 (100.0%) | 2.96 |
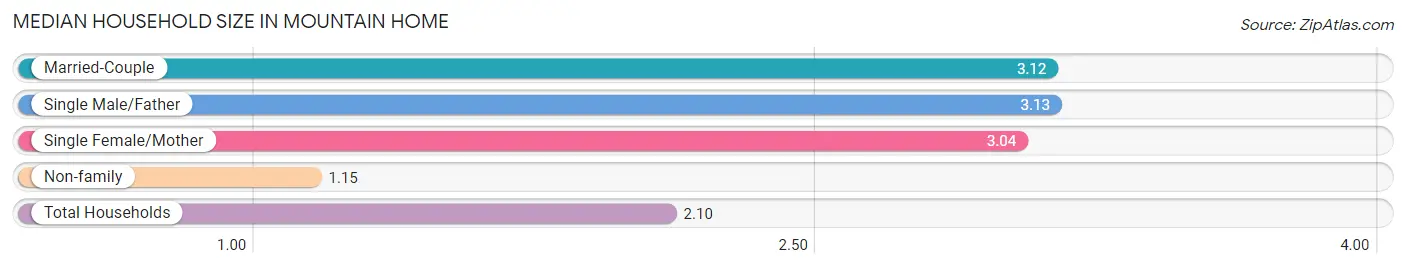
Median Household Size in Mountain Home
The median household size in Mountain Home is 2.10 persons per household, with single male/father households (120 | 2.0%) accounting for the largest median household size of 3.13 persons per household. non-family households (3,079 | 51.5%) represent the smallest median household size with 1.15 persons per household.
| Household Type | # Households | Household Size |
| Married-Couple | 2,328 (38.9%) | 3.12 |
| Single Male/Father | 120 (2.0%) | 3.13 |
| Single Female/Mother | 452 (7.6%) | 3.04 |
| Non-family | 3,079 (51.5%) | 1.15 |
| Total Households | 5,979 (100.0%) | 2.10 |
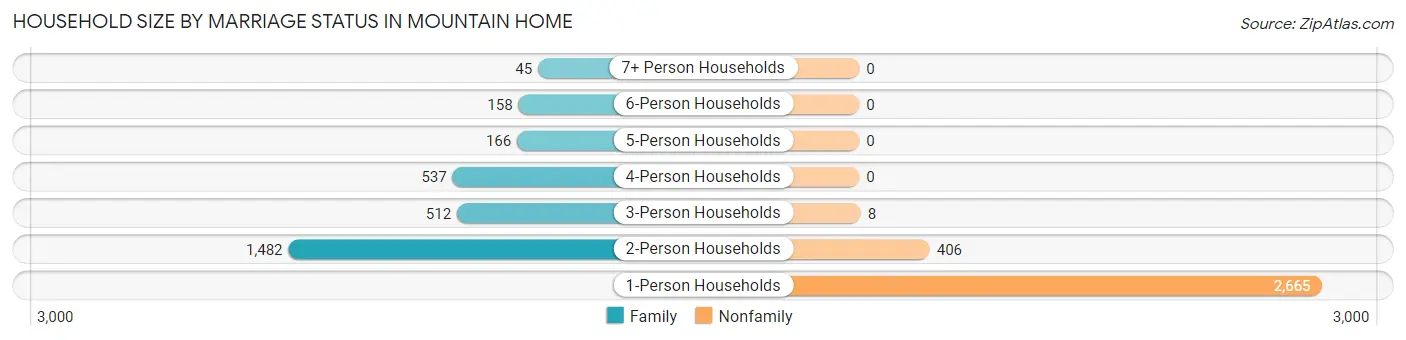
Household Size by Marriage Status in Mountain Home
Out of a total of 5,979 households in Mountain Home, 2,900 (48.5%) are family households, while 3,079 (51.5%) are nonfamily households. The most numerous type of family households are 2-person households, comprising 1,482, and the most common type of nonfamily households are 1-person households, comprising 2,665.
| Household Size | Family Households | Nonfamily Households |
| 1-Person Households | - | 2,665 (44.6%) |
| 2-Person Households | 1,482 (24.8%) | 406 (6.8%) |
| 3-Person Households | 512 (8.6%) | 8 (0.1%) |
| 4-Person Households | 537 (9.0%) | 0 (0.0%) |
| 5-Person Households | 166 (2.8%) | 0 (0.0%) |
| 6-Person Households | 158 (2.6%) | 0 (0.0%) |
| 7+ Person Households | 45 (0.7%) | 0 (0.0%) |
| Total | 2,900 (48.5%) | 3,079 (51.5%) |
Female Fertility in Mountain Home
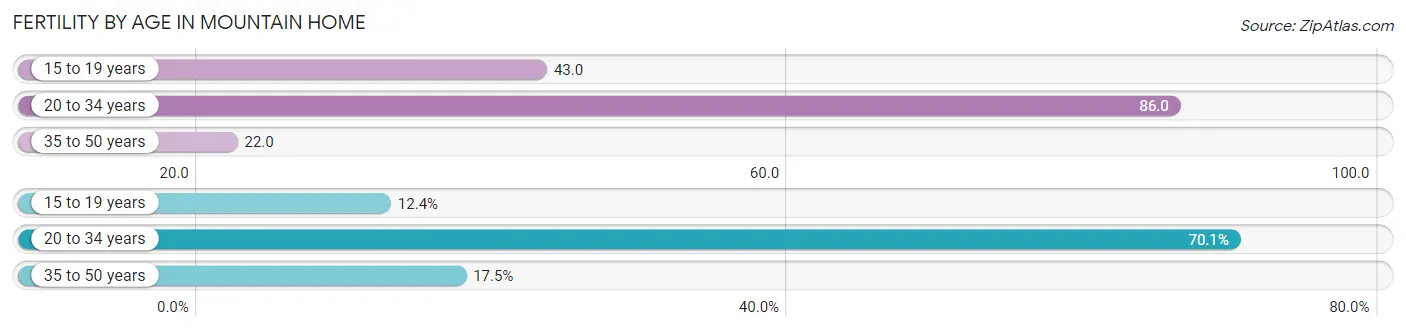
Fertility by Age in Mountain Home
Average fertility rate in Mountain Home is 53.0 births per 1,000 women. Women in the age bracket of 20 to 34 years have the highest fertility rate with 86.0 births per 1,000 women. Women in the age bracket of 20 to 34 years acount for 70.1% of all women with births.
| Age Bracket | Women with Births | Births / 1,000 Women |
| 15 to 19 years | 17 (12.4%) | 43.0 |
| 20 to 34 years | 96 (70.1%) | 86.0 |
| 35 to 50 years | 24 (17.5%) | 22.0 |
| Total | 137 (100.0%) | 53.0 |
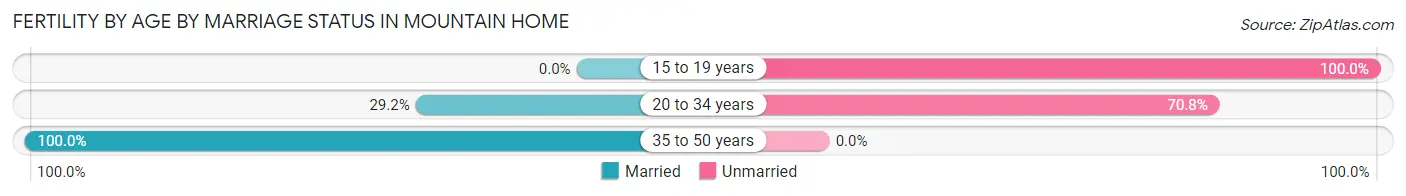
Fertility by Age by Marriage Status in Mountain Home
38.0% of women with births (137) in Mountain Home are married. The highest percentage of unmarried women with births falls into 15 to 19 years age bracket with 100.0% of them unmarried at the time of birth, while the lowest percentage of unmarried women with births belong to 35 to 50 years age bracket with 0.0% of them unmarried.
| Age Bracket | Married | Unmarried |
| 15 to 19 years | 0 (0.0%) | 17 (100.0%) |
| 20 to 34 years | 28 (29.2%) | 68 (70.8%) |
| 35 to 50 years | 24 (100.0%) | 0 (0.0%) |
| Total | 52 (38.0%) | 85 (62.0%) |
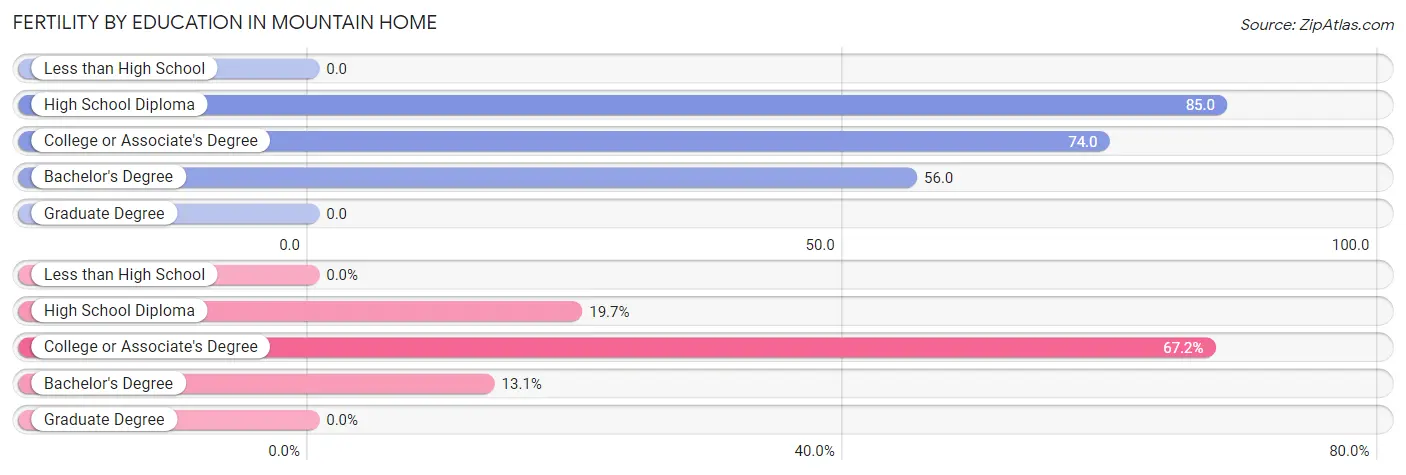
Fertility by Education in Mountain Home
| Educational Attainment | Women with Births | Births / 1,000 Women |
| Less than High School | 0 (0.0%) | 0.0 |
| High School Diploma | 27 (19.7%) | 85.0 |
| College or Associate's Degree | 92 (67.1%) | 74.0 |
| Bachelor's Degree | 18 (13.1%) | 56.0 |
| Graduate Degree | 0 (0.0%) | 0.0 |
| Total | 137 (100.0%) | 53.0 |
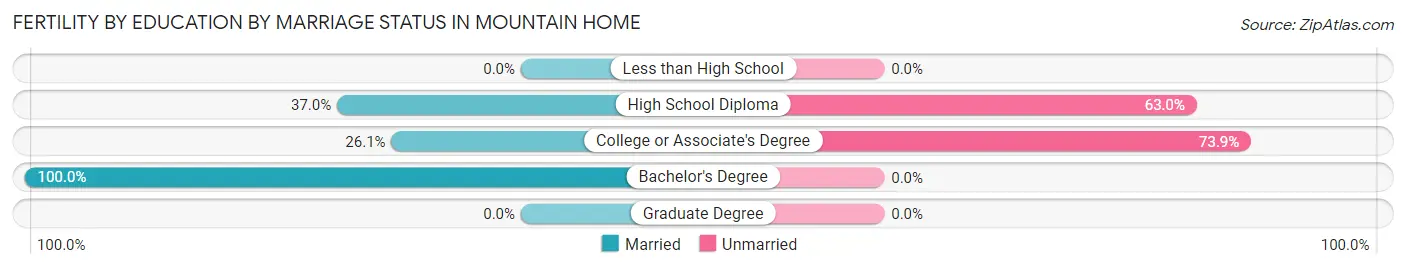
Fertility by Education by Marriage Status in Mountain Home
62.0% of women with births in Mountain Home are unmarried. Women with the educational attainment of bachelor's degree are most likely to be married with 100.0% of them married at childbirth, while women with the educational attainment of college or associate's degree are least likely to be married with 73.9% of them unmarried at childbirth.
| Educational Attainment | Married | Unmarried |
| Less than High School | 0 (0.0%) | 0 (0.0%) |
| High School Diploma | 10 (37.0%) | 17 (63.0%) |
| College or Associate's Degree | 24 (26.1%) | 68 (73.9%) |
| Bachelor's Degree | 18 (100.0%) | 0 (0.0%) |
| Graduate Degree | 0 (0.0%) | 0 (0.0%) |
| Total | 52 (38.0%) | 85 (62.0%) |
Income in Mountain Home
Income Overview in Mountain Home
Per Capita Income in Mountain Home is $30,884, while median incomes of families and households are $59,720 and $42,281 respectively.
| Characteristic | Number | Measure |
| Per Capita Income | 12,876 | $30,884 |
| Median Family Income | 2,900 | $59,720 |
| Mean Family Income | 2,900 | $84,616 |
| Median Household Income | 5,979 | $42,281 |
| Mean Household Income | 5,979 | $65,086 |
| Income Deficit | 2,900 | $8,655 |
| Wage / Income Gap (%) | 12,876 | 17.67% |
| Wage / Income Gap ($) | 12,876 | 82.33¢ per $1 |
| Gini / Inequality Index | 12,876 | 0.48 |
Earnings by Sex in Mountain Home
Average Earnings in Mountain Home are $30,267, $32,337 for men and $26,622 for women, a difference of 17.7%.
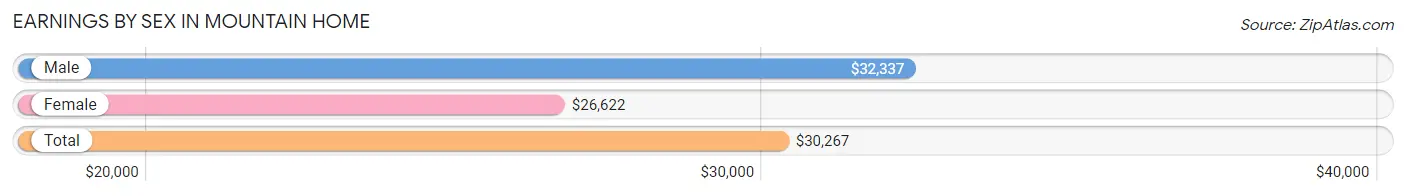
| Sex | Number | Average Earnings |
| Male | 2,935 (54.3%) | $32,337 |
| Female | 2,468 (45.7%) | $26,622 |
| Total | 5,403 (100.0%) | $30,267 |
Earnings by Sex by Income Bracket in Mountain Home
The most common earnings brackets in Mountain Home are $40,000 to $44,999 for men (382 | 13.0%) and $25,000 to $29,999 for women (337 | 13.7%).
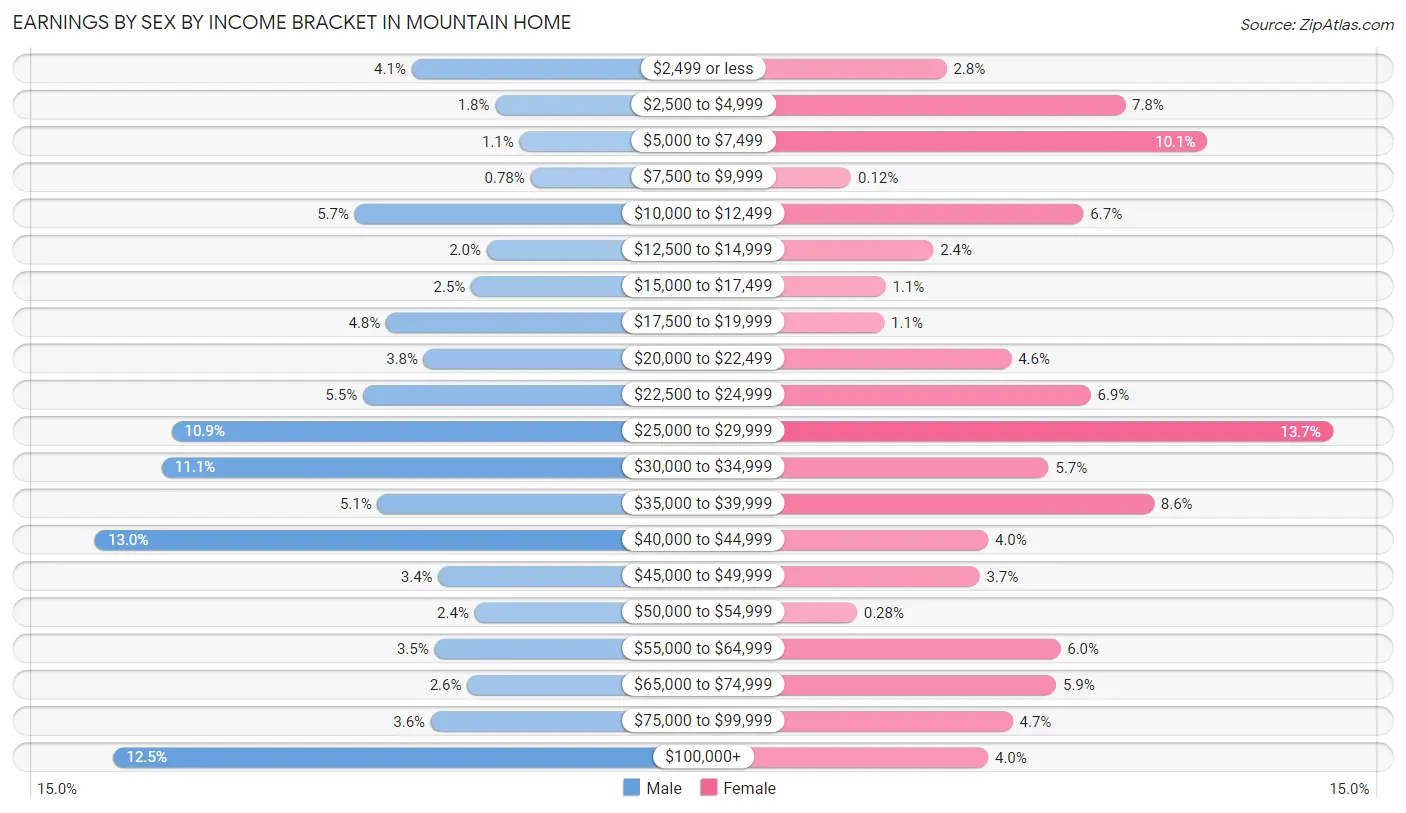
| Income | Male | Female |
| $2,499 or less | 121 (4.1%) | 69 (2.8%) |
| $2,500 to $4,999 | 52 (1.8%) | 193 (7.8%) |
| $5,000 to $7,499 | 32 (1.1%) | 250 (10.1%) |
| $7,500 to $9,999 | 23 (0.8%) | 3 (0.1%) |
| $10,000 to $12,499 | 168 (5.7%) | 164 (6.7%) |
| $12,500 to $14,999 | 59 (2.0%) | 60 (2.4%) |
| $15,000 to $17,499 | 72 (2.5%) | 27 (1.1%) |
| $17,500 to $19,999 | 142 (4.8%) | 26 (1.1%) |
| $20,000 to $22,499 | 111 (3.8%) | 114 (4.6%) |
| $22,500 to $24,999 | 161 (5.5%) | 169 (6.9%) |
| $25,000 to $29,999 | 319 (10.9%) | 337 (13.7%) |
| $30,000 to $34,999 | 327 (11.1%) | 140 (5.7%) |
| $35,000 to $39,999 | 149 (5.1%) | 213 (8.6%) |
| $40,000 to $44,999 | 382 (13.0%) | 98 (4.0%) |
| $45,000 to $49,999 | 99 (3.4%) | 92 (3.7%) |
| $50,000 to $54,999 | 69 (2.4%) | 7 (0.3%) |
| $55,000 to $64,999 | 102 (3.5%) | 148 (6.0%) |
| $65,000 to $74,999 | 75 (2.6%) | 145 (5.9%) |
| $75,000 to $99,999 | 105 (3.6%) | 115 (4.7%) |
| $100,000+ | 367 (12.5%) | 98 (4.0%) |
| Total | 2,935 (100.0%) | 2,468 (100.0%) |
Earnings by Sex by Educational Attainment in Mountain Home
Average earnings in Mountain Home are $38,032 for men and $27,813 for women, a difference of 26.9%. Men with an educational attainment of bachelor's degree enjoy the highest average annual earnings of $68,750, while those with high school diploma education earn the least with $23,843. Women with an educational attainment of graduate degree earn the most with the average annual earnings of $49,458, while those with less than high school education have the smallest earnings of $4,193.
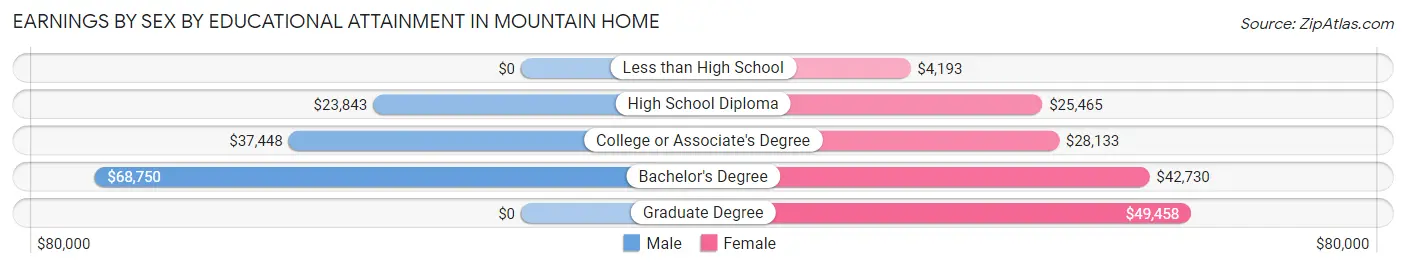
| Educational Attainment | Male Income | Female Income |
| Less than High School | - | - |
| High School Diploma | $23,843 | $25,465 |
| College or Associate's Degree | $37,448 | $28,133 |
| Bachelor's Degree | $68,750 | $42,730 |
| Graduate Degree | - | - |
| Total | $38,032 | $27,813 |
Family Income in Mountain Home
Family Income Brackets in Mountain Home
According to the Mountain Home family income data, there are 609 families falling into the $50,000 to $74,999 income range, which is the most common income bracket and makes up 21.0% of all families. Conversely, the $10,000 to $14,999 income bracket is the least frequent group with only 29 families (1.0%) belonging to this category.
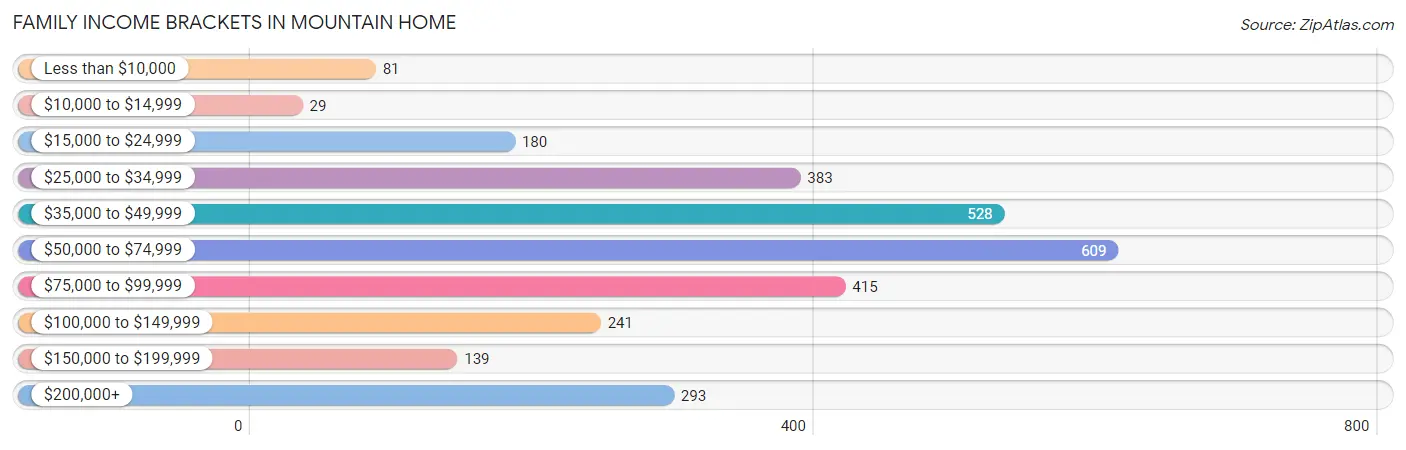
| Income Bracket | # Families | % Families |
| Less than $10,000 | 81 | 2.8% |
| $10,000 to $14,999 | 29 | 1.0% |
| $15,000 to $24,999 | 180 | 6.2% |
| $25,000 to $34,999 | 383 | 13.2% |
| $35,000 to $49,999 | 528 | 18.2% |
| $50,000 to $74,999 | 609 | 21.0% |
| $75,000 to $99,999 | 415 | 14.3% |
| $100,000 to $149,999 | 241 | 8.3% |
| $150,000 to $199,999 | 139 | 4.8% |
| $200,000+ | 293 | 10.1% |
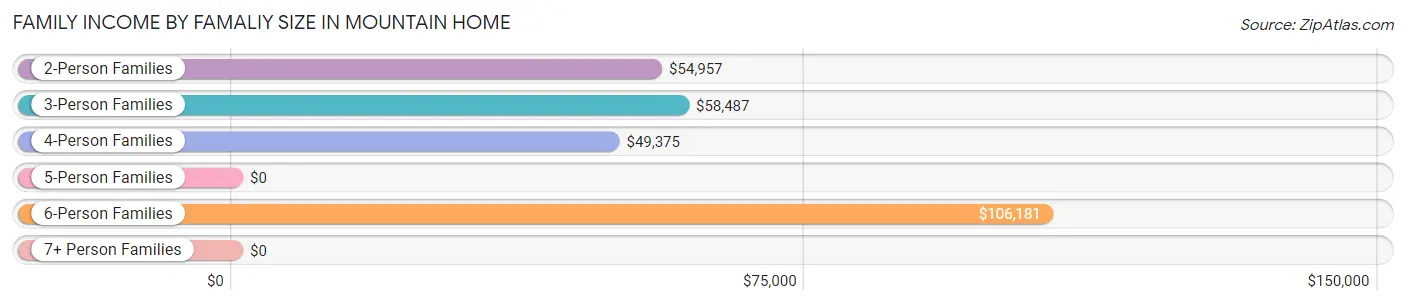
Family Income by Famaliy Size in Mountain Home
6-person families (47 | 1.6%) account for the highest median family income in Mountain Home with $106,181 per family, while 2-person families (1,658 | 57.2%) have the highest median income of $27,478 per family member.
| Income Bracket | # Families | Median Income |
| 2-Person Families | 1,658 (57.2%) | $54,957 |
| 3-Person Families | 439 (15.1%) | $58,487 |
| 4-Person Families | 474 (16.3%) | $49,375 |
| 5-Person Families | 237 (8.2%) | $0 |
| 6-Person Families | 47 (1.6%) | $106,181 |
| 7+ Person Families | 45 (1.5%) | $0 |
| Total | 2,900 (100.0%) | $59,720 |
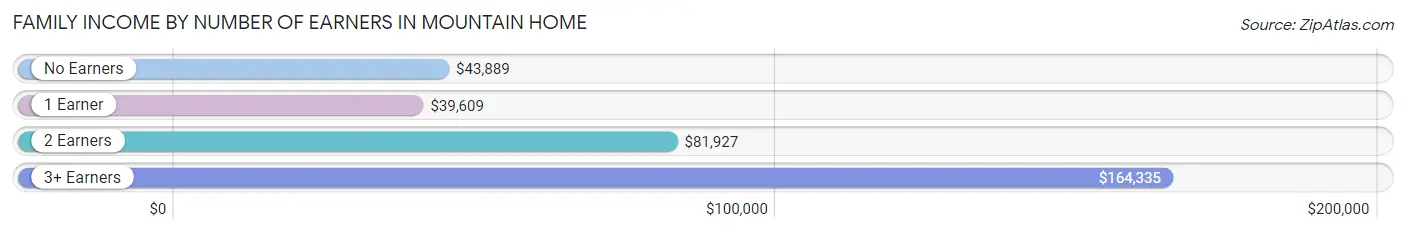
Family Income by Number of Earners in Mountain Home
The median family income in Mountain Home is $59,720, with families comprising 3+ earners (285) having the highest median family income of $164,335, while families with 1 earner (840) have the lowest median family income of $39,609, accounting for 9.8% and 29.0% of families, respectively.
| Number of Earners | # Families | Median Income |
| No Earners | 944 (32.6%) | $43,889 |
| 1 Earner | 840 (29.0%) | $39,609 |
| 2 Earners | 831 (28.7%) | $81,927 |
| 3+ Earners | 285 (9.8%) | $164,335 |
| Total | 2,900 (100.0%) | $59,720 |
Household Income in Mountain Home
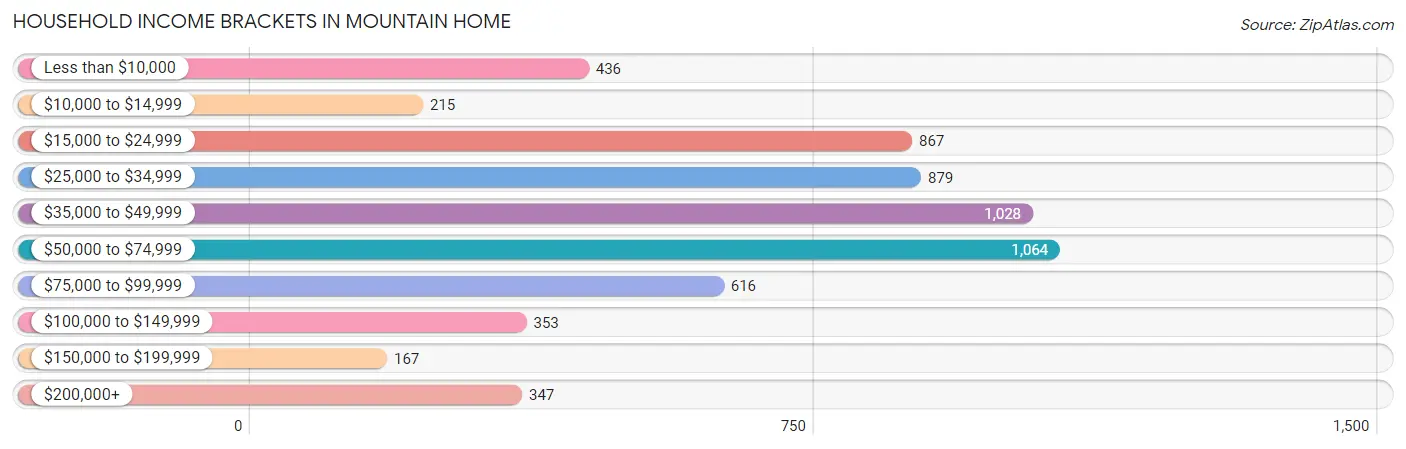
Household Income Brackets in Mountain Home
With 1,064 households falling in the category, the $50,000 to $74,999 income range is the most frequent in Mountain Home, accounting for 17.8% of all households. In contrast, only 167 households (2.8%) fall into the $150,000 to $199,999 income bracket, making it the least populous group.
| Income Bracket | # Households | % Households |
| Less than $10,000 | 436 | 7.3% |
| $10,000 to $14,999 | 215 | 3.6% |
| $15,000 to $24,999 | 867 | 14.5% |
| $25,000 to $34,999 | 879 | 14.7% |
| $35,000 to $49,999 | 1,028 | 17.2% |
| $50,000 to $74,999 | 1,064 | 17.8% |
| $75,000 to $99,999 | 616 | 10.3% |
| $100,000 to $149,999 | 353 | 5.9% |
| $150,000 to $199,999 | 167 | 2.8% |
| $200,000+ | 347 | 5.8% |
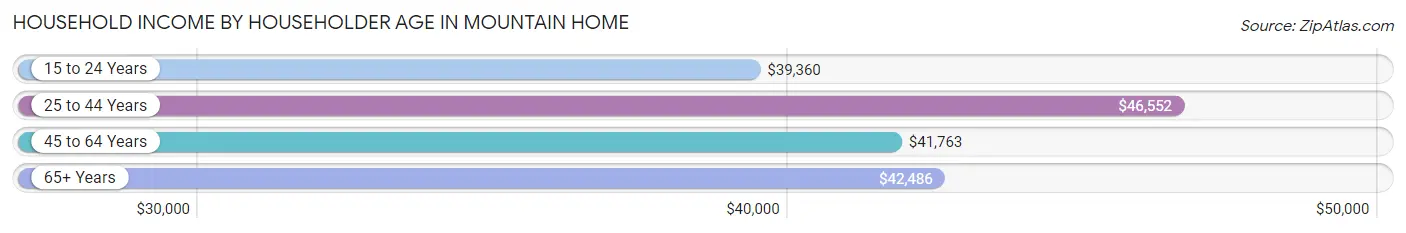
Household Income by Householder Age in Mountain Home
The median household income in Mountain Home is $42,281, with the highest median household income of $46,552 found in the 25 to 44 years age bracket for the primary householder. A total of 1,565 households (26.2%) fall into this category. Meanwhile, the 15 to 24 years age bracket for the primary householder has the lowest median household income of $39,360, with 352 households (5.9%) in this group.
| Income Bracket | # Households | Median Income |
| 15 to 24 Years | 352 (5.9%) | $39,360 |
| 25 to 44 Years | 1,565 (26.2%) | $46,552 |
| 45 to 64 Years | 1,609 (26.9%) | $41,763 |
| 65+ Years | 2,453 (41.0%) | $42,486 |
| Total | 5,979 (100.0%) | $42,281 |
Poverty in Mountain Home
Income Below Poverty by Sex and Age in Mountain Home
With 12.3% poverty level for males and 17.8% for females among the residents of Mountain Home, 6 to 11 year old males and 5 year old females are the most vulnerable to poverty, with 130 males (32.8%) and 37 females (66.1%) in their respective age groups living below the poverty level.
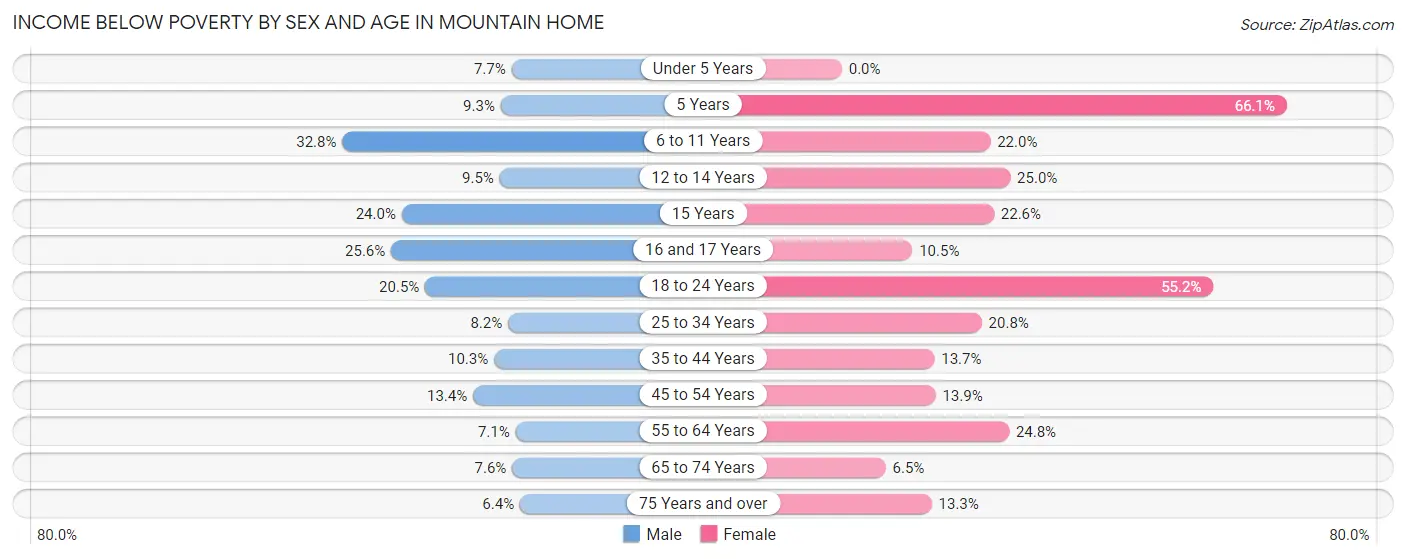
| Age Bracket | Male | Female |
| Under 5 Years | 22 (7.7%) | 0 (0.0%) |
| 5 Years | 8 (9.3%) | 37 (66.1%) |
| 6 to 11 Years | 130 (32.8%) | 69 (22.0%) |
| 12 to 14 Years | 30 (9.5%) | 26 (25.0%) |
| 15 Years | 36 (24.0%) | 7 (22.6%) |
| 16 and 17 Years | 44 (25.6%) | 25 (10.5%) |
| 18 to 24 Years | 135 (20.5%) | 214 (55.1%) |
| 25 to 34 Years | 73 (8.2%) | 177 (20.8%) |
| 35 to 44 Years | 61 (10.3%) | 98 (13.7%) |
| 45 to 54 Years | 70 (13.4%) | 94 (13.9%) |
| 55 to 64 Years | 44 (7.1%) | 173 (24.8%) |
| 65 to 74 Years | 44 (7.6%) | 49 (6.5%) |
| 75 Years and over | 54 (6.4%) | 165 (13.3%) |
| Total | 751 (12.3%) | 1,134 (17.8%) |
Income Above Poverty by Sex and Age in Mountain Home
According to the poverty statistics in Mountain Home, males aged 75 years and over and females aged under 5 years are the age groups that are most secure financially, with 93.6% of males and 100.0% of females in these age groups living above the poverty line.
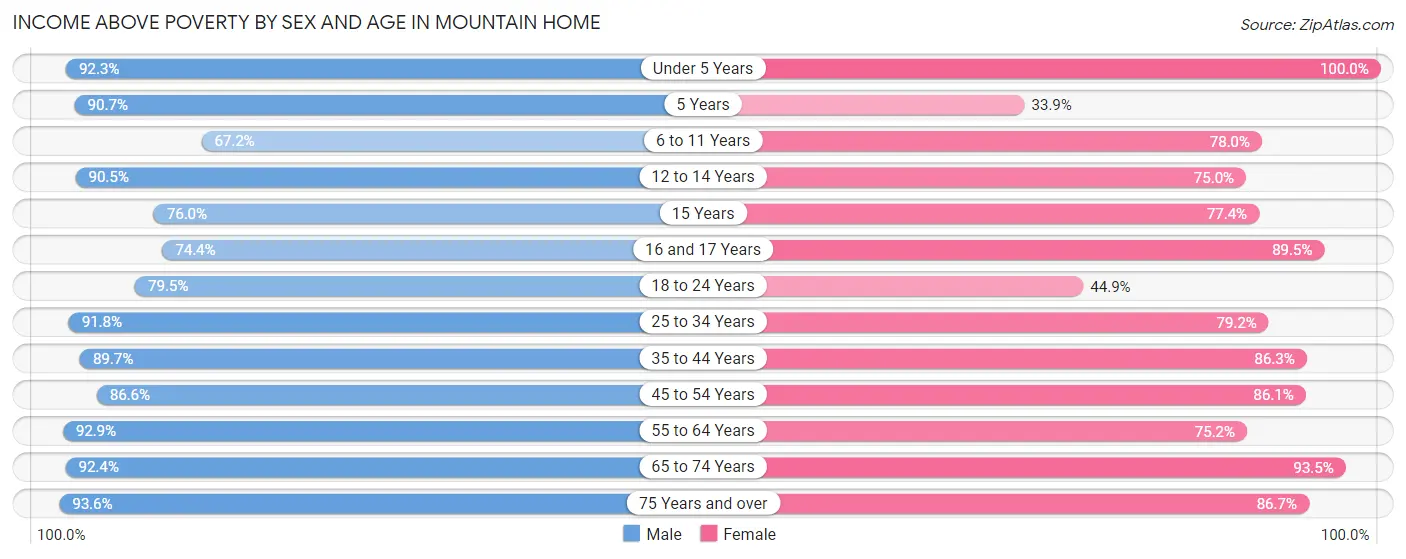
| Age Bracket | Male | Female |
| Under 5 Years | 264 (92.3%) | 320 (100.0%) |
| 5 Years | 78 (90.7%) | 19 (33.9%) |
| 6 to 11 Years | 266 (67.2%) | 244 (78.0%) |
| 12 to 14 Years | 287 (90.5%) | 78 (75.0%) |
| 15 Years | 114 (76.0%) | 24 (77.4%) |
| 16 and 17 Years | 128 (74.4%) | 214 (89.5%) |
| 18 to 24 Years | 523 (79.5%) | 174 (44.9%) |
| 25 to 34 Years | 816 (91.8%) | 675 (79.2%) |
| 35 to 44 Years | 532 (89.7%) | 616 (86.3%) |
| 45 to 54 Years | 452 (86.6%) | 582 (86.1%) |
| 55 to 64 Years | 576 (92.9%) | 524 (75.2%) |
| 65 to 74 Years | 535 (92.4%) | 705 (93.5%) |
| 75 Years and over | 784 (93.6%) | 1,072 (86.7%) |
| Total | 5,355 (87.7%) | 5,247 (82.2%) |
Income Below Poverty Among Married-Couple Families in Mountain Home
The poverty statistics for married-couple families in Mountain Home show that 7.5% or 175 of the total 2,328 families live below the poverty line. Families with 1 or 2 children have the highest poverty rate of 12.1%, comprising of 86 families. On the other hand, families with 5 or more children have the lowest poverty rate of 0.0%, which includes 0 families.
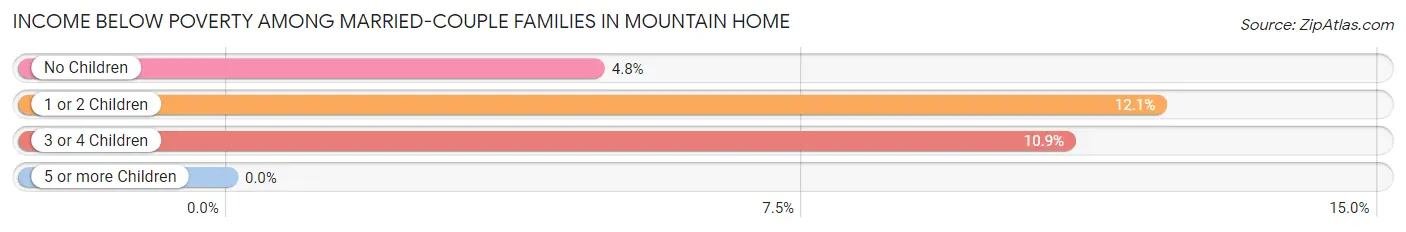
| Children | Above Poverty | Below Poverty |
| No Children | 1,351 (95.2%) | 68 (4.8%) |
| 1 or 2 Children | 623 (87.9%) | 86 (12.1%) |
| 3 or 4 Children | 171 (89.1%) | 21 (10.9%) |
| 5 or more Children | 8 (100.0%) | 0 (0.0%) |
| Total | 2,153 (92.5%) | 175 (7.5%) |
Income Below Poverty Among Single-Parent Households in Mountain Home
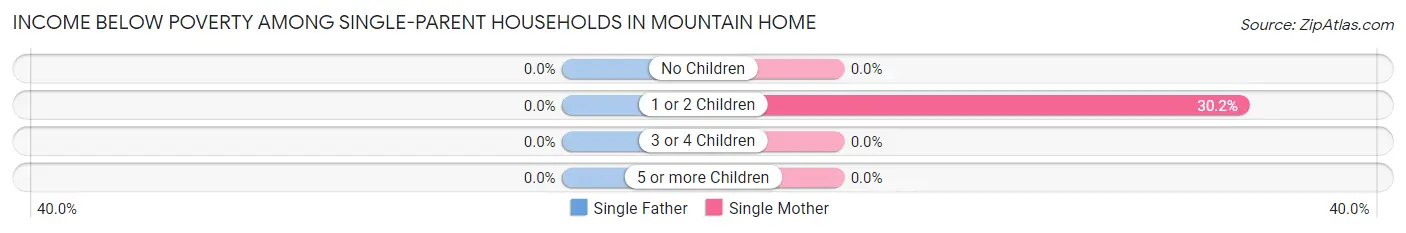
| Children | Single Father | Single Mother |
| No Children | 0 (0.0%) | 0 (0.0%) |
| 1 or 2 Children | 0 (0.0%) | 75 (30.2%) |
| 3 or 4 Children | 0 (0.0%) | 0 (0.0%) |
| 5 or more Children | 0 (0.0%) | 0 (0.0%) |
| Total | 0 (0.0%) | 75 (16.6%) |
Income Below Poverty Among Married-Couple vs Single-Parent Households in Mountain Home
The poverty data for Mountain Home shows that 175 of the married-couple family households (7.5%) and 75 of the single-parent households (13.1%) are living below the poverty level. Within the married-couple family households, those with 1 or 2 children have the highest poverty rate, with 86 households (12.1%) falling below the poverty line. Among the single-parent households, those with 1 or 2 children have the highest poverty rate, with 75 household (23.3%) living below poverty.
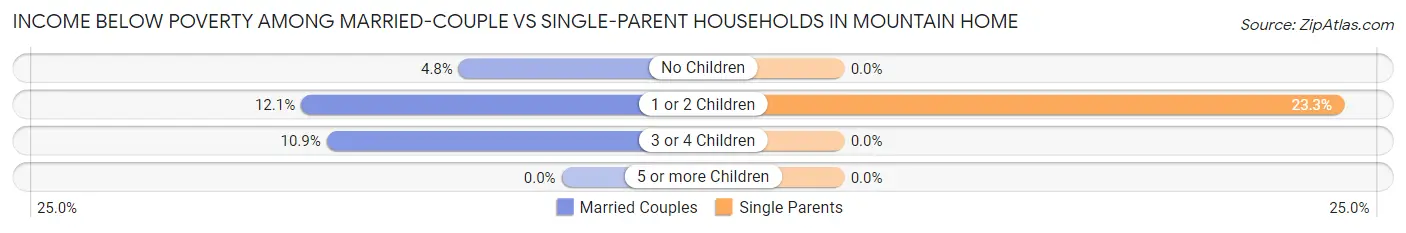
| Children | Married-Couple Families | Single-Parent Households |
| No Children | 68 (4.8%) | 0 (0.0%) |
| 1 or 2 Children | 86 (12.1%) | 75 (23.3%) |
| 3 or 4 Children | 21 (10.9%) | 0 (0.0%) |
| 5 or more Children | 0 (0.0%) | 0 (0.0%) |
| Total | 175 (7.5%) | 75 (13.1%) |
Employment Characteristics in Mountain Home
Employment by Class of Employer in Mountain Home
Among the 4,894 employed individuals in Mountain Home, private company employees (3,610 | 73.8%), not-for-profit organizations (584 | 11.9%), and local government employees (232 | 4.7%) make up the most common classes of employment.
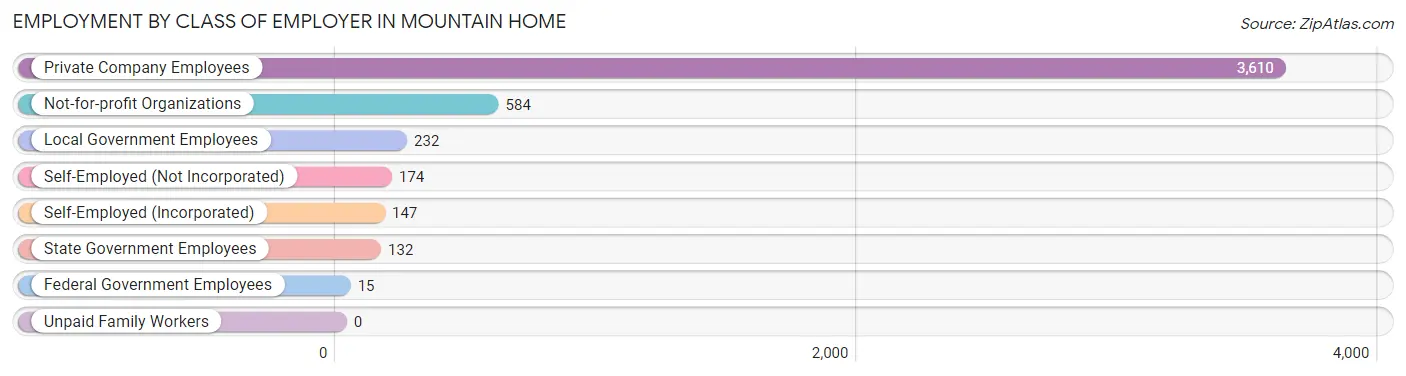
| Employer Class | # Employees | % Employees |
| Private Company Employees | 3,610 | 73.8% |
| Self-Employed (Incorporated) | 147 | 3.0% |
| Self-Employed (Not Incorporated) | 174 | 3.6% |
| Not-for-profit Organizations | 584 | 11.9% |
| Local Government Employees | 232 | 4.7% |
| State Government Employees | 132 | 2.7% |
| Federal Government Employees | 15 | 0.3% |
| Unpaid Family Workers | 0 | 0.0% |
| Total | 4,894 | 100.0% |
Employment Status by Age in Mountain Home
According to the labor force statistics for Mountain Home, out of the total population over 16 years of age (10,707), 49.5% or 5,300 individuals are in the labor force, with 6.6% or 350 of them unemployed. The age group with the highest labor force participation rate is 30 to 34 years, with 91.0% or 762 individuals in the labor force. Within the labor force, the 30 to 34 years age range has the highest percentage of unemployed individuals, with 18.2% or 139 of them being unemployed.
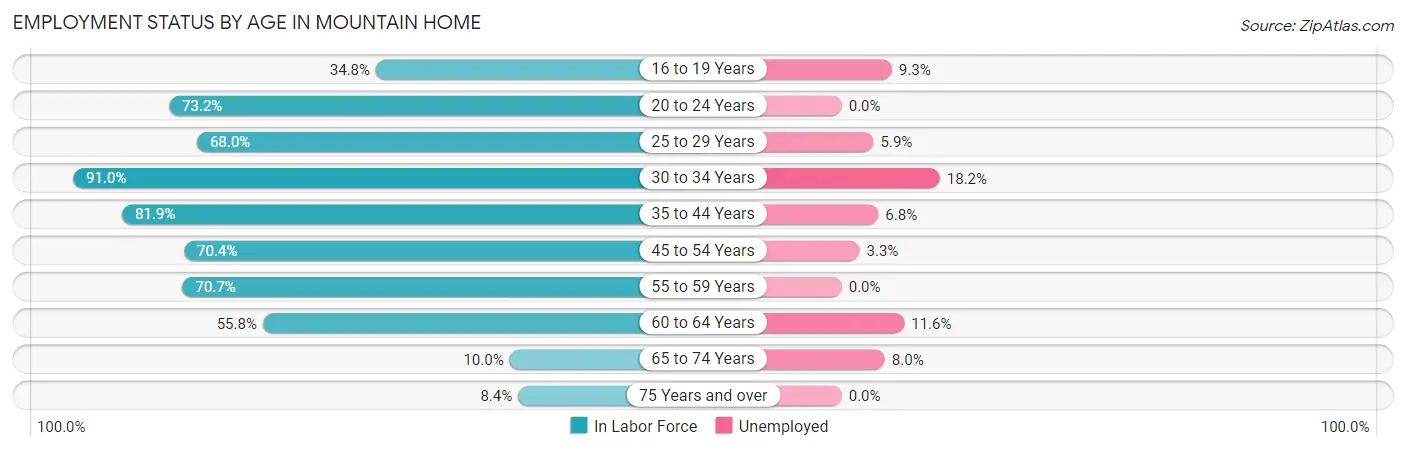
| Age Bracket | In Labor Force | Unemployed |
| 16 to 19 Years | 258 (34.8%) | 24 (9.3%) |
| 20 to 24 Years | 528 (73.2%) | 0 (0.0%) |
| 25 to 29 Years | 623 (68.0%) | 37 (5.9%) |
| 30 to 34 Years | 762 (91.0%) | 139 (18.2%) |
| 35 to 44 Years | 1,092 (81.9%) | 74 (6.8%) |
| 45 to 54 Years | 860 (70.4%) | 28 (3.3%) |
| 55 to 59 Years | 529 (70.7%) | 0 (0.0%) |
| 60 to 64 Years | 329 (55.8%) | 38 (11.6%) |
| 65 to 74 Years | 138 (10.0%) | 11 (8.0%) |
| 75 Years and over | 187 (8.4%) | 0 (0.0%) |
| Total | 5,300 (49.5%) | 350 (6.6%) |
Employment Status by Educational Attainment in Mountain Home
According to labor force statistics for Mountain Home, 74.3% of individuals (4,194) out of the total population between 25 and 64 years of age (5,645) are in the labor force, with 7.5% or 315 of them being unemployed. The group with the highest labor force participation rate are those with the educational attainment of bachelor's degree or higher, with 90.6% or 1,191 individuals in the labor force. Within the labor force, individuals with high school diploma education have the highest percentage of unemployment, with 8.8% or 105 of them being unemployed.
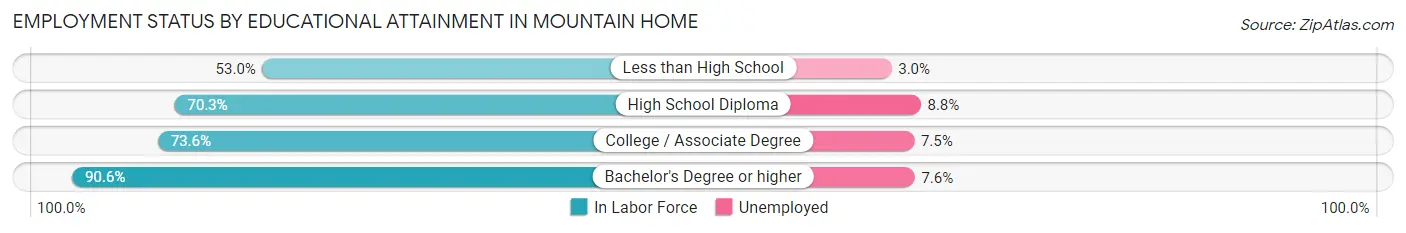
| Educational Attainment | In Labor Force | Unemployed |
| Less than High School | 334 (53.0%) | 19 (3.0%) |
| High School Diploma | 1,188 (70.3%) | 149 (8.8%) |
| College / Associate Degree | 1,479 (73.6%) | 151 (7.5%) |
| Bachelor's Degree or higher | 1,191 (90.6%) | 100 (7.6%) |
| Total | 4,194 (74.3%) | 423 (7.5%) |
Employment Occupations by Sex in Mountain Home
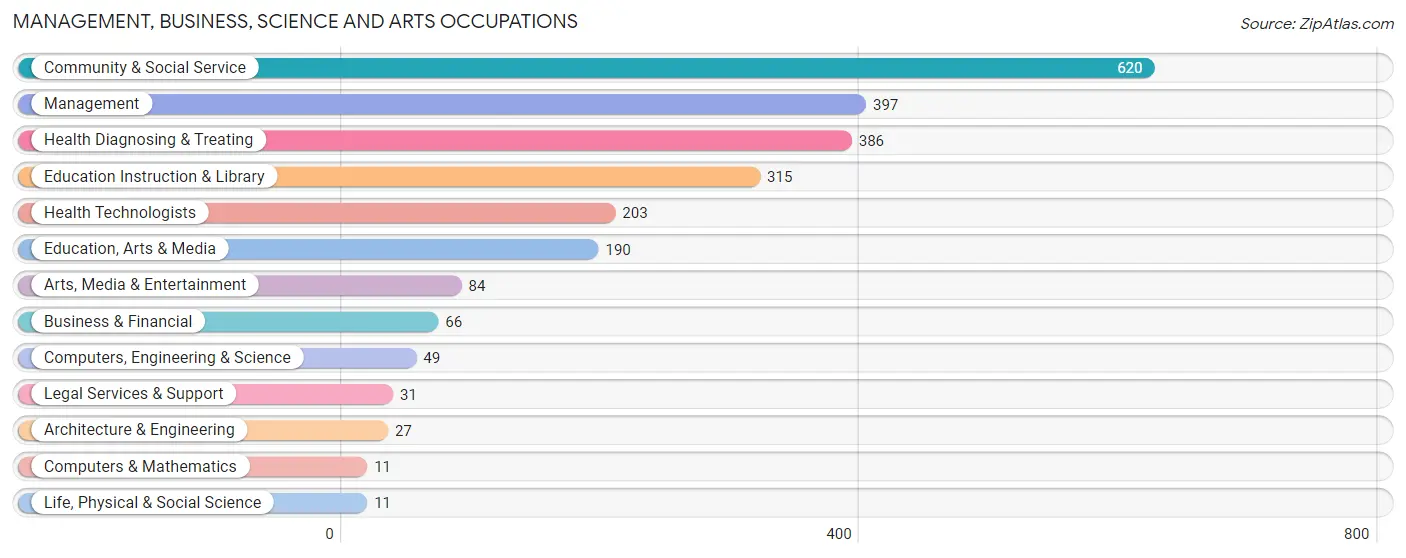
Management, Business, Science and Arts Occupations
The most common Management, Business, Science and Arts occupations in Mountain Home are Community & Social Service (620 | 12.5%), Management (397 | 8.0%), Health Diagnosing & Treating (386 | 7.8%), Education Instruction & Library (315 | 6.4%), and Health Technologists (203 | 4.1%).
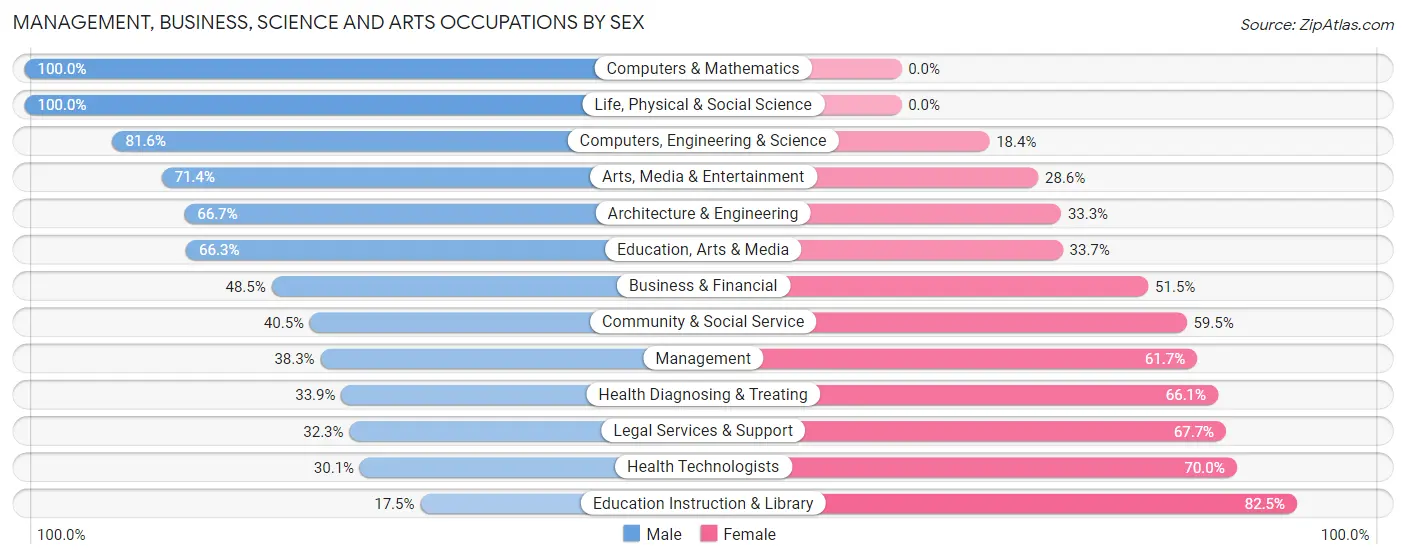
Management, Business, Science and Arts Occupations by Sex
Within the Management, Business, Science and Arts occupations in Mountain Home, the most male-oriented occupations are Computers & Mathematics (100.0%), Life, Physical & Social Science (100.0%), and Computers, Engineering & Science (81.6%), while the most female-oriented occupations are Education Instruction & Library (82.5%), Health Technologists (70.0%), and Legal Services & Support (67.7%).
| Occupation | Male | Female |
| Management | 152 (38.3%) | 245 (61.7%) |
| Business & Financial | 32 (48.5%) | 34 (51.5%) |
| Computers, Engineering & Science | 40 (81.6%) | 9 (18.4%) |
| Computers & Mathematics | 11 (100.0%) | 0 (0.0%) |
| Architecture & Engineering | 18 (66.7%) | 9 (33.3%) |
| Life, Physical & Social Science | 11 (100.0%) | 0 (0.0%) |
| Community & Social Service | 251 (40.5%) | 369 (59.5%) |
| Education, Arts & Media | 126 (66.3%) | 64 (33.7%) |
| Legal Services & Support | 10 (32.3%) | 21 (67.7%) |
| Education Instruction & Library | 55 (17.5%) | 260 (82.5%) |
| Arts, Media & Entertainment | 60 (71.4%) | 24 (28.6%) |
| Health Diagnosing & Treating | 131 (33.9%) | 255 (66.1%) |
| Health Technologists | 61 (30.0%) | 142 (70.0%) |
| Total (Category) | 606 (39.9%) | 912 (60.1%) |
| Total (Overall) | 2,751 (55.5%) | 2,202 (44.5%) |
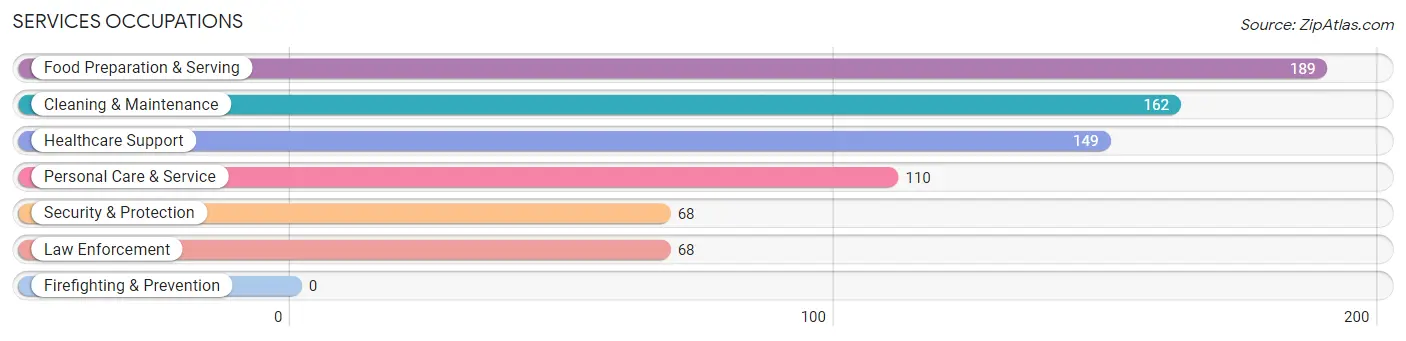
Services Occupations
The most common Services occupations in Mountain Home are Food Preparation & Serving (189 | 3.8%), Cleaning & Maintenance (162 | 3.3%), Healthcare Support (149 | 3.0%), Personal Care & Service (110 | 2.2%), and Security & Protection (68 | 1.4%).
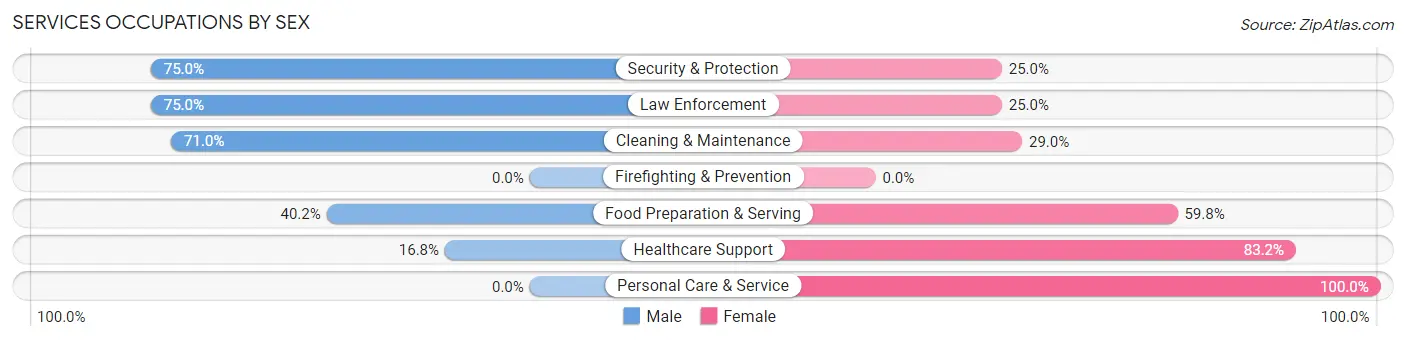
Services Occupations by Sex
Within the Services occupations in Mountain Home, the most male-oriented occupations are Security & Protection (75.0%), Law Enforcement (75.0%), and Cleaning & Maintenance (71.0%), while the most female-oriented occupations are Personal Care & Service (100.0%), Healthcare Support (83.2%), and Food Preparation & Serving (59.8%).
| Occupation | Male | Female |
| Healthcare Support | 25 (16.8%) | 124 (83.2%) |
| Security & Protection | 51 (75.0%) | 17 (25.0%) |
| Firefighting & Prevention | 0 (0.0%) | 0 (0.0%) |
| Law Enforcement | 51 (75.0%) | 17 (25.0%) |
| Food Preparation & Serving | 76 (40.2%) | 113 (59.8%) |
| Cleaning & Maintenance | 115 (71.0%) | 47 (29.0%) |
| Personal Care & Service | 0 (0.0%) | 110 (100.0%) |
| Total (Category) | 267 (39.4%) | 411 (60.6%) |
| Total (Overall) | 2,751 (55.5%) | 2,202 (44.5%) |
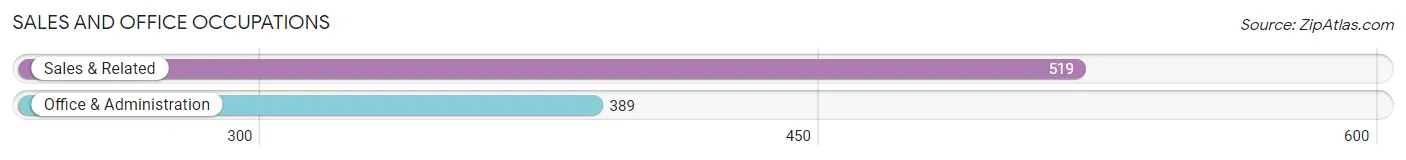
Sales and Office Occupations
The most common Sales and Office occupations in Mountain Home are Sales & Related (519 | 10.5%), and Office & Administration (389 | 7.9%).
Sales and Office Occupations by Sex
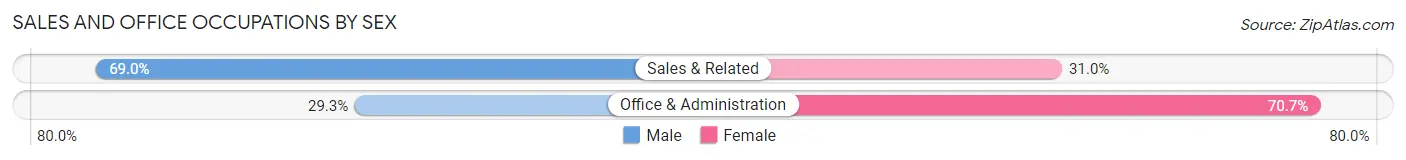
| Occupation | Male | Female |
| Sales & Related | 358 (69.0%) | 161 (31.0%) |
| Office & Administration | 114 (29.3%) | 275 (70.7%) |
| Total (Category) | 472 (52.0%) | 436 (48.0%) |
| Total (Overall) | 2,751 (55.5%) | 2,202 (44.5%) |
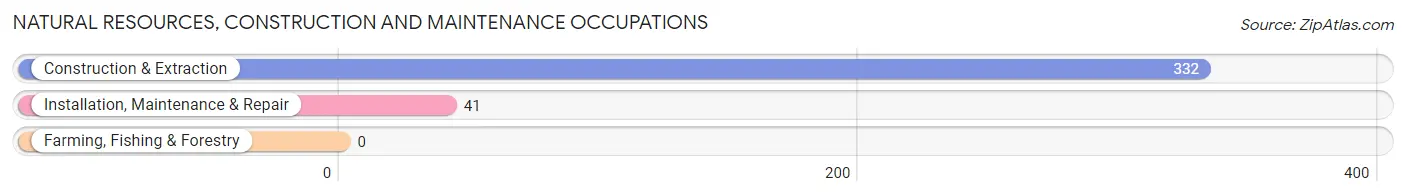
Natural Resources, Construction and Maintenance Occupations
The most common Natural Resources, Construction and Maintenance occupations in Mountain Home are Construction & Extraction (332 | 6.7%), and Installation, Maintenance & Repair (41 | 0.8%).
Natural Resources, Construction and Maintenance Occupations by Sex
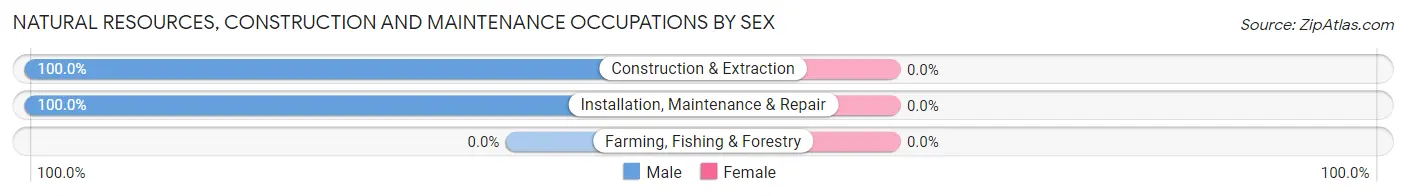
| Occupation | Male | Female |
| Farming, Fishing & Forestry | 0 (0.0%) | 0 (0.0%) |
| Construction & Extraction | 332 (100.0%) | 0 (0.0%) |
| Installation, Maintenance & Repair | 41 (100.0%) | 0 (0.0%) |
| Total (Category) | 373 (100.0%) | 0 (0.0%) |
| Total (Overall) | 2,751 (55.5%) | 2,202 (44.5%) |
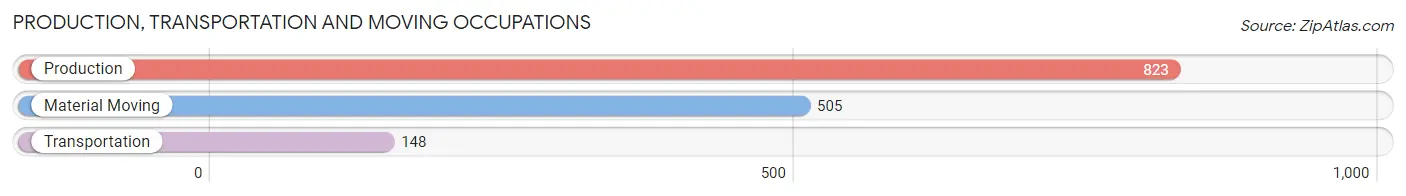
Production, Transportation and Moving Occupations
The most common Production, Transportation and Moving occupations in Mountain Home are Production (823 | 16.6%), Material Moving (505 | 10.2%), and Transportation (148 | 3.0%).
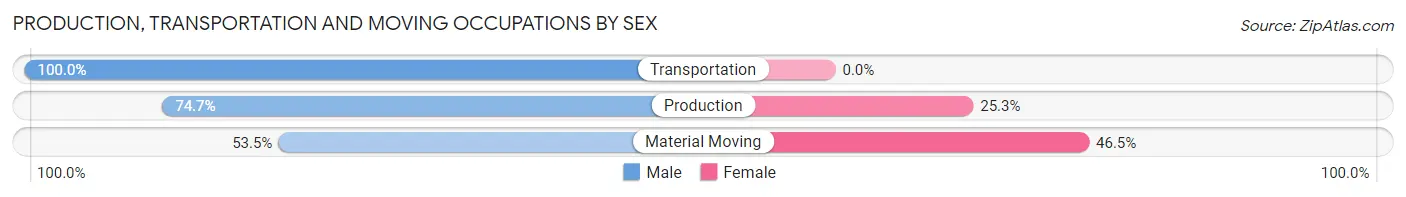
Production, Transportation and Moving Occupations by Sex
| Occupation | Male | Female |
| Production | 615 (74.7%) | 208 (25.3%) |
| Transportation | 148 (100.0%) | 0 (0.0%) |
| Material Moving | 270 (53.5%) | 235 (46.5%) |
| Total (Category) | 1,033 (70.0%) | 443 (30.0%) |
| Total (Overall) | 2,751 (55.5%) | 2,202 (44.5%) |
Employment Industries by Sex in Mountain Home
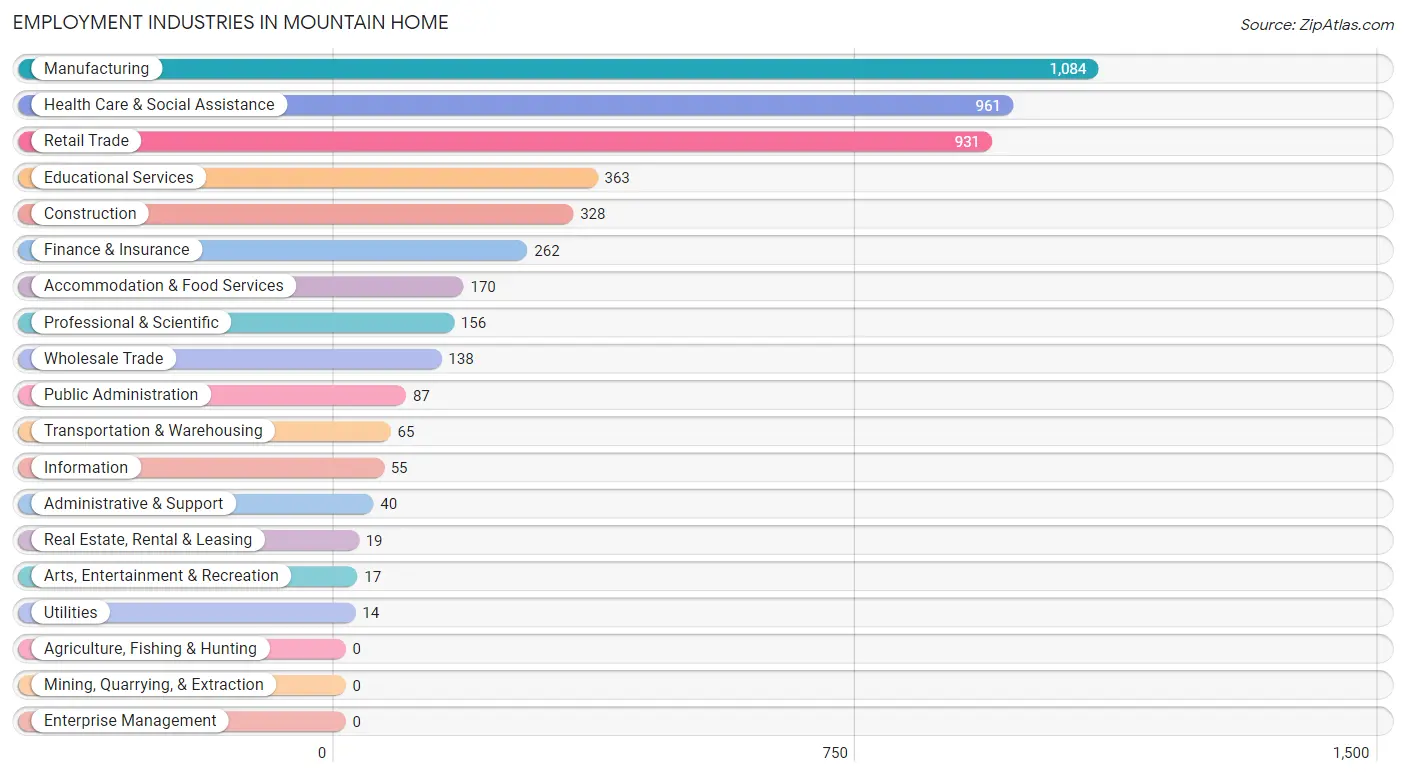
Employment Industries in Mountain Home
The major employment industries in Mountain Home include Manufacturing (1,084 | 21.9%), Health Care & Social Assistance (961 | 19.4%), Retail Trade (931 | 18.8%), Educational Services (363 | 7.3%), and Construction (328 | 6.6%).
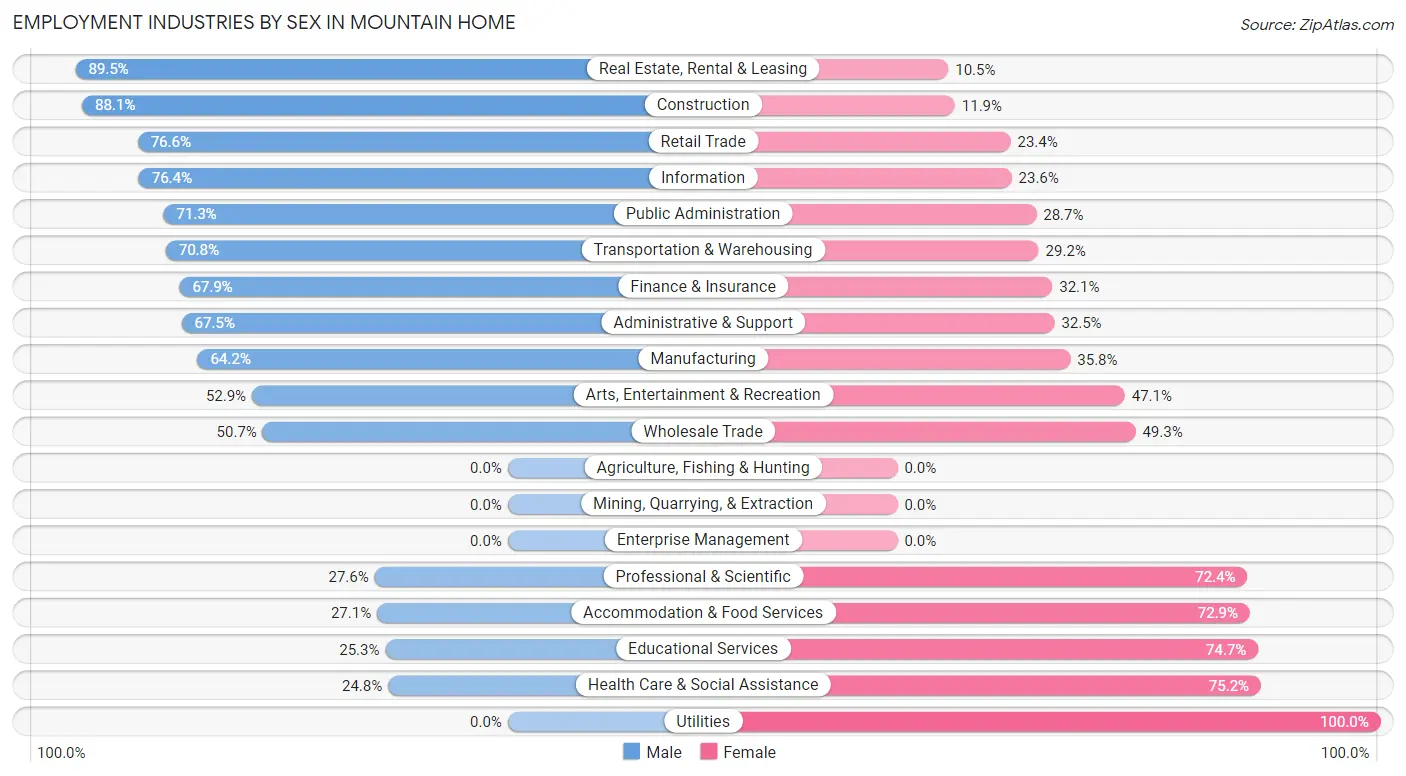
Employment Industries by Sex in Mountain Home
The Mountain Home industries that see more men than women are Real Estate, Rental & Leasing (89.5%), Construction (88.1%), and Retail Trade (76.6%), whereas the industries that tend to have a higher number of women are Utilities (100.0%), Health Care & Social Assistance (75.2%), and Educational Services (74.7%).
| Industry | Male | Female |
| Agriculture, Fishing & Hunting | 0 (0.0%) | 0 (0.0%) |
| Mining, Quarrying, & Extraction | 0 (0.0%) | 0 (0.0%) |
| Construction | 289 (88.1%) | 39 (11.9%) |
| Manufacturing | 696 (64.2%) | 388 (35.8%) |
| Wholesale Trade | 70 (50.7%) | 68 (49.3%) |
| Retail Trade | 713 (76.6%) | 218 (23.4%) |
| Transportation & Warehousing | 46 (70.8%) | 19 (29.2%) |
| Utilities | 0 (0.0%) | 14 (100.0%) |
| Information | 42 (76.4%) | 13 (23.6%) |
| Finance & Insurance | 178 (67.9%) | 84 (32.1%) |
| Real Estate, Rental & Leasing | 17 (89.5%) | 2 (10.5%) |
| Professional & Scientific | 43 (27.6%) | 113 (72.4%) |
| Enterprise Management | 0 (0.0%) | 0 (0.0%) |
| Administrative & Support | 27 (67.5%) | 13 (32.5%) |
| Educational Services | 92 (25.3%) | 271 (74.7%) |
| Health Care & Social Assistance | 238 (24.8%) | 723 (75.2%) |
| Arts, Entertainment & Recreation | 9 (52.9%) | 8 (47.1%) |
| Accommodation & Food Services | 46 (27.1%) | 124 (72.9%) |
| Public Administration | 62 (71.3%) | 25 (28.7%) |
| Total | 2,751 (55.5%) | 2,202 (44.5%) |
Education in Mountain Home
School Enrollment in Mountain Home
The most common levels of schooling among the 2,471 students in Mountain Home are middle school (594 | 24.0%), elementary school (587 | 23.8%), and high school (582 | 23.5%).
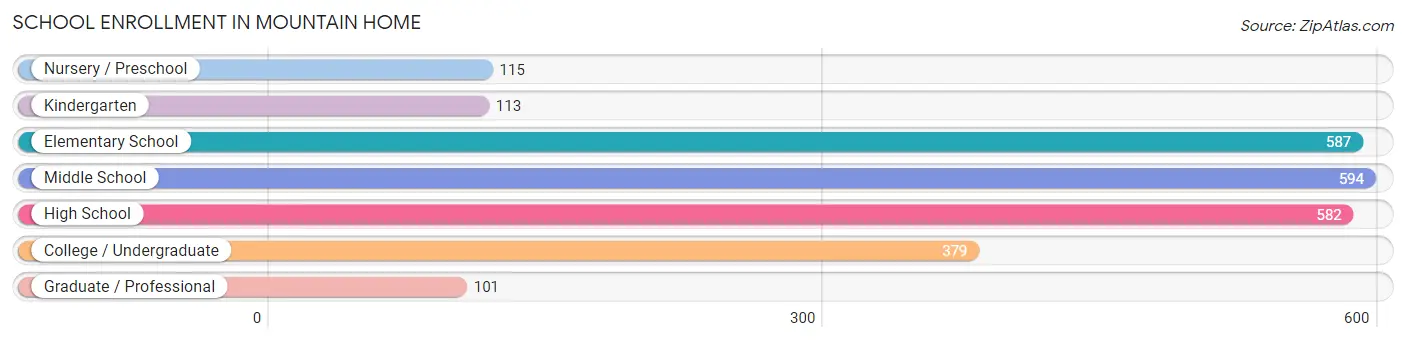
| School Level | # Students | % Students |
| Nursery / Preschool | 115 | 4.6% |
| Kindergarten | 113 | 4.6% |
| Elementary School | 587 | 23.8% |
| Middle School | 594 | 24.0% |
| High School | 582 | 23.5% |
| College / Undergraduate | 379 | 15.3% |
| Graduate / Professional | 101 | 4.1% |
| Total | 2,471 | 100.0% |
School Enrollment by Age by Funding Source in Mountain Home
Out of a total of 2,471 students who are enrolled in schools in Mountain Home, 168 (6.8%) attend a private institution, while the remaining 2,303 (93.2%) are enrolled in public schools. The age group of 20 to 24 year olds has the highest likelihood of being enrolled in private schools, with 20 (12.2% in the age bracket) enrolled. Conversely, the age group of 18 to 19 year olds has the lowest likelihood of being enrolled in a private school, with 73 (100.0% in the age bracket) attending a public institution.
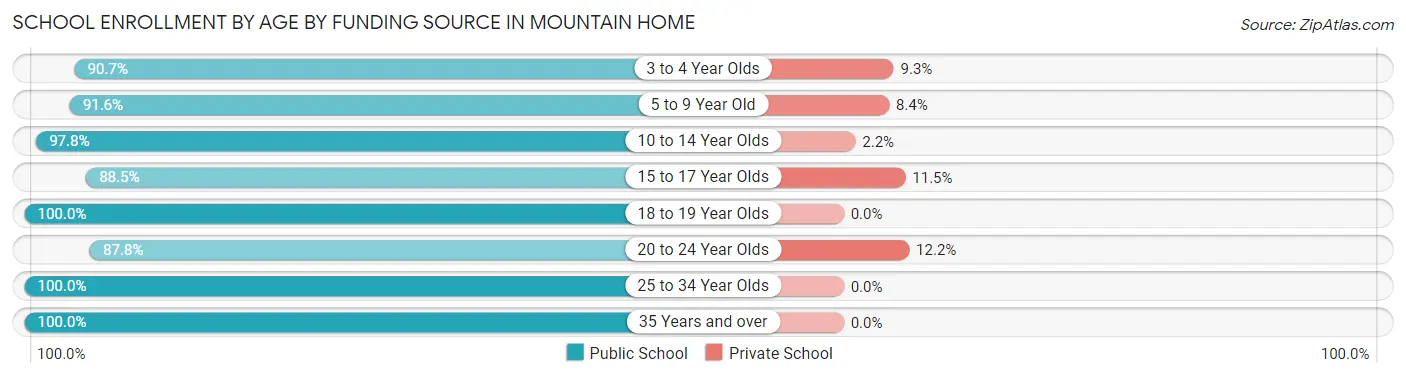
| Age Bracket | Public School | Private School |
| 3 to 4 Year Olds | 78 (90.7%) | 8 (9.3%) |
| 5 to 9 Year Old | 640 (91.6%) | 59 (8.4%) |
| 10 to 14 Year Olds | 586 (97.8%) | 13 (2.2%) |
| 15 to 17 Year Olds | 524 (88.5%) | 68 (11.5%) |
| 18 to 19 Year Olds | 73 (100.0%) | 0 (0.0%) |
| 20 to 24 Year Olds | 144 (87.8%) | 20 (12.2%) |
| 25 to 34 Year Olds | 129 (100.0%) | 0 (0.0%) |
| 35 Years and over | 129 (100.0%) | 0 (0.0%) |
| Total | 2,303 (93.2%) | 168 (6.8%) |
Educational Attainment by Field of Study in Mountain Home
Education (529 | 26.0%), business (437 | 21.5%), science & technology (378 | 18.6%), engineering (169 | 8.3%), and physical & health sciences (99 | 4.9%) are the most common fields of study among 2,034 individuals in Mountain Home who have obtained a bachelor's degree or higher.
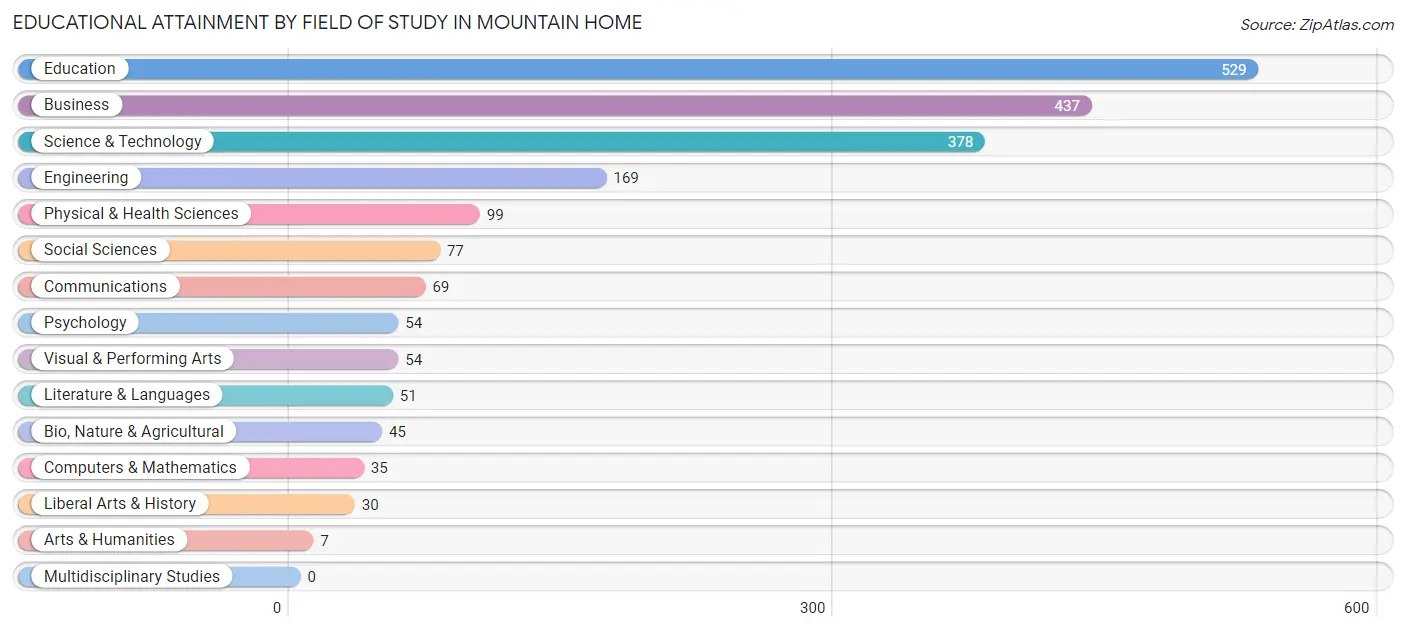
| Field of Study | # Graduates | % Graduates |
| Computers & Mathematics | 35 | 1.7% |
| Bio, Nature & Agricultural | 45 | 2.2% |
| Physical & Health Sciences | 99 | 4.9% |
| Psychology | 54 | 2.6% |
| Social Sciences | 77 | 3.8% |
| Engineering | 169 | 8.3% |
| Multidisciplinary Studies | 0 | 0.0% |
| Science & Technology | 378 | 18.6% |
| Business | 437 | 21.5% |
| Education | 529 | 26.0% |
| Literature & Languages | 51 | 2.5% |
| Liberal Arts & History | 30 | 1.5% |
| Visual & Performing Arts | 54 | 2.6% |
| Communications | 69 | 3.4% |
| Arts & Humanities | 7 | 0.3% |
| Total | 2,034 | 100.0% |
Transportation & Commute in Mountain Home
Vehicle Availability by Sex in Mountain Home
The most prevalent vehicle ownership categories in Mountain Home are males with 2 vehicles (1,135, accounting for 42.2%) and females with 2 vehicles (849, making up 51.8%).
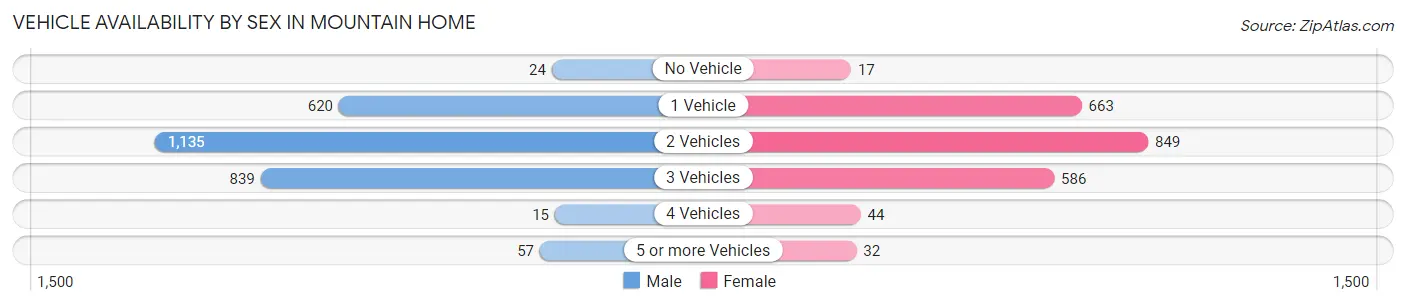
| Vehicles Available | Male | Female |
| No Vehicle | 24 (0.9%) | 17 (0.8%) |
| 1 Vehicle | 620 (23.1%) | 663 (30.3%) |
| 2 Vehicles | 1,135 (42.2%) | 849 (38.8%) |
| 3 Vehicles | 839 (31.2%) | 586 (26.8%) |
| 4 Vehicles | 15 (0.6%) | 44 (2.0%) |
| 5 or more Vehicles | 57 (2.1%) | 32 (1.5%) |
| Total | 2,690 (100.0%) | 2,191 (100.0%) |
Commute Time in Mountain Home
The most frequently occuring commute durations in Mountain Home are 5 to 9 minutes (1,606 commuters, 34.8%), 10 to 14 minutes (1,088 commuters, 23.6%), and 15 to 19 minutes (724 commuters, 15.7%).
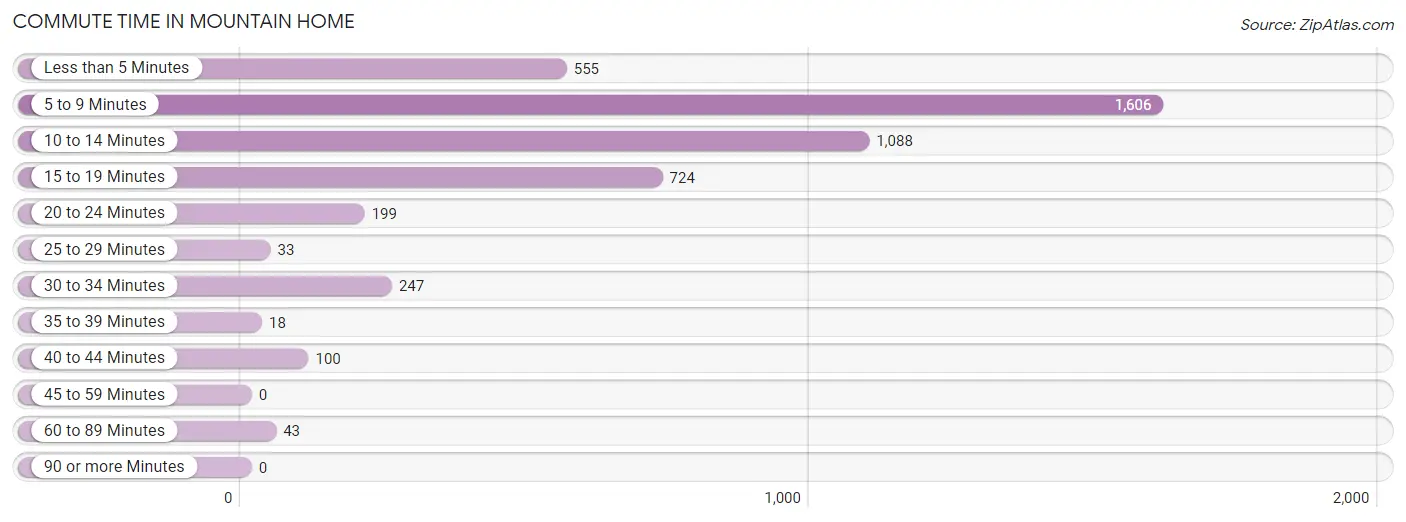
| Commute Time | # Commuters | % Commuters |
| Less than 5 Minutes | 555 | 12.0% |
| 5 to 9 Minutes | 1,606 | 34.8% |
| 10 to 14 Minutes | 1,088 | 23.6% |
| 15 to 19 Minutes | 724 | 15.7% |
| 20 to 24 Minutes | 199 | 4.3% |
| 25 to 29 Minutes | 33 | 0.7% |
| 30 to 34 Minutes | 247 | 5.3% |
| 35 to 39 Minutes | 18 | 0.4% |
| 40 to 44 Minutes | 100 | 2.2% |
| 45 to 59 Minutes | 0 | 0.0% |
| 60 to 89 Minutes | 43 | 0.9% |
| 90 or more Minutes | 0 | 0.0% |
Commute Time by Sex in Mountain Home
The most common commute times in Mountain Home are 5 to 9 minutes (774 commuters, 31.1%) for males and 5 to 9 minutes (832 commuters, 39.2%) for females.
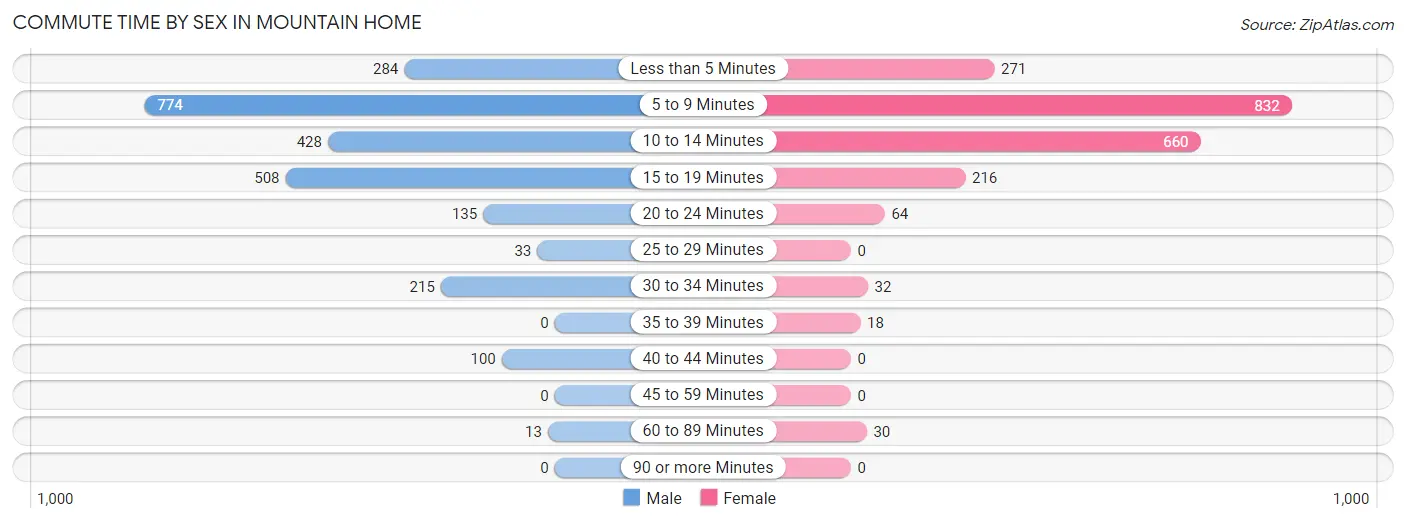
| Commute Time | Male | Female |
| Less than 5 Minutes | 284 (11.4%) | 271 (12.8%) |
| 5 to 9 Minutes | 774 (31.1%) | 832 (39.2%) |
| 10 to 14 Minutes | 428 (17.2%) | 660 (31.1%) |
| 15 to 19 Minutes | 508 (20.4%) | 216 (10.2%) |
| 20 to 24 Minutes | 135 (5.4%) | 64 (3.0%) |
| 25 to 29 Minutes | 33 (1.3%) | 0 (0.0%) |
| 30 to 34 Minutes | 215 (8.6%) | 32 (1.5%) |
| 35 to 39 Minutes | 0 (0.0%) | 18 (0.9%) |
| 40 to 44 Minutes | 100 (4.0%) | 0 (0.0%) |
| 45 to 59 Minutes | 0 (0.0%) | 0 (0.0%) |
| 60 to 89 Minutes | 13 (0.5%) | 30 (1.4%) |
| 90 or more Minutes | 0 (0.0%) | 0 (0.0%) |
Time of Departure to Work by Sex in Mountain Home
The most frequent times of departure to work in Mountain Home are 7:00 AM to 7:29 AM (496, 19.9%) for males and 7:30 AM to 7:59 AM (553, 26.1%) for females.
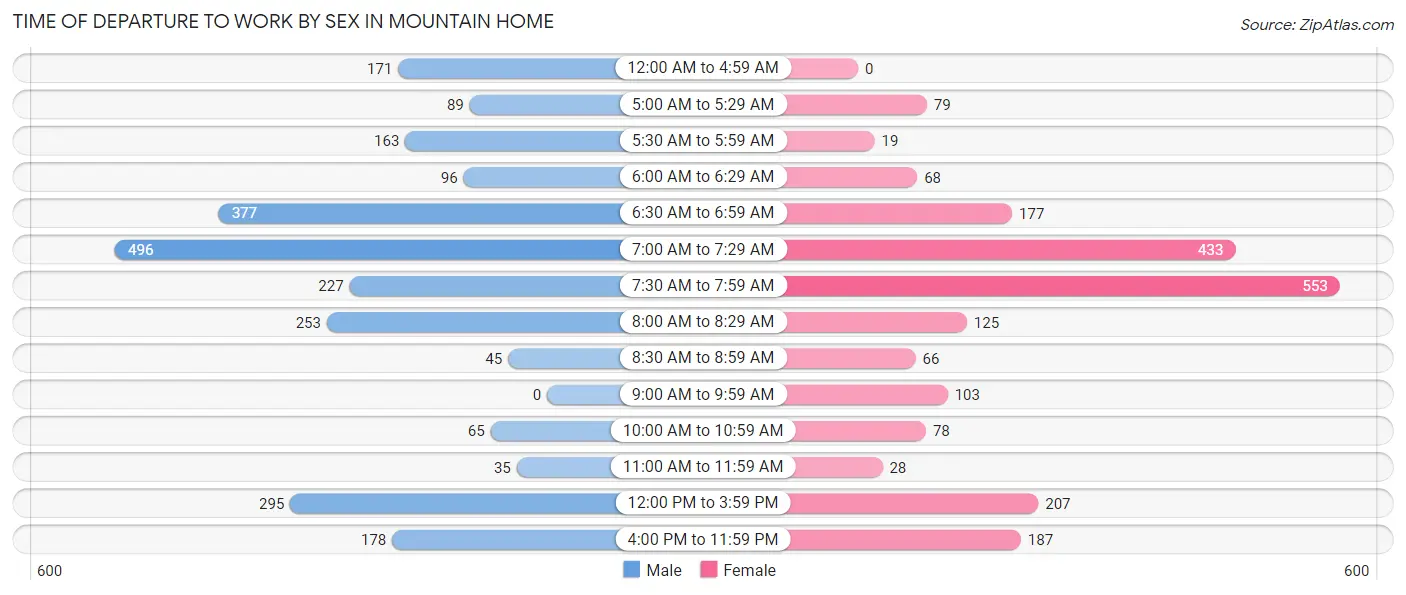
| Time of Departure | Male | Female |
| 12:00 AM to 4:59 AM | 171 (6.9%) | 0 (0.0%) |
| 5:00 AM to 5:29 AM | 89 (3.6%) | 79 (3.7%) |
| 5:30 AM to 5:59 AM | 163 (6.6%) | 19 (0.9%) |
| 6:00 AM to 6:29 AM | 96 (3.9%) | 68 (3.2%) |
| 6:30 AM to 6:59 AM | 377 (15.1%) | 177 (8.3%) |
| 7:00 AM to 7:29 AM | 496 (19.9%) | 433 (20.4%) |
| 7:30 AM to 7:59 AM | 227 (9.1%) | 553 (26.1%) |
| 8:00 AM to 8:29 AM | 253 (10.2%) | 125 (5.9%) |
| 8:30 AM to 8:59 AM | 45 (1.8%) | 66 (3.1%) |
| 9:00 AM to 9:59 AM | 0 (0.0%) | 103 (4.9%) |
| 10:00 AM to 10:59 AM | 65 (2.6%) | 78 (3.7%) |
| 11:00 AM to 11:59 AM | 35 (1.4%) | 28 (1.3%) |
| 12:00 PM to 3:59 PM | 295 (11.8%) | 207 (9.8%) |
| 4:00 PM to 11:59 PM | 178 (7.1%) | 187 (8.8%) |
| Total | 2,490 (100.0%) | 2,123 (100.0%) |
Housing Occupancy in Mountain Home
Occupancy by Ownership in Mountain Home
Of the total 5,979 dwellings in Mountain Home, owner-occupied units account for 3,427 (57.3%), while renter-occupied units make up 2,552 (42.7%).
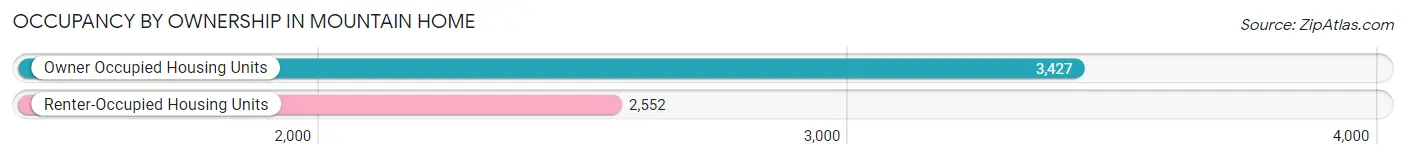
| Occupancy | # Housing Units | % Housing Units |
| Owner Occupied Housing Units | 3,427 | 57.3% |
| Renter-Occupied Housing Units | 2,552 | 42.7% |
| Total Occupied Housing Units | 5,979 | 100.0% |
Occupancy by Household Size in Mountain Home
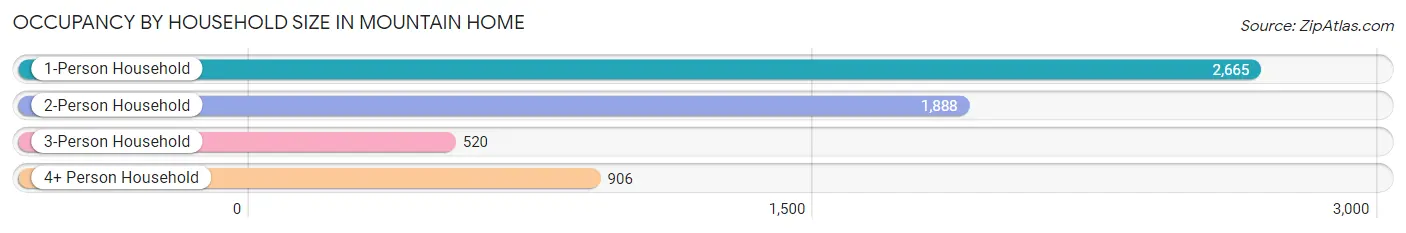
| Household Size | # Housing Units | % Housing Units |
| 1-Person Household | 2,665 | 44.6% |
| 2-Person Household | 1,888 | 31.6% |
| 3-Person Household | 520 | 8.7% |
| 4+ Person Household | 906 | 15.1% |
| Total Housing Units | 5,979 | 100.0% |
Occupancy by Ownership by Household Size in Mountain Home
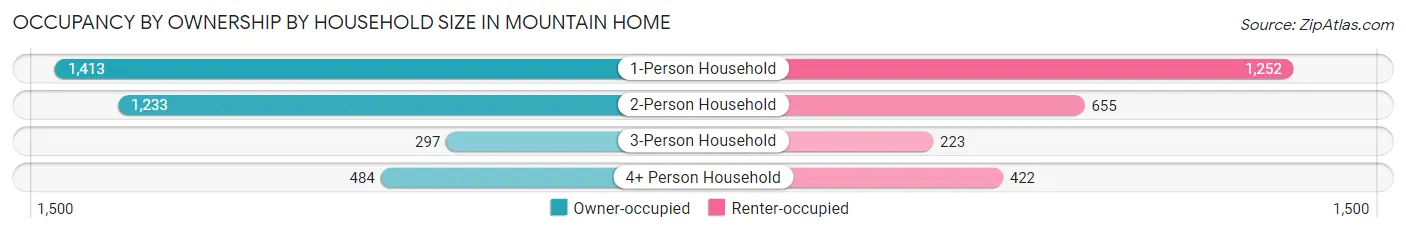
| Household Size | Owner-occupied | Renter-occupied |
| 1-Person Household | 1,413 (53.0%) | 1,252 (47.0%) |
| 2-Person Household | 1,233 (65.3%) | 655 (34.7%) |
| 3-Person Household | 297 (57.1%) | 223 (42.9%) |
| 4+ Person Household | 484 (53.4%) | 422 (46.6%) |
| Total Housing Units | 3,427 (57.3%) | 2,552 (42.7%) |
Occupancy by Educational Attainment in Mountain Home
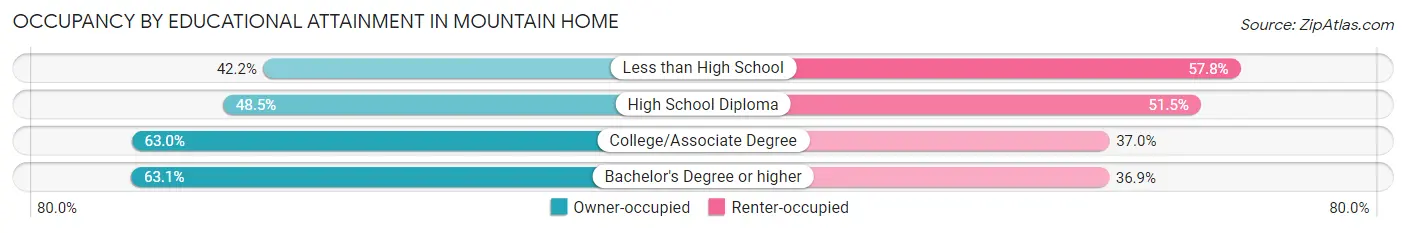
| Household Size | Owner-occupied | Renter-occupied |
| Less than High School | 163 (42.2%) | 223 (57.8%) |
| High School Diploma | 878 (48.5%) | 931 (51.5%) |
| College/Associate Degree | 1,541 (63.0%) | 904 (37.0%) |
| Bachelor's Degree or higher | 845 (63.1%) | 494 (36.9%) |
Occupancy by Age of Householder in Mountain Home
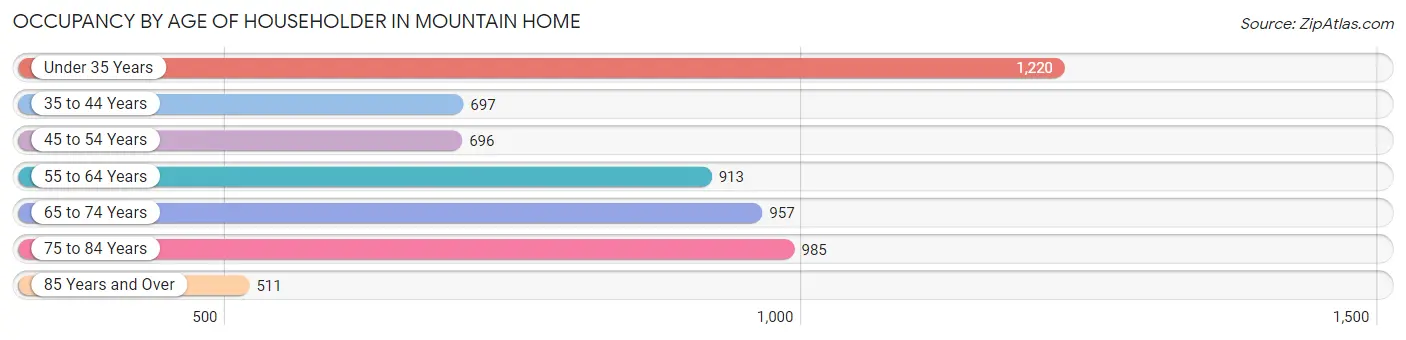
| Age Bracket | # Households | % Households |
| Under 35 Years | 1,220 | 20.4% |
| 35 to 44 Years | 697 | 11.7% |
| 45 to 54 Years | 696 | 11.6% |
| 55 to 64 Years | 913 | 15.3% |
| 65 to 74 Years | 957 | 16.0% |
| 75 to 84 Years | 985 | 16.5% |
| 85 Years and Over | 511 | 8.6% |
| Total | 5,979 | 100.0% |
Housing Finances in Mountain Home
Median Income by Occupancy in Mountain Home
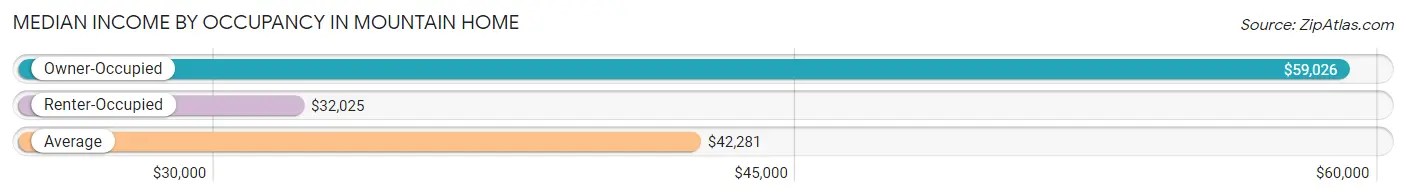
| Occupancy Type | # Households | Median Income |
| Owner-Occupied | 3,427 (57.3%) | $59,026 |
| Renter-Occupied | 2,552 (42.7%) | $32,025 |
| Average | 5,979 (100.0%) | $42,281 |
Occupancy by Householder Income Bracket in Mountain Home
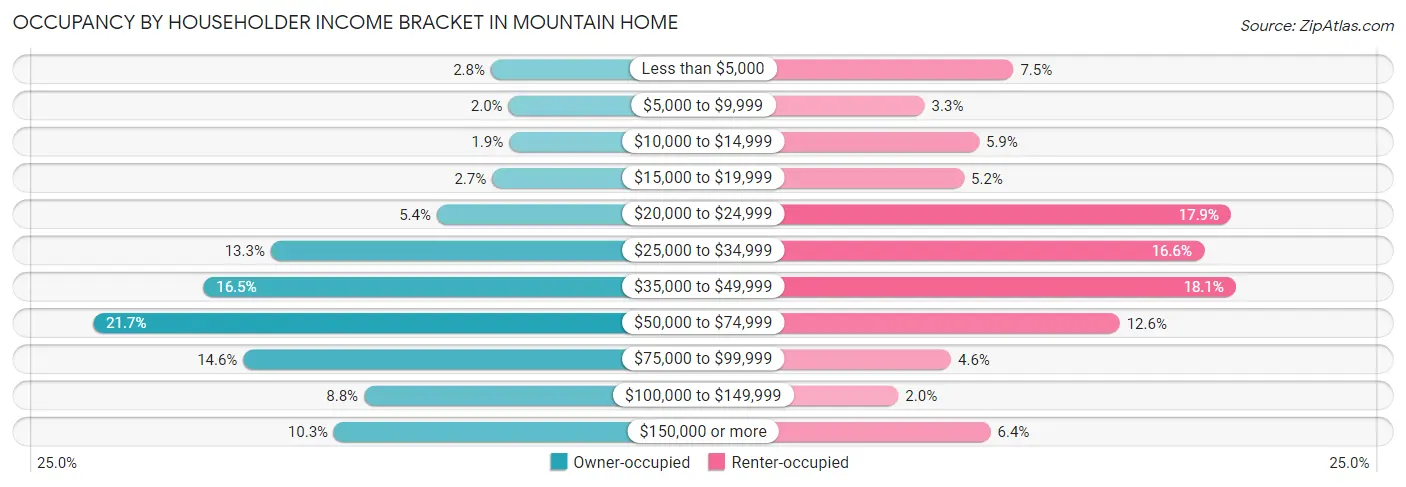
| Income Bracket | Owner-occupied | Renter-occupied |
| Less than $5,000 | 96 (2.8%) | 192 (7.5%) |
| $5,000 to $9,999 | 67 (2.0%) | 84 (3.3%) |
| $10,000 to $14,999 | 66 (1.9%) | 150 (5.9%) |
| $15,000 to $19,999 | 94 (2.7%) | 132 (5.2%) |
| $20,000 to $24,999 | 184 (5.4%) | 456 (17.9%) |
| $25,000 to $34,999 | 455 (13.3%) | 423 (16.6%) |
| $35,000 to $49,999 | 565 (16.5%) | 462 (18.1%) |
| $50,000 to $74,999 | 745 (21.7%) | 321 (12.6%) |
| $75,000 to $99,999 | 500 (14.6%) | 116 (4.5%) |
| $100,000 to $149,999 | 303 (8.8%) | 52 (2.0%) |
| $150,000 or more | 352 (10.3%) | 164 (6.4%) |
| Total | 3,427 (100.0%) | 2,552 (100.0%) |
Monthly Housing Cost Tiers in Mountain Home
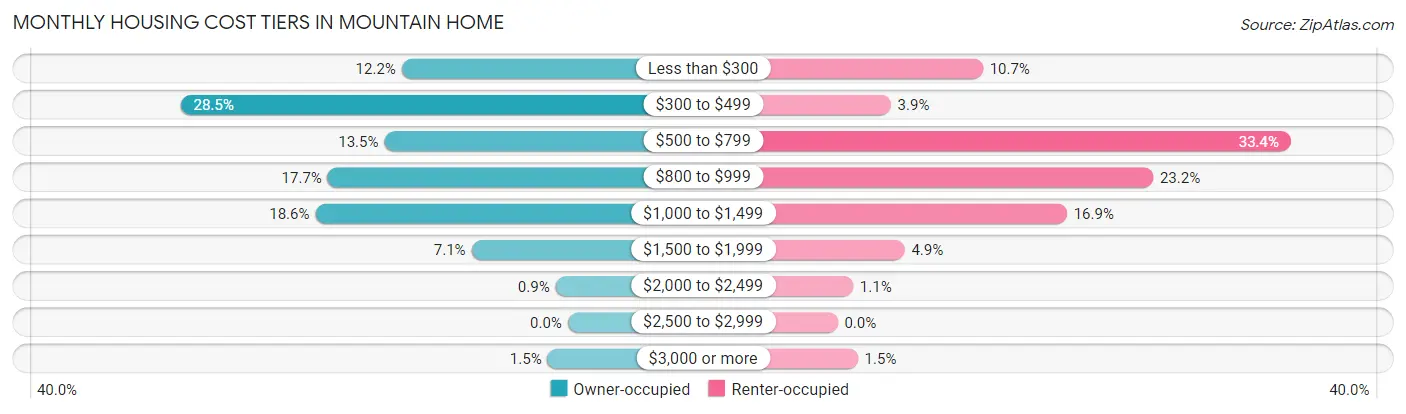
| Monthly Cost | Owner-occupied | Renter-occupied |
| Less than $300 | 419 (12.2%) | 273 (10.7%) |
| $300 to $499 | 977 (28.5%) | 100 (3.9%) |
| $500 to $799 | 463 (13.5%) | 852 (33.4%) |
| $800 to $999 | 606 (17.7%) | 593 (23.2%) |
| $1,000 to $1,499 | 637 (18.6%) | 431 (16.9%) |
| $1,500 to $1,999 | 243 (7.1%) | 126 (4.9%) |
| $2,000 to $2,499 | 31 (0.9%) | 29 (1.1%) |
| $2,500 to $2,999 | 0 (0.0%) | 0 (0.0%) |
| $3,000 or more | 51 (1.5%) | 38 (1.5%) |
| Total | 3,427 (100.0%) | 2,552 (100.0%) |
Physical Housing Characteristics in Mountain Home
Housing Structures in Mountain Home
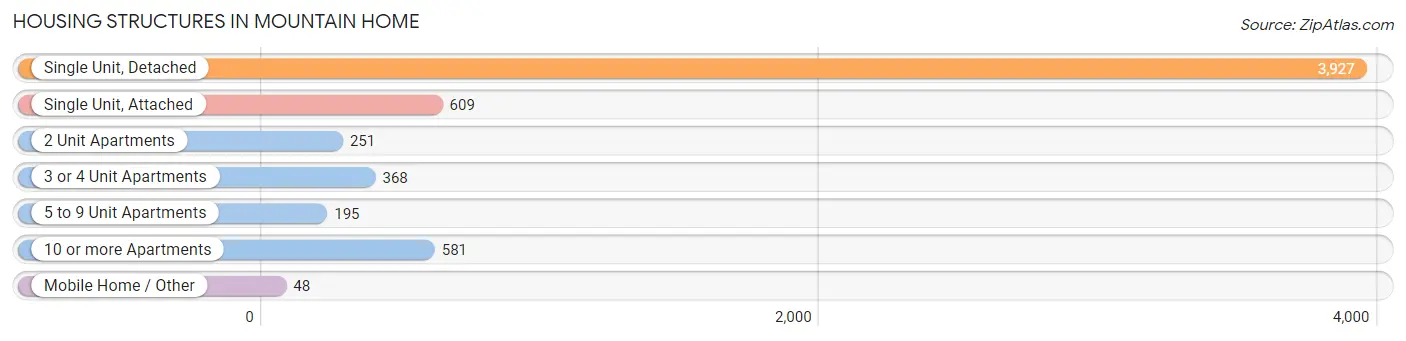
| Structure Type | # Housing Units | % Housing Units |
| Single Unit, Detached | 3,927 | 65.7% |
| Single Unit, Attached | 609 | 10.2% |
| 2 Unit Apartments | 251 | 4.2% |
| 3 or 4 Unit Apartments | 368 | 6.1% |
| 5 to 9 Unit Apartments | 195 | 3.3% |
| 10 or more Apartments | 581 | 9.7% |
| Mobile Home / Other | 48 | 0.8% |
| Total | 5,979 | 100.0% |
Housing Structures by Occupancy in Mountain Home
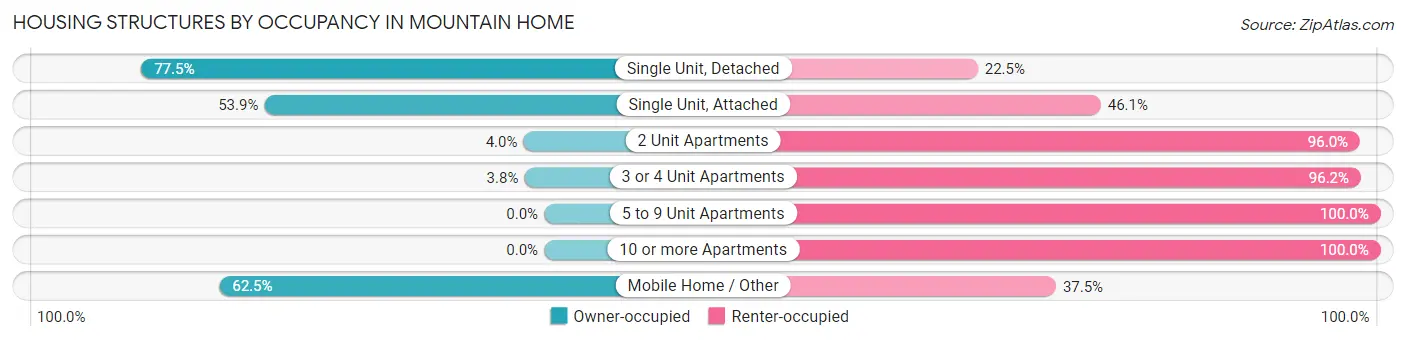
| Structure Type | Owner-occupied | Renter-occupied |
| Single Unit, Detached | 3,045 (77.5%) | 882 (22.5%) |
| Single Unit, Attached | 328 (53.9%) | 281 (46.1%) |
| 2 Unit Apartments | 10 (4.0%) | 241 (96.0%) |
| 3 or 4 Unit Apartments | 14 (3.8%) | 354 (96.2%) |
| 5 to 9 Unit Apartments | 0 (0.0%) | 195 (100.0%) |
| 10 or more Apartments | 0 (0.0%) | 581 (100.0%) |
| Mobile Home / Other | 30 (62.5%) | 18 (37.5%) |
| Total | 3,427 (57.3%) | 2,552 (42.7%) |
Housing Structures by Number of Rooms in Mountain Home
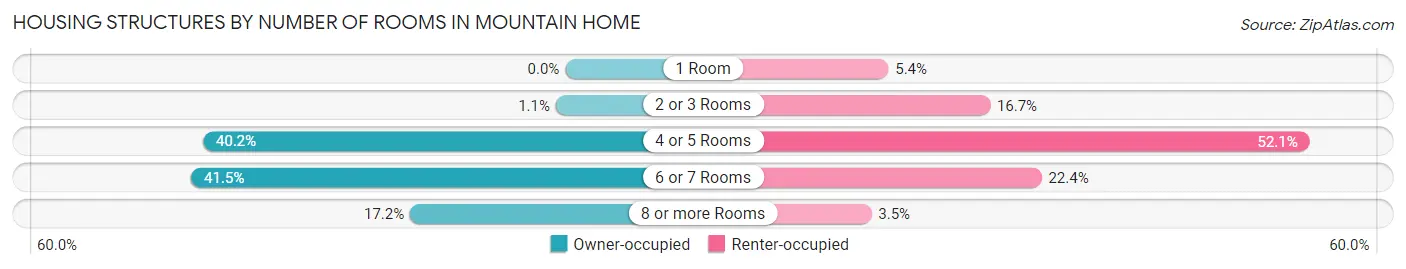
| Number of Rooms | Owner-occupied | Renter-occupied |
| 1 Room | 0 (0.0%) | 137 (5.4%) |
| 2 or 3 Rooms | 36 (1.1%) | 425 (16.7%) |
| 4 or 5 Rooms | 1,378 (40.2%) | 1,330 (52.1%) |
| 6 or 7 Rooms | 1,423 (41.5%) | 571 (22.4%) |
| 8 or more Rooms | 590 (17.2%) | 89 (3.5%) |
| Total | 3,427 (100.0%) | 2,552 (100.0%) |
Housing Structure by Heating Type in Mountain Home
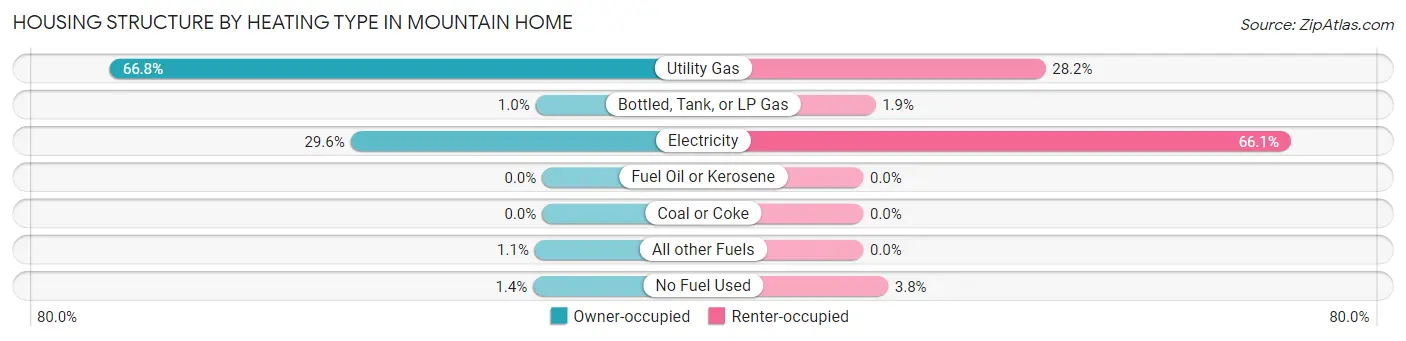
| Heating Type | Owner-occupied | Renter-occupied |
| Utility Gas | 2,290 (66.8%) | 719 (28.2%) |
| Bottled, Tank, or LP Gas | 35 (1.0%) | 48 (1.9%) |
| Electricity | 1,015 (29.6%) | 1,687 (66.1%) |
| Fuel Oil or Kerosene | 0 (0.0%) | 0 (0.0%) |
| Coal or Coke | 0 (0.0%) | 0 (0.0%) |
| All other Fuels | 39 (1.1%) | 0 (0.0%) |
| No Fuel Used | 48 (1.4%) | 98 (3.8%) |
| Total | 3,427 (100.0%) | 2,552 (100.0%) |
Household Vehicle Usage in Mountain Home
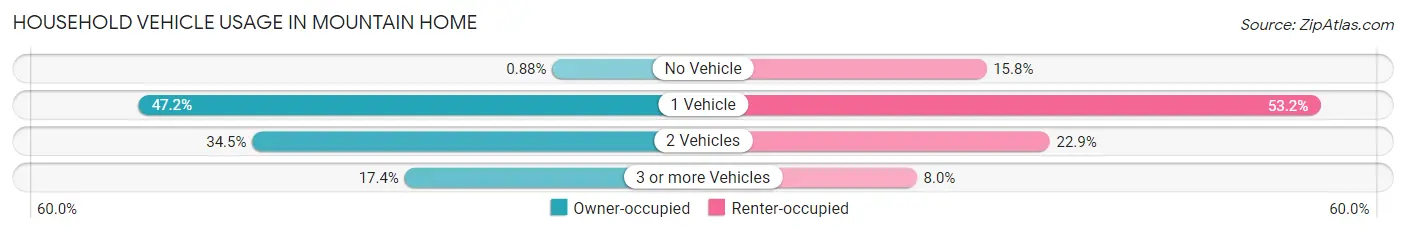
| Vehicles per Household | Owner-occupied | Renter-occupied |
| No Vehicle | 30 (0.9%) | 404 (15.8%) |
| 1 Vehicle | 1,618 (47.2%) | 1,358 (53.2%) |
| 2 Vehicles | 1,182 (34.5%) | 585 (22.9%) |
| 3 or more Vehicles | 597 (17.4%) | 205 (8.0%) |
| Total | 3,427 (100.0%) | 2,552 (100.0%) |
Real Estate & Mortgages in Mountain Home
Real Estate and Mortgage Overview in Mountain Home
| Characteristic | Without Mortgage | With Mortgage |
| Housing Units | 1,570 | 1,857 |
| Median Property Value | $148,200 | $153,000 |
| Median Household Income | $41,133 | $328 |
| Monthly Housing Costs | $378 | $37 |
| Real Estate Taxes | $703 | $11 |
Property Value by Mortgage Status in Mountain Home
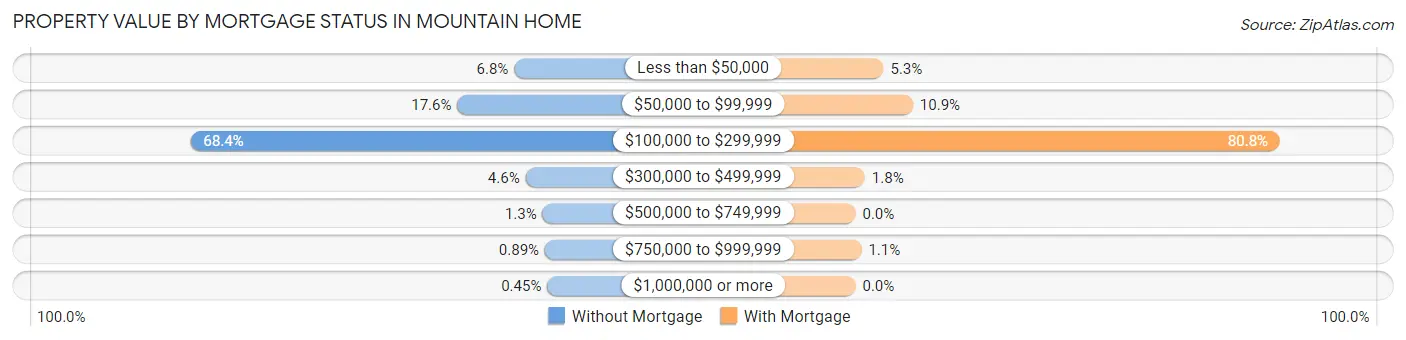
| Property Value | Without Mortgage | With Mortgage |
| Less than $50,000 | 106 (6.8%) | 99 (5.3%) |
| $50,000 to $99,999 | 276 (17.6%) | 203 (10.9%) |
| $100,000 to $299,999 | 1,074 (68.4%) | 1,501 (80.8%) |
| $300,000 to $499,999 | 72 (4.6%) | 33 (1.8%) |
| $500,000 to $749,999 | 21 (1.3%) | 0 (0.0%) |
| $750,000 to $999,999 | 14 (0.9%) | 21 (1.1%) |
| $1,000,000 or more | 7 (0.4%) | 0 (0.0%) |
| Total | 1,570 (100.0%) | 1,857 (100.0%) |
Household Income by Mortgage Status in Mountain Home
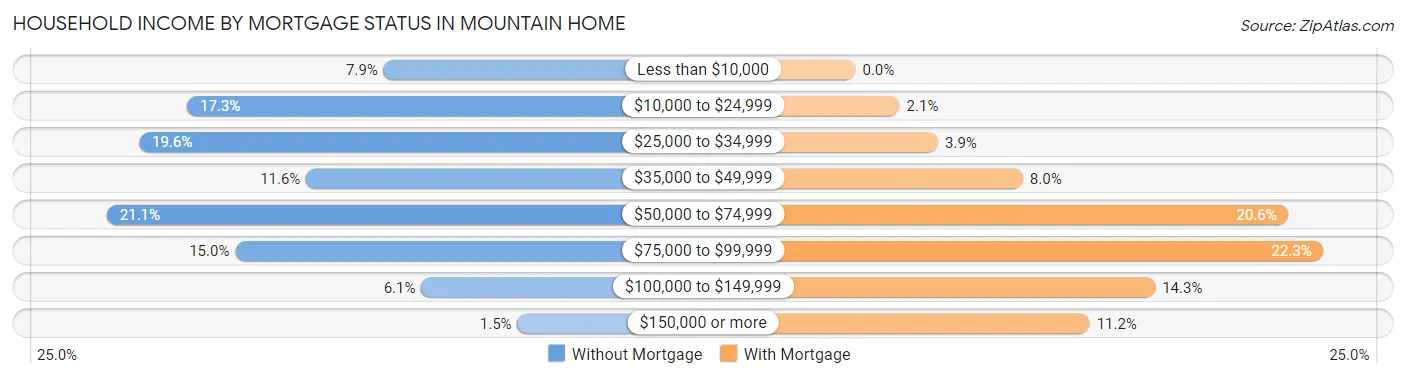
| Household Income | Without Mortgage | With Mortgage |
| Less than $10,000 | 124 (7.9%) | 0 (0.0%) |
| $10,000 to $24,999 | 271 (17.3%) | 39 (2.1%) |
| $25,000 to $34,999 | 307 (19.6%) | 73 (3.9%) |
| $35,000 to $49,999 | 182 (11.6%) | 148 (8.0%) |
| $50,000 to $74,999 | 331 (21.1%) | 383 (20.6%) |
| $75,000 to $99,999 | 235 (15.0%) | 414 (22.3%) |
| $100,000 to $149,999 | 96 (6.1%) | 265 (14.3%) |
| $150,000 or more | 24 (1.5%) | 207 (11.2%) |
| Total | 1,570 (100.0%) | 1,857 (100.0%) |
Property Value to Household Income Ratio in Mountain Home
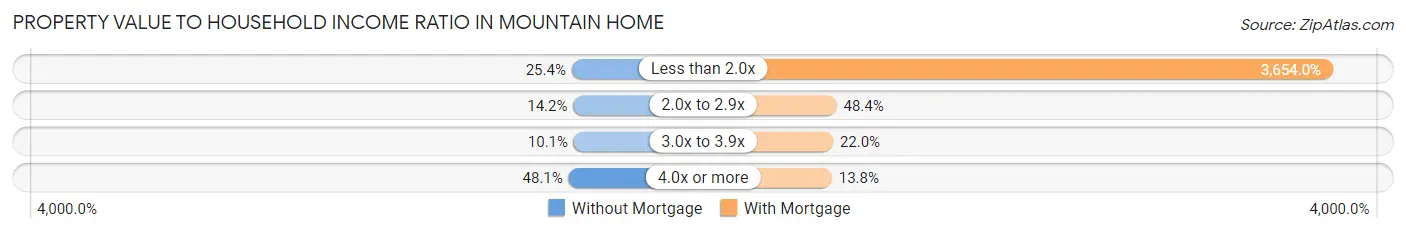
| Value-to-Income Ratio | Without Mortgage | With Mortgage |
| Less than 2.0x | 399 (25.4%) | 67,855 (3,654.0%) |
| 2.0x to 2.9x | 223 (14.2%) | 898 (48.4%) |
| 3.0x to 3.9x | 158 (10.1%) | 408 (22.0%) |
| 4.0x or more | 755 (48.1%) | 256 (13.8%) |
| Total | 1,570 (100.0%) | 1,857 (100.0%) |
Real Estate Taxes by Mortgage Status in Mountain Home
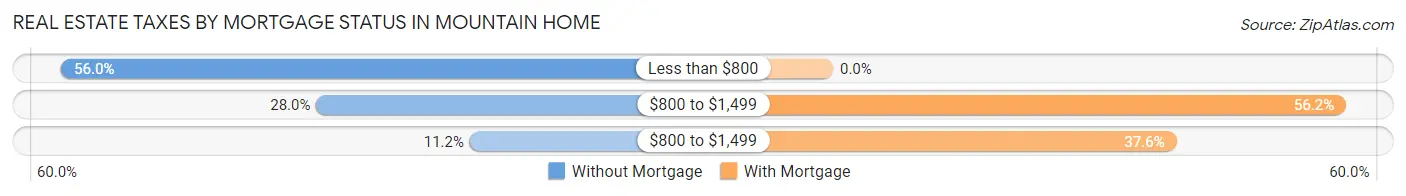
| Property Taxes | Without Mortgage | With Mortgage |
| Less than $800 | 879 (56.0%) | 0 (0.0%) |
| $800 to $1,499 | 440 (28.0%) | 1,044 (56.2%) |
| $800 to $1,499 | 176 (11.2%) | 699 (37.6%) |
| Total | 1,570 (100.0%) | 1,857 (100.0%) |
Health & Disability in Mountain Home
Health Insurance Coverage by Age in Mountain Home
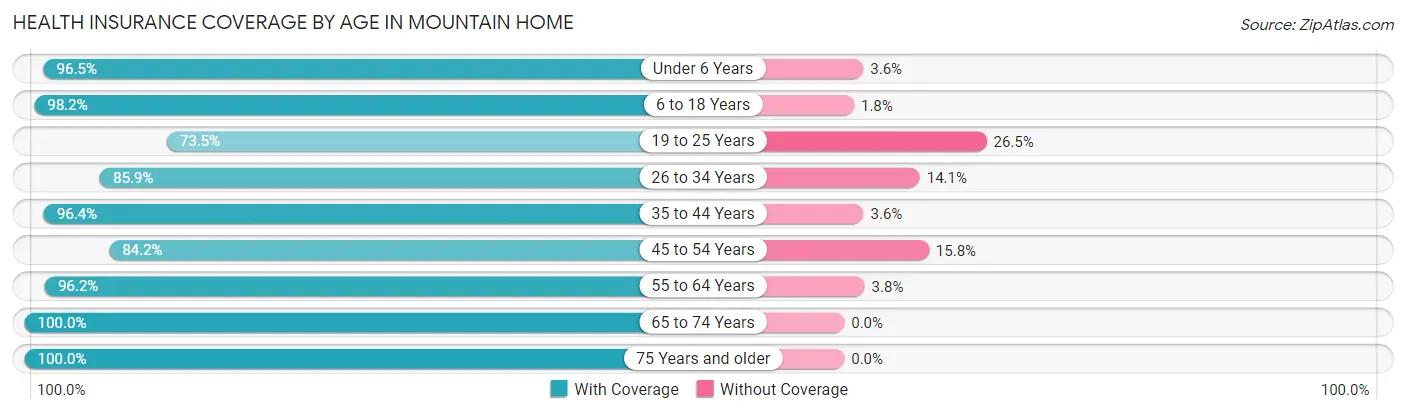
| Age Bracket | With Coverage | Without Coverage |
| Under 6 Years | 789 (96.5%) | 29 (3.5%) |
| 6 to 18 Years | 1,730 (98.2%) | 32 (1.8%) |
| 19 to 25 Years | 988 (73.5%) | 357 (26.5%) |
| 26 to 34 Years | 1,239 (85.9%) | 203 (14.1%) |
| 35 to 44 Years | 1,260 (96.4%) | 47 (3.6%) |
| 45 to 54 Years | 1,009 (84.2%) | 189 (15.8%) |
| 55 to 64 Years | 1,267 (96.2%) | 50 (3.8%) |
| 65 to 74 Years | 1,333 (100.0%) | 0 (0.0%) |
| 75 Years and older | 2,075 (100.0%) | 0 (0.0%) |
| Total | 11,690 (92.8%) | 907 (7.2%) |
Health Insurance Coverage by Citizenship Status in Mountain Home
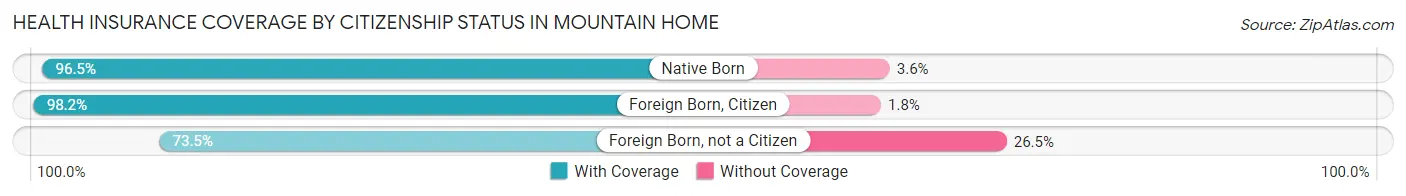
| Citizenship Status | With Coverage | Without Coverage |
| Native Born | 789 (96.5%) | 29 (3.5%) |
| Foreign Born, Citizen | 1,730 (98.2%) | 32 (1.8%) |
| Foreign Born, not a Citizen | 988 (73.5%) | 357 (26.5%) |
Health Insurance Coverage by Household Income in Mountain Home
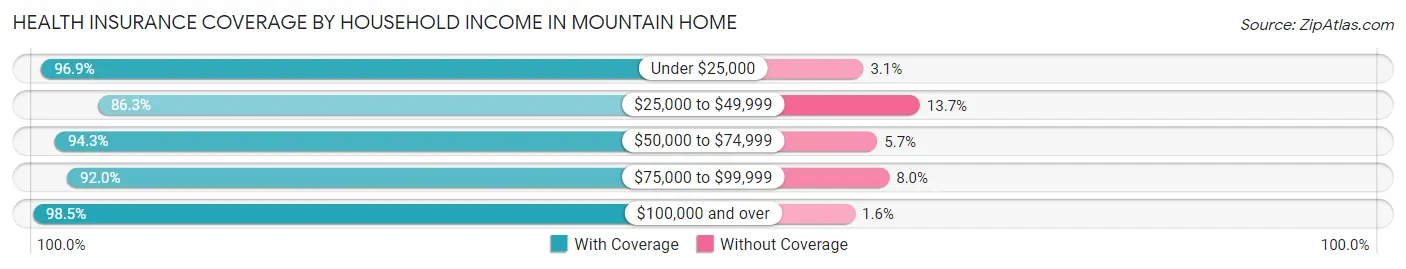
| Household Income | With Coverage | Without Coverage |
| Under $25,000 | 2,081 (96.9%) | 67 (3.1%) |
| $25,000 to $49,999 | 3,289 (86.3%) | 522 (13.7%) |
| $50,000 to $74,999 | 2,386 (94.3%) | 145 (5.7%) |
| $75,000 to $99,999 | 1,422 (92.0%) | 123 (8.0%) |
| $100,000 and over | 2,485 (98.5%) | 39 (1.5%) |
Public vs Private Health Insurance Coverage by Age in Mountain Home
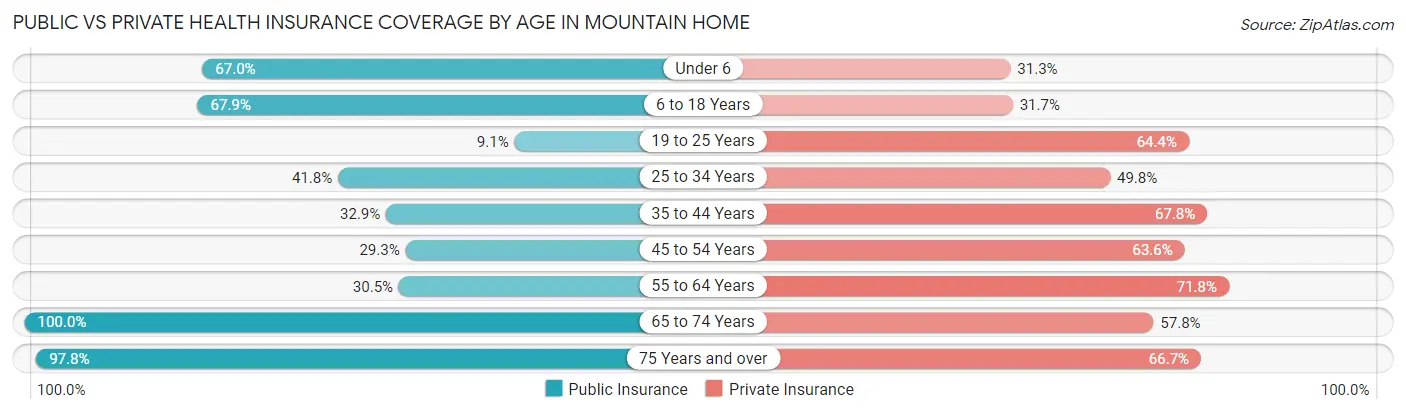
| Age Bracket | Public Insurance | Private Insurance |
| Under 6 | 548 (67.0%) | 256 (31.3%) |
| 6 to 18 Years | 1,196 (67.9%) | 559 (31.7%) |
| 19 to 25 Years | 122 (9.1%) | 866 (64.4%) |
| 25 to 34 Years | 603 (41.8%) | 718 (49.8%) |
| 35 to 44 Years | 430 (32.9%) | 886 (67.8%) |
| 45 to 54 Years | 351 (29.3%) | 762 (63.6%) |
| 55 to 64 Years | 402 (30.5%) | 946 (71.8%) |
| 65 to 74 Years | 1,333 (100.0%) | 771 (57.8%) |
| 75 Years and over | 2,030 (97.8%) | 1,383 (66.6%) |
| Total | 7,015 (55.7%) | 7,147 (56.7%) |
Disability Status by Sex by Age in Mountain Home
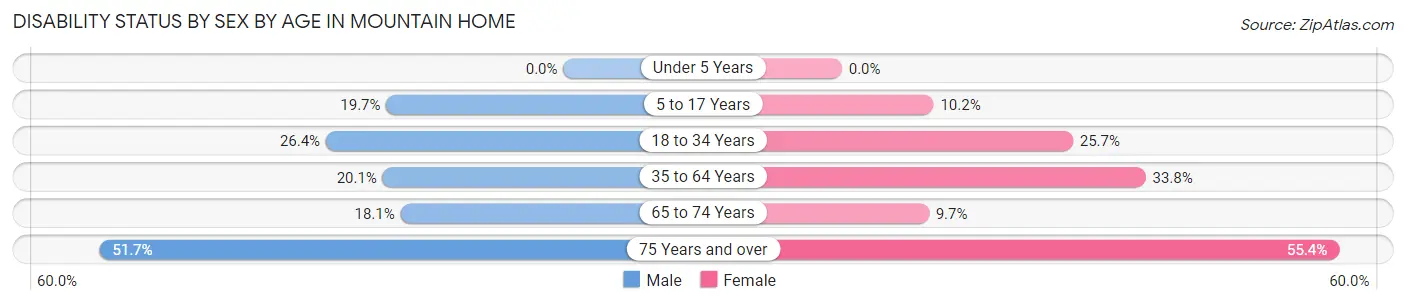
| Age Bracket | Male | Female |
| Under 5 Years | 0 (0.0%) | 0 (0.0%) |
| 5 to 17 Years | 221 (19.7%) | 84 (10.2%) |
| 18 to 34 Years | 409 (26.4%) | 319 (25.7%) |
| 35 to 64 Years | 349 (20.1%) | 706 (33.8%) |
| 65 to 74 Years | 105 (18.1%) | 73 (9.7%) |
| 75 Years and over | 433 (51.7%) | 685 (55.4%) |
Disability Class by Sex by Age in Mountain Home
Disability Class: Hearing Difficulty
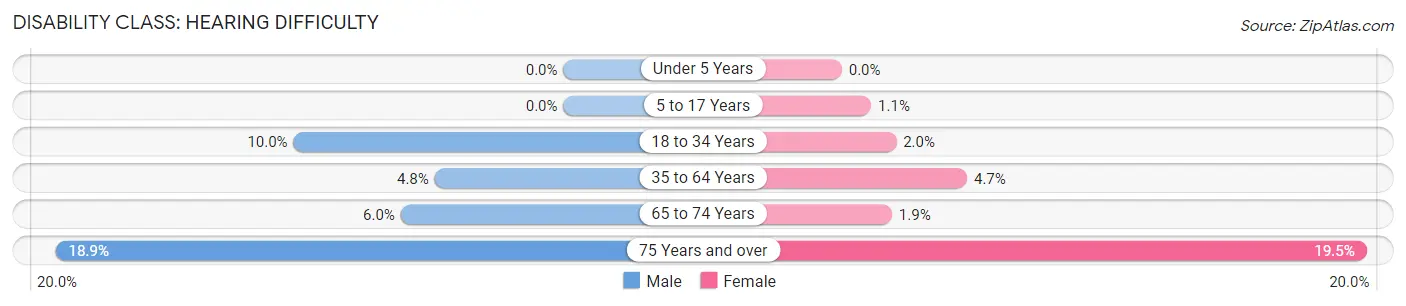
| Age Bracket | Male | Female |
| Under 5 Years | 0 (0.0%) | 0 (0.0%) |
| 5 to 17 Years | 0 (0.0%) | 9 (1.1%) |
| 18 to 34 Years | 155 (10.0%) | 25 (2.0%) |
| 35 to 64 Years | 83 (4.8%) | 97 (4.6%) |
| 65 to 74 Years | 35 (6.0%) | 14 (1.9%) |
| 75 Years and over | 158 (18.9%) | 241 (19.5%) |
Disability Class: Vision Difficulty
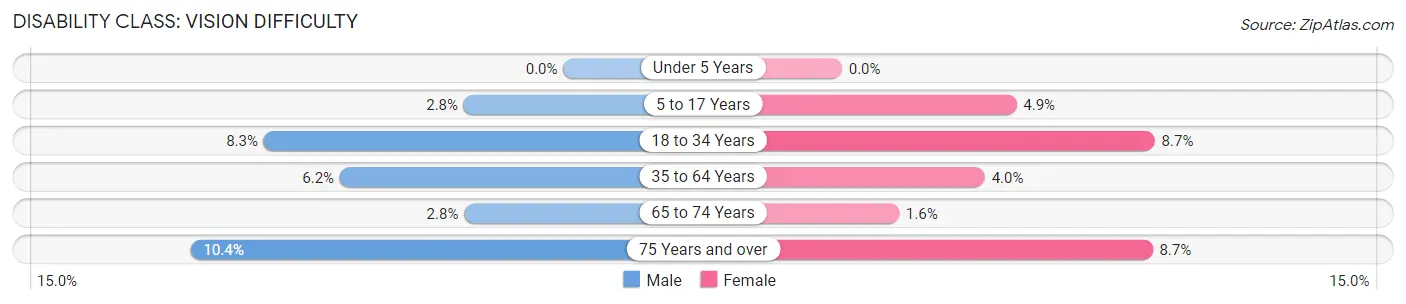
| Age Bracket | Male | Female |
| Under 5 Years | 0 (0.0%) | 0 (0.0%) |
| 5 to 17 Years | 31 (2.8%) | 40 (4.9%) |
| 18 to 34 Years | 129 (8.3%) | 108 (8.7%) |
| 35 to 64 Years | 108 (6.2%) | 83 (4.0%) |
| 65 to 74 Years | 16 (2.8%) | 12 (1.6%) |
| 75 Years and over | 87 (10.4%) | 107 (8.6%) |
Disability Class: Cognitive Difficulty
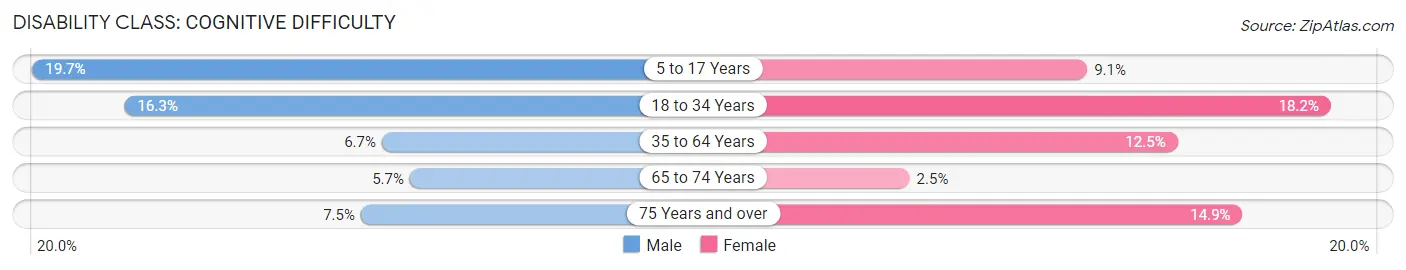
| Age Bracket | Male | Female |
| 5 to 17 Years | 221 (19.7%) | 75 (9.1%) |
| 18 to 34 Years | 252 (16.3%) | 225 (18.1%) |
| 35 to 64 Years | 117 (6.7%) | 260 (12.5%) |
| 65 to 74 Years | 33 (5.7%) | 19 (2.5%) |
| 75 Years and over | 63 (7.5%) | 184 (14.9%) |
Disability Class: Ambulatory Difficulty
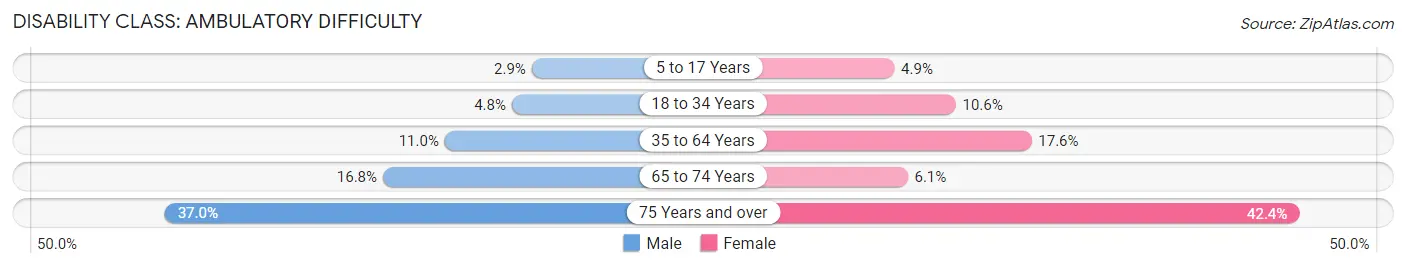
| Age Bracket | Male | Female |
| 5 to 17 Years | 33 (2.9%) | 40 (4.9%) |
| 18 to 34 Years | 74 (4.8%) | 131 (10.6%) |
| 35 to 64 Years | 191 (11.0%) | 367 (17.6%) |
| 65 to 74 Years | 97 (16.8%) | 46 (6.1%) |
| 75 Years and over | 310 (37.0%) | 525 (42.4%) |
Disability Class: Self-Care Difficulty
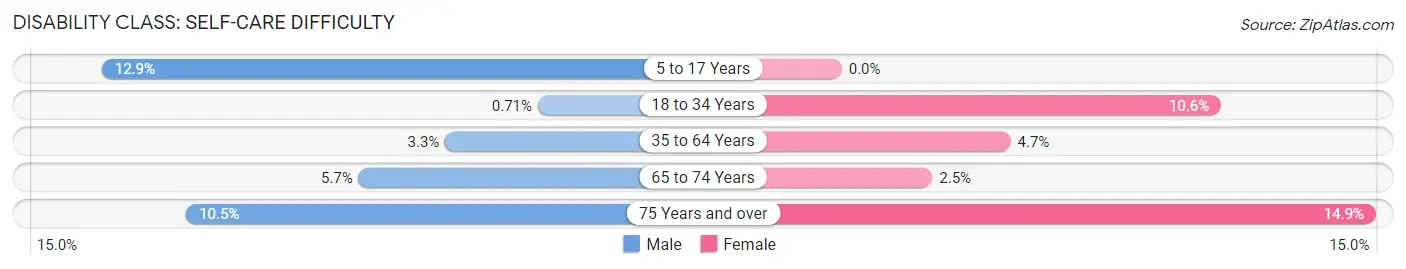
| Age Bracket | Male | Female |
| 5 to 17 Years | 144 (12.9%) | 0 (0.0%) |
| 18 to 34 Years | 11 (0.7%) | 131 (10.6%) |
| 35 to 64 Years | 57 (3.3%) | 98 (4.7%) |
| 65 to 74 Years | 33 (5.7%) | 19 (2.5%) |
| 75 Years and over | 88 (10.5%) | 184 (14.9%) |
Technology Access in Mountain Home
Computing Device Access in Mountain Home
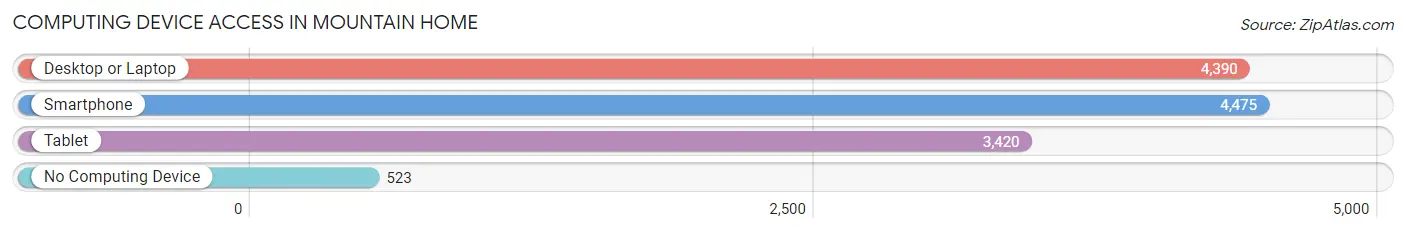
| Device Type | # Households | % Households |
| Desktop or Laptop | 4,390 | 73.4% |
| Smartphone | 4,475 | 74.9% |
| Tablet | 3,420 | 57.2% |
| No Computing Device | 523 | 8.7% |
| Total | 5,979 | 100.0% |
Internet Access in Mountain Home
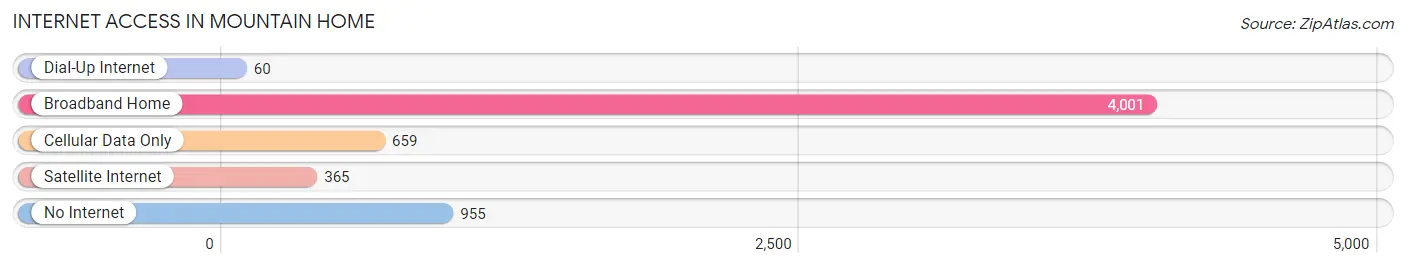
| Internet Type | # Households | % Households |
| Dial-Up Internet | 60 | 1.0% |
| Broadband Home | 4,001 | 66.9% |
| Cellular Data Only | 659 | 11.0% |
| Satellite Internet | 365 | 6.1% |
| No Internet | 955 | 16.0% |
| Total | 5,979 | 100.0% |
Mountain Home Summary
Mountain Home, Arkansas is a city located in Baxter County in the northern part of the state. It is the county seat and the largest city in the county. The city is situated in the Ozark Mountains and is known for its beautiful scenery and outdoor activities. The population of Mountain Home was 12,448 in the 2010 census.
Geography
Mountain Home is located in the Ozark Mountains of northern Arkansas. The city is situated in the foothills of the Ozarks and is surrounded by the White River, the North Fork River, and the Buffalo River. The city is located at an elevation of 1,072 feet above sea level. The city has a total area of 8.3 square miles, of which 8.2 square miles is land and 0.1 square miles is water.
Climate
Mountain Home has a humid subtropical climate with hot, humid summers and mild winters. The average annual temperature is 61.3°F, with an average high of 79.2°F in July and an average low of 43.4°F in January. The average annual precipitation is 48.2 inches, with an average of 4.2 inches of snowfall per year.
Demographics
As of the 2010 census, the population of Mountain Home was 12,448. The racial makeup of the city was 92.3% White, 0.7% African American, 0.7% Native American, 0.7% Asian, 0.1% Pacific Islander, 3.3% from other races, and 2.2% from two or more races. Hispanic or Latino of any race were 6.2% of the population.
Economy
Mountain Home is the economic center of Baxter County. The city is home to several major employers, including Baxter Regional Medical Center, Baxter County Courthouse, and Arkansas State University Mountain Home. The city is also home to several manufacturing companies, including Baxter Laboratories, Baxter Manufacturing, and Baxter Plastics.
The city is also home to several retail stores, restaurants, and other businesses. The city is served by the Mountain Home Municipal Airport, which provides air service to the surrounding area.
History
Mountain Home was founded in 1856 by settlers from Tennessee and Missouri. The city was named for its location in the foothills of the Ozark Mountains. The city was incorporated in 1873 and has grown steadily since then.
In the early 20th century, the city was a major center for timber production and sawmills. The city was also home to several large manufacturing companies, including Baxter Laboratories and Baxter Manufacturing.
In the late 20th century, the city began to diversify its economy and attract new businesses. The city is now home to several major employers, including Baxter Regional Medical Center, Baxter County Courthouse, and Arkansas State University Mountain Home.
Conclusion
Mountain Home, Arkansas is a city located in Baxter County in the northern part of the state. It is the county seat and the largest city in the county. The city is situated in the Ozark Mountains and is known for its beautiful scenery and outdoor activities. The population of Mountain Home was 12,448 in the 2010 census. The city has a humid subtropical climate with hot, humid summers and mild winters. The city is home to several major employers, including Baxter Regional Medical Center, Baxter County Courthouse, and Arkansas State University Mountain Home. The city is also home to several manufacturing companies, retail stores, restaurants, and other businesses. Mountain Home was founded in 1856 and has grown steadily since then. The city is now a major economic center in the region and is home to several major employers.
Common Questions
What is the Total Population of Mountain Home?
Total Population of Mountain Home is 12,876.
What is the Total Male Population of Mountain Home?
Total Male Population of Mountain Home is 6,253.
What is the Total Female Population of Mountain Home?
Total Female Population of Mountain Home is 6,623.
What is the Ratio of Males per 100 Females in Mountain Home?
There are 94.41 Males per 100 Females in Mountain Home.
What is the Ratio of Females per 100 Males in Mountain Home?
There are 105.92 Females per 100 Males in Mountain Home.
What is the Median Population Age in Mountain Home?
Median Population Age in Mountain Home is 41.8 Years.
What is the Average Family Size in Mountain Home
Average Family Size in Mountain Home is 3.0 People.
What is the Average Household Size in Mountain Home
Average Household Size in Mountain Home is 2.1 People.
What is Per Capita Income in Mountain Home?
Per Capita income in Mountain Home is $30,884.
What is the Median Family Income in Mountain Home?
Median Family Income in Mountain Home is $59,720.
What is the Median Household income in Mountain Home?
Median Household Income in Mountain Home is $42,281.
What is Income or Wage Gap in Mountain Home?
Income or Wage Gap in Mountain Home is 17.7%.
Women in Mountain Home earn 82.3 cents for every dollar earned by a man.
What is Family Income Deficit in Mountain Home?
Family Income Deficit in Mountain Home is $8,655.
Families that are below poverty line in Mountain Home earn $8,655 less on average than the poverty threshold level.
What is Inequality or Gini Index in Mountain Home?
Inequality or Gini Index in Mountain Home is 0.48.
How Large is the Labor Force in Mountain Home?
There are 5,300 People in the Labor Forcein in Mountain Home.
What is the Percentage of People in the Labor Force in Mountain Home?
49.5% of People are in the Labor Force in Mountain Home.
What is the Unemployment Rate in Mountain Home?
Unemployment Rate in Mountain Home is 6.6%.