Stuttgart, AR
Stuttgart Map
Stuttgart Overview
8,189
TOTAL POPULATION
3,858
MALE POPULATION
4,331
FEMALE POPULATION
89.08
MALES / 100 FEMALES
112.26
FEMALES / 100 MALES
37.8
MEDIAN AGE
3.3
AVG FAMILY SIZE
2.6
AVG HOUSEHOLD SIZE
$26,210
PER CAPITA INCOME
$70,729
AVG FAMILY INCOME
$59,124
AVG HOUSEHOLD INCOME
45.3%
WAGE / INCOME GAP [ % ]
54.7¢/ $1
WAGE / INCOME GAP [ $ ]
0.43
INEQUALITY / GINI INDEX
3,684
LABOR FORCE [ PEOPLE ]
58.1%
PERCENT IN LABOR FORCE
8.7%
UNEMPLOYMENT RATE
Stuttgart Zip Codes
Stuttgart Area Codes
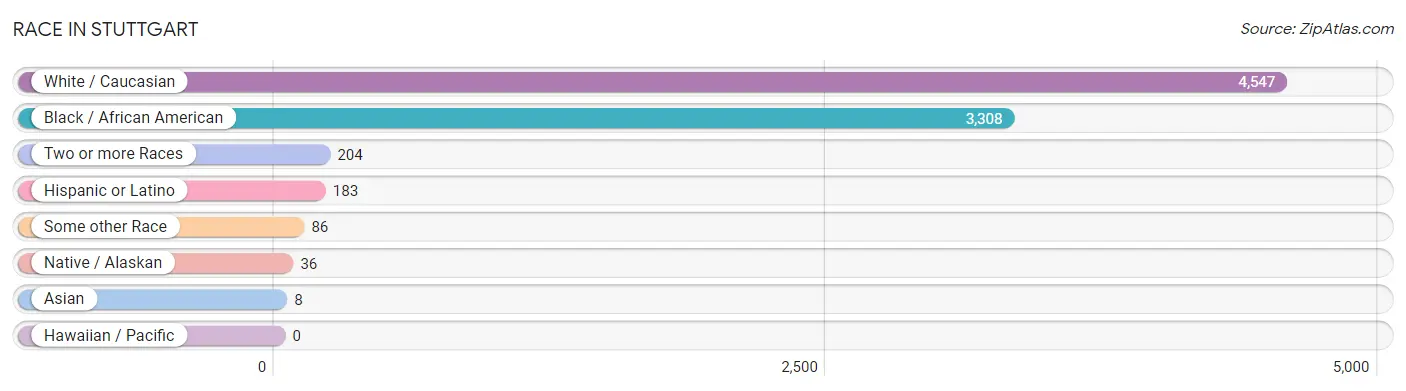
Race in Stuttgart
The most populous races in Stuttgart are White / Caucasian (4,547 | 55.5%), Black / African American (3,308 | 40.4%), and Two or more Races (204 | 2.5%).
| Race | # Population | % Population |
| Asian | 8 | 0.1% |
| Black / African American | 3,308 | 40.4% |
| Hawaiian / Pacific | 0 | 0.0% |
| Hispanic or Latino | 183 | 2.2% |
| Native / Alaskan | 36 | 0.4% |
| White / Caucasian | 4,547 | 55.5% |
| Two or more Races | 204 | 2.5% |
| Some other Race | 86 | 1.1% |
| Total | 8,189 | 100.0% |
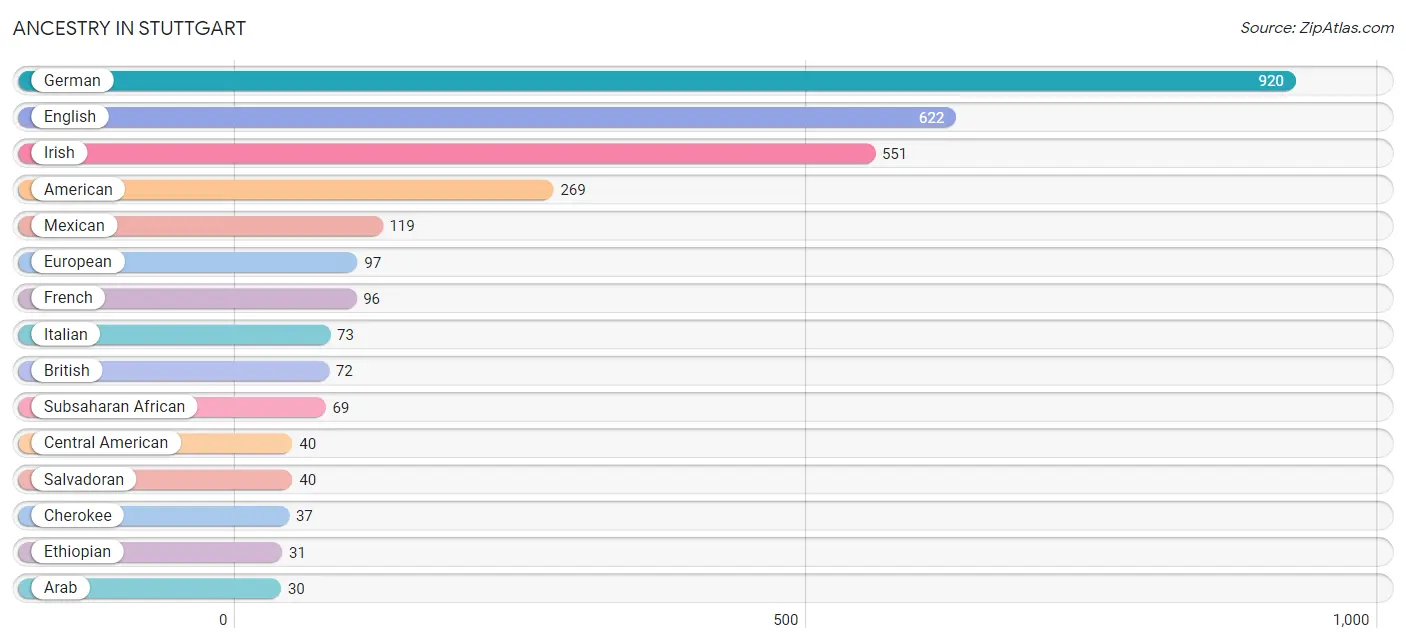
Ancestry in Stuttgart
The most populous ancestries reported in Stuttgart are German (920 | 11.2%), English (622 | 7.6%), Irish (551 | 6.7%), American (269 | 3.3%), and Mexican (119 | 1.5%), together accounting for 30.3% of all Stuttgart residents.
| Ancestry | # Population | % Population |
| African | 28 | 0.3% |
| American | 269 | 3.3% |
| Arab | 30 | 0.4% |
| British | 72 | 0.9% |
| Cajun | 22 | 0.3% |
| Central American | 40 | 0.5% |
| Cherokee | 37 | 0.4% |
| Chippewa | 6 | 0.1% |
| Choctaw | 22 | 0.3% |
| Czechoslovakian | 7 | 0.1% |
| Danish | 6 | 0.1% |
| Dutch | 17 | 0.2% |
| English | 622 | 7.6% |
| Ethiopian | 31 | 0.4% |
| European | 97 | 1.2% |
| French | 96 | 1.2% |
| French Canadian | 4 | 0.1% |
| German | 920 | 11.2% |
| Greek | 15 | 0.2% |
| Indian (Asian) | 6 | 0.1% |
| Irish | 551 | 6.7% |
| Italian | 73 | 0.9% |
| Lebanese | 30 | 0.4% |
| Mexican | 119 | 1.5% |
| Nigerian | 10 | 0.1% |
| Norwegian | 16 | 0.2% |
| Polish | 18 | 0.2% |
| Salvadoran | 40 | 0.5% |
| Scotch-Irish | 20 | 0.2% |
| Scottish | 15 | 0.2% |
| Slovak | 15 | 0.2% |
| Subsaharan African | 69 | 0.8% |
| Swedish | 6 | 0.1% |
| Thai | 2 | 0.0% |
| Welsh | 9 | 0.1% | View All 35 Rows |
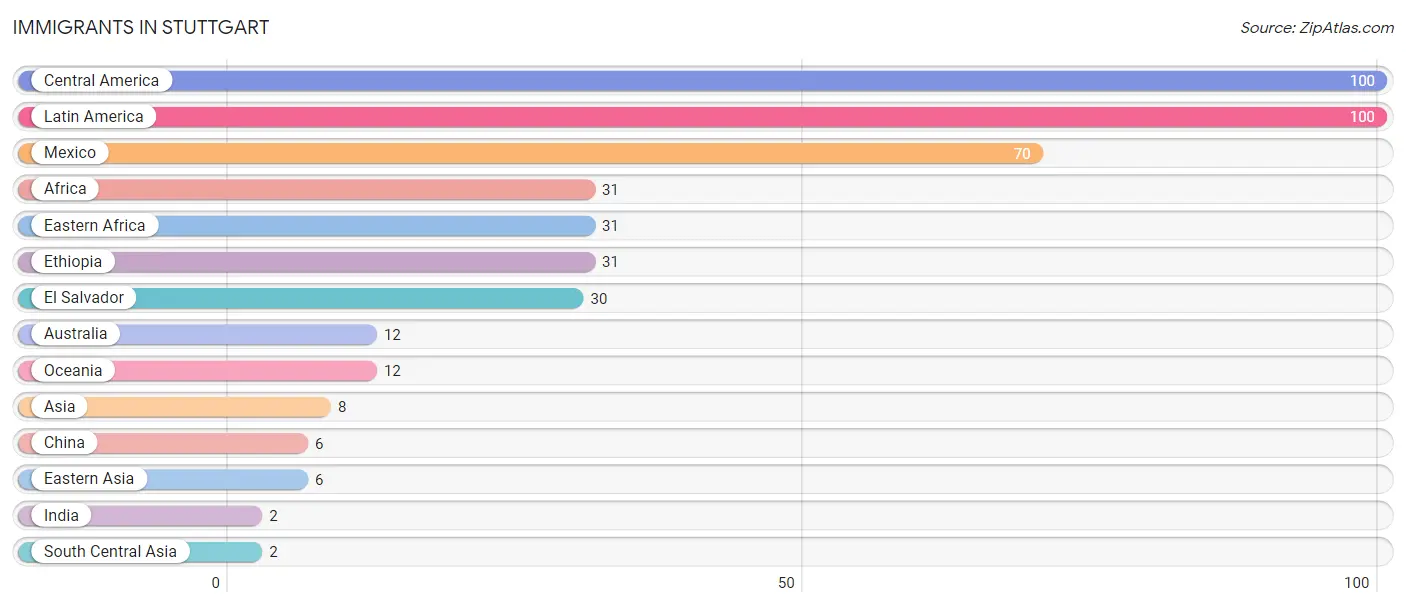
Immigrants in Stuttgart
The most numerous immigrant groups reported in Stuttgart came from Central America (100 | 1.2%), Latin America (100 | 1.2%), Mexico (70 | 0.9%), Africa (31 | 0.4%), and Eastern Africa (31 | 0.4%), together accounting for 4.0% of all Stuttgart residents.
| Immigration Origin | # Population | % Population |
| Africa | 31 | 0.4% |
| Asia | 8 | 0.1% |
| Australia | 12 | 0.2% |
| Central America | 100 | 1.2% |
| China | 6 | 0.1% |
| Eastern Africa | 31 | 0.4% |
| Eastern Asia | 6 | 0.1% |
| El Salvador | 30 | 0.4% |
| Ethiopia | 31 | 0.4% |
| India | 2 | 0.0% |
| Latin America | 100 | 1.2% |
| Mexico | 70 | 0.9% |
| Oceania | 12 | 0.2% |
| South Central Asia | 2 | 0.0% | View All 14 Rows |
Sex and Age in Stuttgart
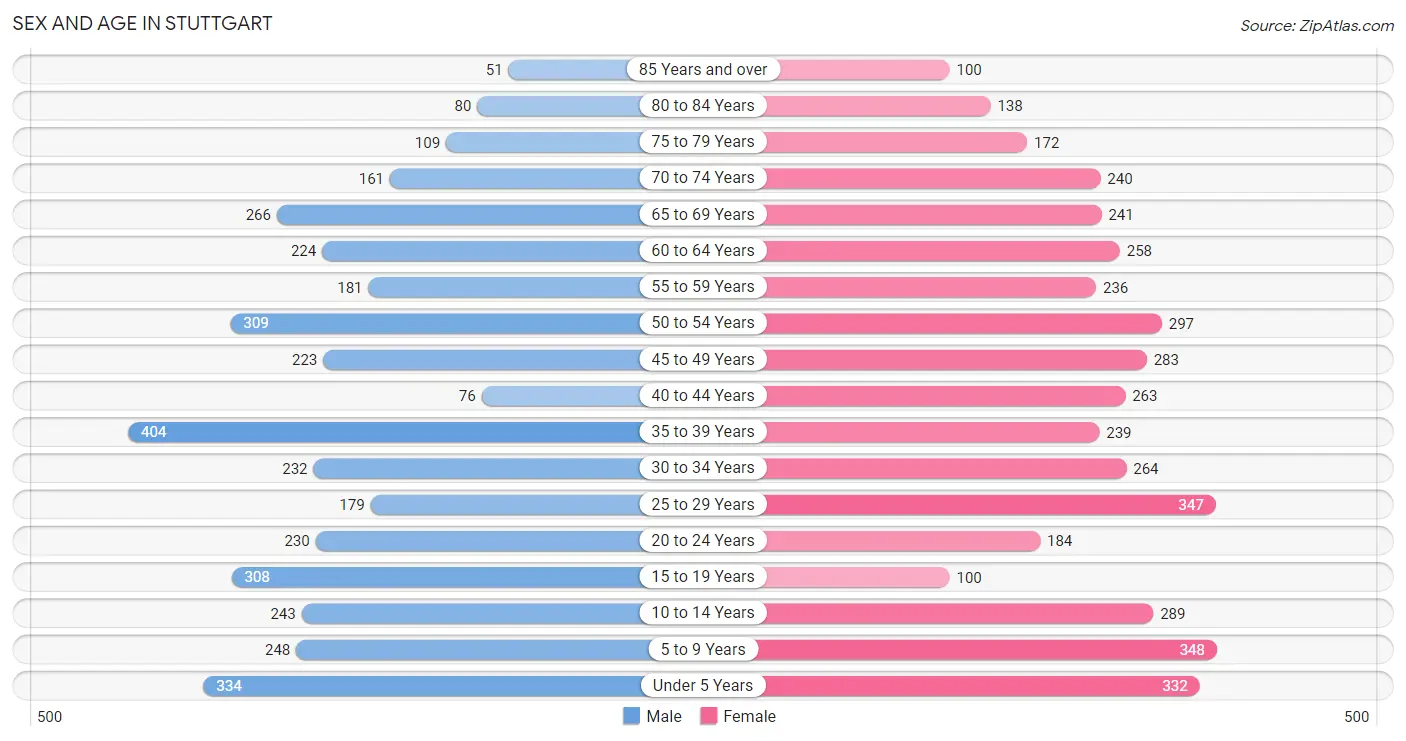
Sex and Age in Stuttgart
The most populous age groups in Stuttgart are 35 to 39 Years (404 | 10.5%) for men and 5 to 9 Years (348 | 8.0%) for women.
| Age Bracket | Male | Female |
| Under 5 Years | 334 (8.7%) | 332 (7.7%) |
| 5 to 9 Years | 248 (6.4%) | 348 (8.0%) |
| 10 to 14 Years | 243 (6.3%) | 289 (6.7%) |
| 15 to 19 Years | 308 (8.0%) | 100 (2.3%) |
| 20 to 24 Years | 230 (6.0%) | 184 (4.3%) |
| 25 to 29 Years | 179 (4.6%) | 347 (8.0%) |
| 30 to 34 Years | 232 (6.0%) | 264 (6.1%) |
| 35 to 39 Years | 404 (10.5%) | 239 (5.5%) |
| 40 to 44 Years | 76 (2.0%) | 263 (6.1%) |
| 45 to 49 Years | 223 (5.8%) | 283 (6.5%) |
| 50 to 54 Years | 309 (8.0%) | 297 (6.9%) |
| 55 to 59 Years | 181 (4.7%) | 236 (5.4%) |
| 60 to 64 Years | 224 (5.8%) | 258 (6.0%) |
| 65 to 69 Years | 266 (6.9%) | 241 (5.6%) |
| 70 to 74 Years | 161 (4.2%) | 240 (5.5%) |
| 75 to 79 Years | 109 (2.8%) | 172 (4.0%) |
| 80 to 84 Years | 80 (2.1%) | 138 (3.2%) |
| 85 Years and over | 51 (1.3%) | 100 (2.3%) |
| Total | 3,858 (100.0%) | 4,331 (100.0%) |
Families and Households in Stuttgart
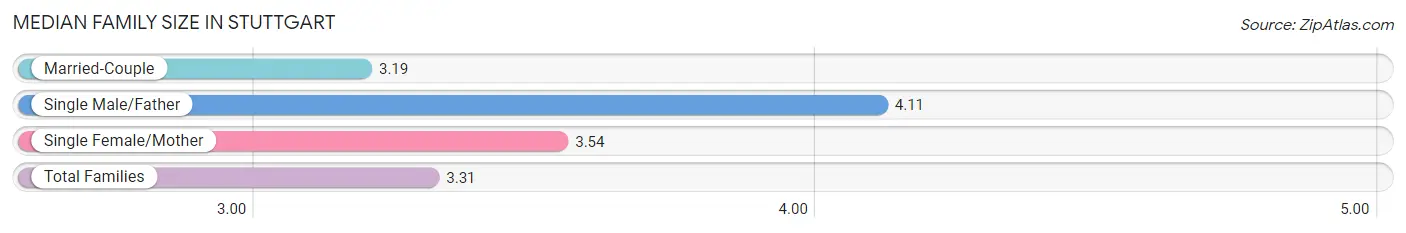
Median Family Size in Stuttgart
The median family size in Stuttgart is 3.31 persons per family, with single male/father families (127 | 6.6%) accounting for the largest median family size of 4.11 persons per family. On the other hand, married-couple families (1,469 | 75.8%) represent the smallest median family size with 3.19 persons per family.
| Family Type | # Families | Family Size |
| Married-Couple | 1,469 (75.8%) | 3.19 |
| Single Male/Father | 127 (6.6%) | 4.11 |
| Single Female/Mother | 341 (17.6%) | 3.54 |
| Total Families | 1,937 (100.0%) | 3.31 |
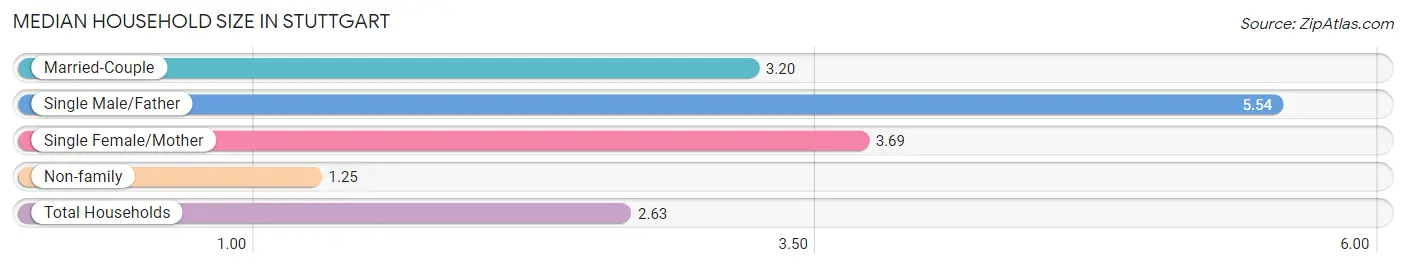
Median Household Size in Stuttgart
The median household size in Stuttgart is 2.63 persons per household, with single male/father households (127 | 4.1%) accounting for the largest median household size of 5.54 persons per household. non-family households (1,138 | 37.0%) represent the smallest median household size with 1.25 persons per household.
| Household Type | # Households | Household Size |
| Married-Couple | 1,469 (47.8%) | 3.20 |
| Single Male/Father | 127 (4.1%) | 5.54 |
| Single Female/Mother | 341 (11.1%) | 3.69 |
| Non-family | 1,138 (37.0%) | 1.25 |
| Total Households | 3,075 (100.0%) | 2.63 |
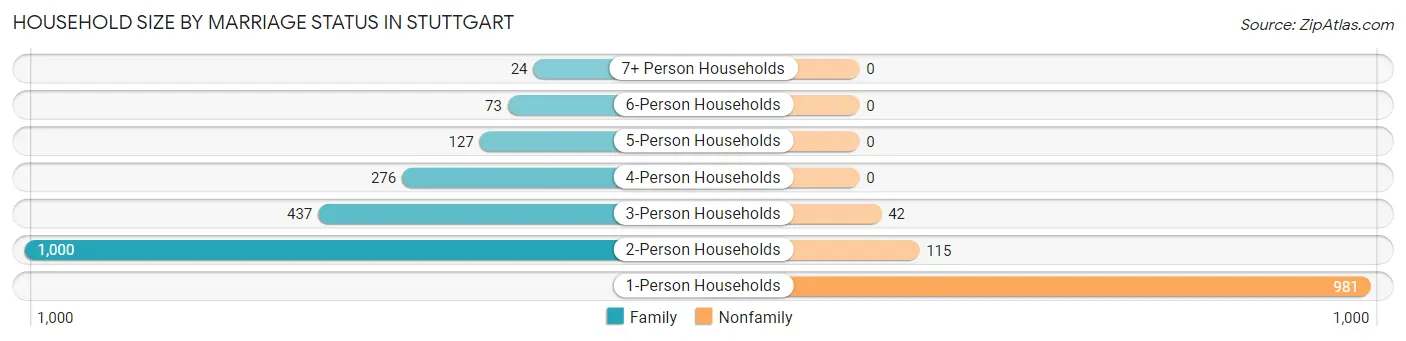
Household Size by Marriage Status in Stuttgart
Out of a total of 3,075 households in Stuttgart, 1,937 (63.0%) are family households, while 1,138 (37.0%) are nonfamily households. The most numerous type of family households are 2-person households, comprising 1,000, and the most common type of nonfamily households are 1-person households, comprising 981.
| Household Size | Family Households | Nonfamily Households |
| 1-Person Households | - | 981 (31.9%) |
| 2-Person Households | 1,000 (32.5%) | 115 (3.7%) |
| 3-Person Households | 437 (14.2%) | 42 (1.4%) |
| 4-Person Households | 276 (9.0%) | 0 (0.0%) |
| 5-Person Households | 127 (4.1%) | 0 (0.0%) |
| 6-Person Households | 73 (2.4%) | 0 (0.0%) |
| 7+ Person Households | 24 (0.8%) | 0 (0.0%) |
| Total | 1,937 (63.0%) | 1,138 (37.0%) |
Female Fertility in Stuttgart
Fertility by Age in Stuttgart
Average fertility rate in Stuttgart is 82.0 births per 1,000 women. Women in the age bracket of 20 to 34 years have the highest fertility rate with 145.0 births per 1,000 women. Women in the age bracket of 20 to 34 years acount for 80.4% of all women with births.
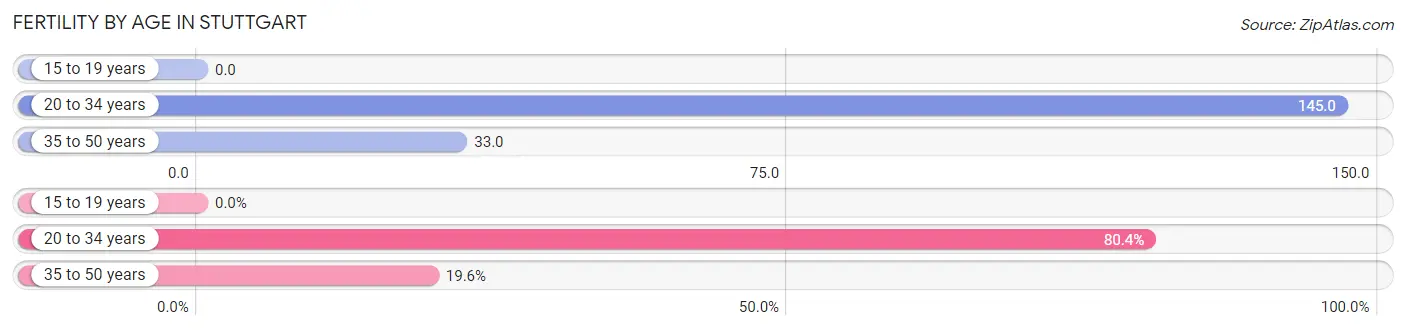
| Age Bracket | Women with Births | Births / 1,000 Women |
| 15 to 19 years | 0 (0.0%) | 0.0 |
| 20 to 34 years | 115 (80.4%) | 145.0 |
| 35 to 50 years | 28 (19.6%) | 33.0 |
| Total | 143 (100.0%) | 82.0 |
Fertility by Age by Marriage Status in Stuttgart
83.9% of women with births (143) in Stuttgart are married. The highest percentage of unmarried women with births falls into 35 to 50 years age bracket with 25.0% of them unmarried at the time of birth, while the lowest percentage of unmarried women with births belong to 20 to 34 years age bracket with 13.9% of them unmarried.
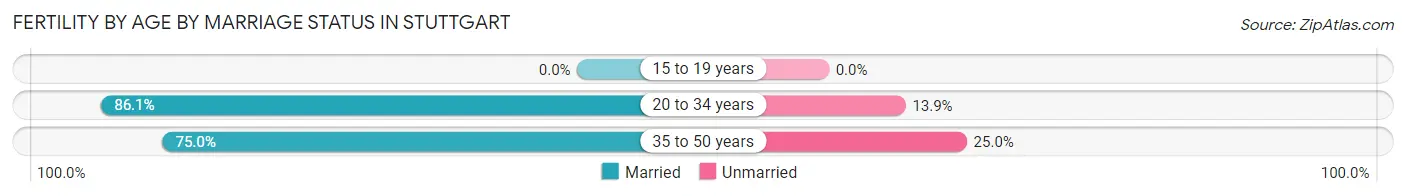
| Age Bracket | Married | Unmarried |
| 15 to 19 years | 0 (0.0%) | 0 (0.0%) |
| 20 to 34 years | 99 (86.1%) | 16 (13.9%) |
| 35 to 50 years | 21 (75.0%) | 7 (25.0%) |
| Total | 120 (83.9%) | 23 (16.1%) |
Fertility by Education in Stuttgart
Average fertility rate in Stuttgart is 82.0 births per 1,000 women. Women with the education attainment of graduate degree have the highest fertility rate of 325.0 births per 1,000 women, while women with the education attainment of less than high school have the lowest fertility at 30.0 births per 1,000 women. Women with the education attainment of college or associate's degree represent 48.9% of all women with births.
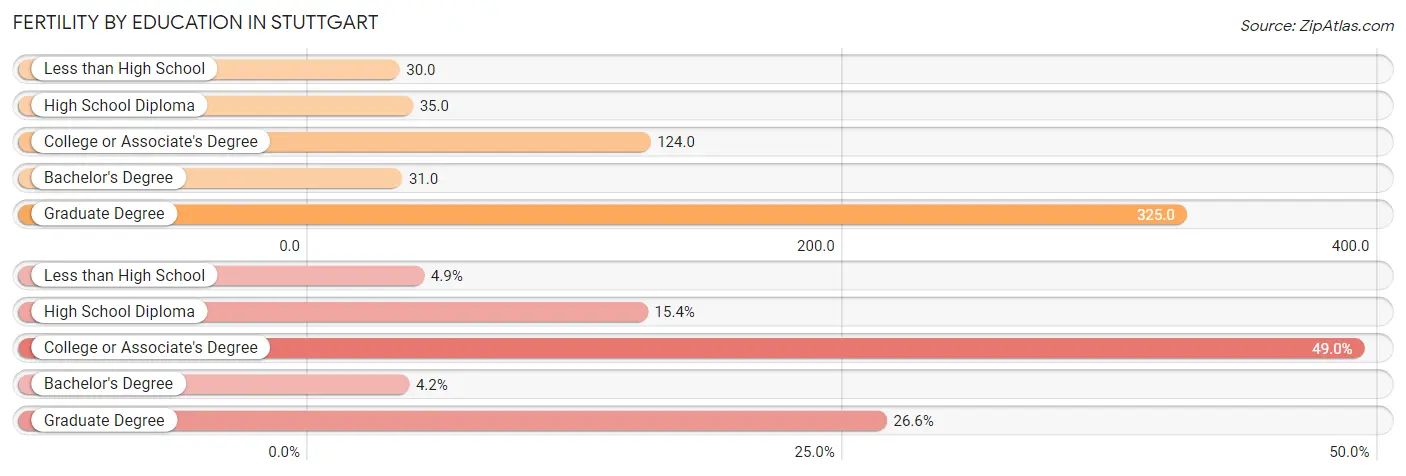
| Educational Attainment | Women with Births | Births / 1,000 Women |
| Less than High School | 7 (4.9%) | 30.0 |
| High School Diploma | 22 (15.4%) | 35.0 |
| College or Associate's Degree | 70 (48.9%) | 124.0 |
| Bachelor's Degree | 6 (4.2%) | 31.0 |
| Graduate Degree | 38 (26.6%) | 325.0 |
| Total | 143 (100.0%) | 82.0 |
Fertility by Education by Marriage Status in Stuttgart
16.1% of women with births in Stuttgart are unmarried. Women with the educational attainment of college or associate's degree are most likely to be married with 100.0% of them married at childbirth, while women with the educational attainment of less than high school are least likely to be married with 100.0% of them unmarried at childbirth.
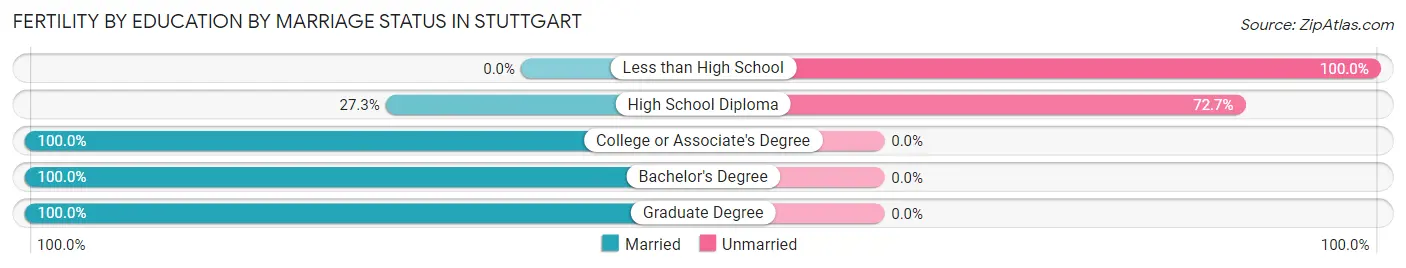
| Educational Attainment | Married | Unmarried |
| Less than High School | 0 (0.0%) | 7 (100.0%) |
| High School Diploma | 6 (27.3%) | 16 (72.7%) |
| College or Associate's Degree | 70 (100.0%) | 0 (0.0%) |
| Bachelor's Degree | 6 (100.0%) | 0 (0.0%) |
| Graduate Degree | 38 (100.0%) | 0 (0.0%) |
| Total | 120 (83.9%) | 23 (16.1%) |
Income in Stuttgart
Income Overview in Stuttgart
Per Capita Income in Stuttgart is $26,210, while median incomes of families and households are $70,729 and $59,124 respectively.
| Characteristic | Number | Measure |
| Per Capita Income | 8,189 | $26,210 |
| Median Family Income | 1,937 | $70,729 |
| Mean Family Income | 1,937 | $81,526 |
| Median Household Income | 3,075 | $59,124 |
| Mean Household Income | 3,075 | $66,083 |
| Income Deficit | 1,937 | $0 |
| Wage / Income Gap (%) | 8,189 | 45.29% |
| Wage / Income Gap ($) | 8,189 | 54.71¢ per $1 |
| Gini / Inequality Index | 8,189 | 0.43 |
Earnings by Sex in Stuttgart
Average Earnings in Stuttgart are $32,816, $44,769 for men and $24,493 for women, a difference of 45.3%.
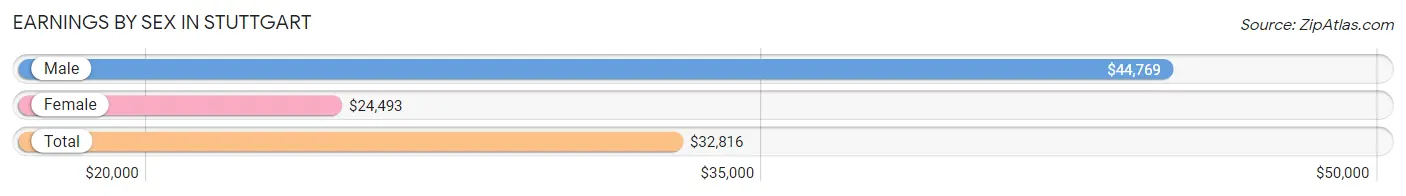
| Sex | Number | Average Earnings |
| Male | 2,005 (50.9%) | $44,769 |
| Female | 1,932 (49.1%) | $24,493 |
| Total | 3,937 (100.0%) | $32,816 |
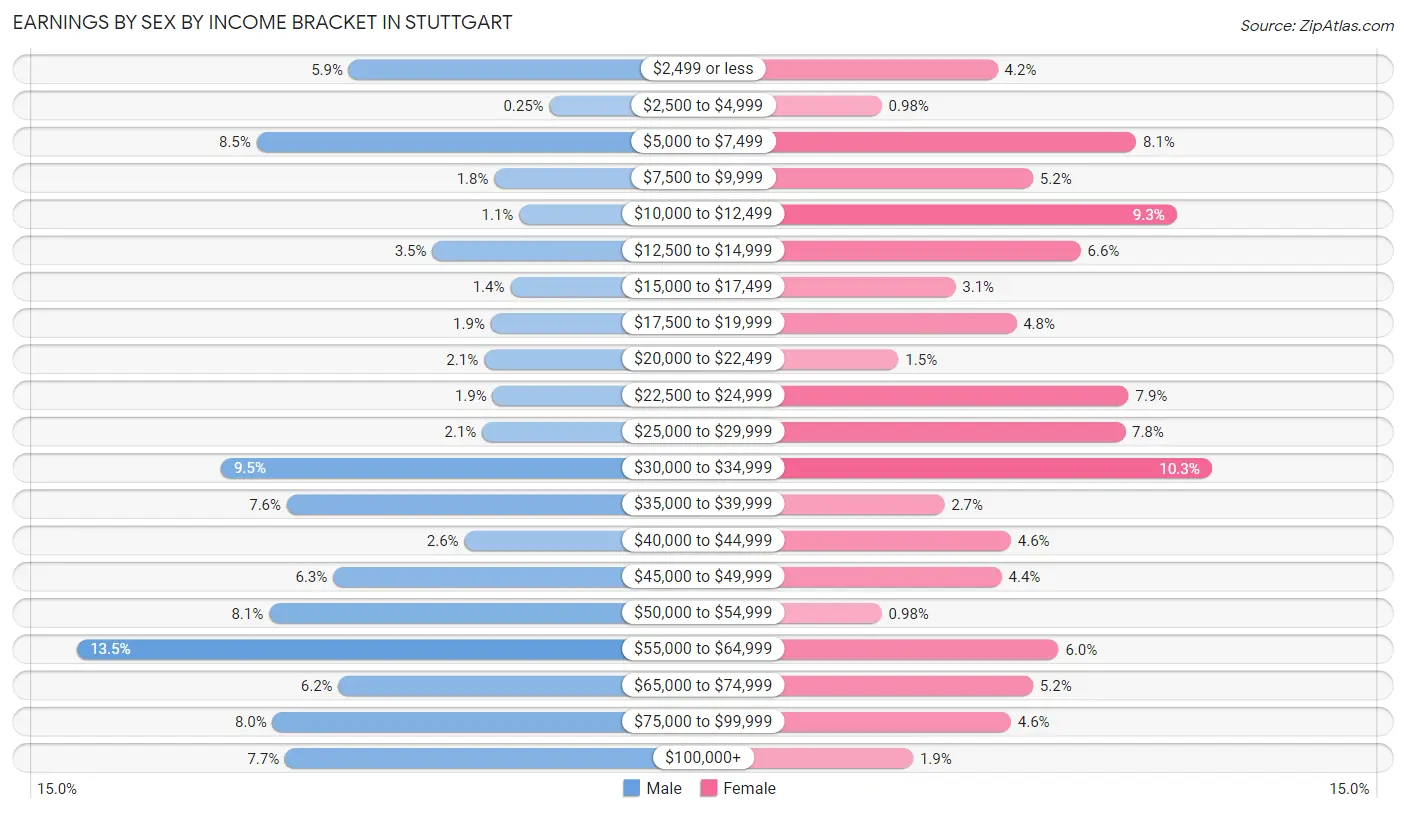
Earnings by Sex by Income Bracket in Stuttgart
The most common earnings brackets in Stuttgart are $55,000 to $64,999 for men (271 | 13.5%) and $30,000 to $34,999 for women (198 | 10.2%).
| Income | Male | Female |
| $2,499 or less | 118 (5.9%) | 82 (4.2%) |
| $2,500 to $4,999 | 5 (0.3%) | 19 (1.0%) |
| $5,000 to $7,499 | 170 (8.5%) | 157 (8.1%) |
| $7,500 to $9,999 | 36 (1.8%) | 101 (5.2%) |
| $10,000 to $12,499 | 22 (1.1%) | 179 (9.3%) |
| $12,500 to $14,999 | 71 (3.5%) | 127 (6.6%) |
| $15,000 to $17,499 | 27 (1.3%) | 59 (3.0%) |
| $17,500 to $19,999 | 38 (1.9%) | 92 (4.8%) |
| $20,000 to $22,499 | 42 (2.1%) | 28 (1.5%) |
| $22,500 to $24,999 | 37 (1.8%) | 153 (7.9%) |
| $25,000 to $29,999 | 43 (2.1%) | 151 (7.8%) |
| $30,000 to $34,999 | 190 (9.5%) | 198 (10.2%) |
| $35,000 to $39,999 | 153 (7.6%) | 53 (2.7%) |
| $40,000 to $44,999 | 53 (2.6%) | 89 (4.6%) |
| $45,000 to $49,999 | 127 (6.3%) | 84 (4.3%) |
| $50,000 to $54,999 | 163 (8.1%) | 19 (1.0%) |
| $55,000 to $64,999 | 271 (13.5%) | 115 (5.9%) |
| $65,000 to $74,999 | 124 (6.2%) | 101 (5.2%) |
| $75,000 to $99,999 | 161 (8.0%) | 89 (4.6%) |
| $100,000+ | 154 (7.7%) | 36 (1.9%) |
| Total | 2,005 (100.0%) | 1,932 (100.0%) |
Earnings by Sex by Educational Attainment in Stuttgart
Average earnings in Stuttgart are $51,296 for men and $27,188 for women, a difference of 47.0%. Men with an educational attainment of bachelor's degree enjoy the highest average annual earnings of $61,875, while those with college or associate's degree education earn the least with $46,667. Women with an educational attainment of graduate degree earn the most with the average annual earnings of $64,063, while those with less than high school education have the smallest earnings of $6,652.
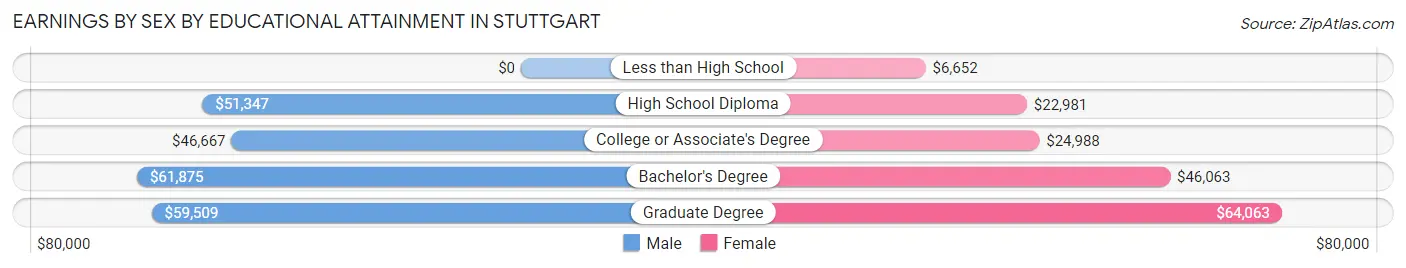
| Educational Attainment | Male Income | Female Income |
| Less than High School | - | - |
| High School Diploma | $51,347 | $22,981 |
| College or Associate's Degree | $46,667 | $24,988 |
| Bachelor's Degree | $61,875 | $46,063 |
| Graduate Degree | $59,509 | $64,063 |
| Total | $51,296 | $27,188 |
Family Income in Stuttgart
Family Income Brackets in Stuttgart
According to the Stuttgart family income data, there are 447 families falling into the $50,000 to $74,999 income range, which is the most common income bracket and makes up 23.1% of all families. Conversely, the $200,000+ income bracket is the least frequent group with only 56 families (2.9%) belonging to this category.
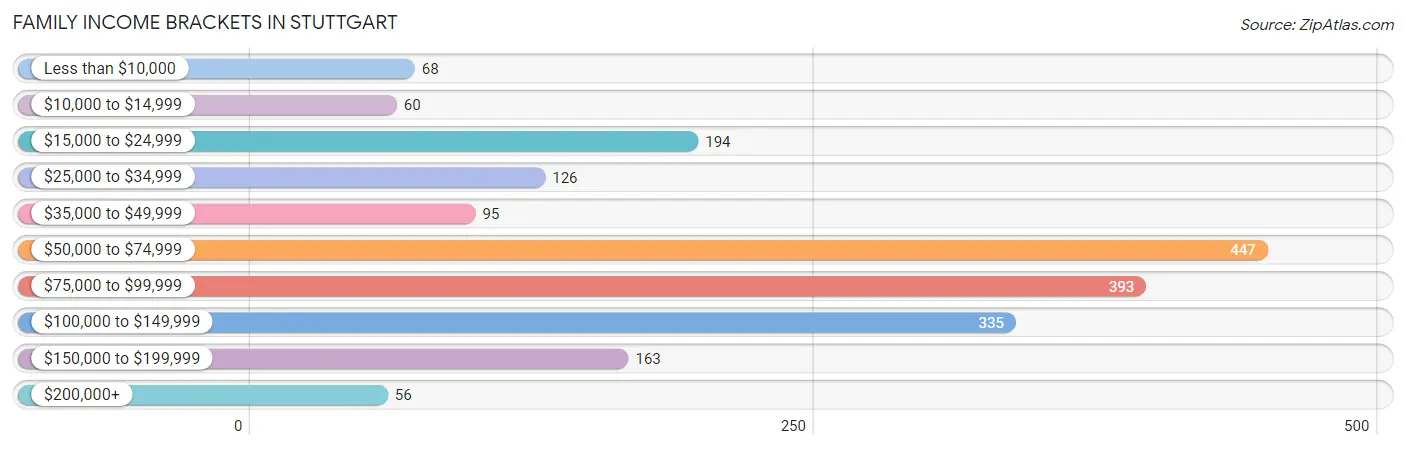
| Income Bracket | # Families | % Families |
| Less than $10,000 | 68 | 3.5% |
| $10,000 to $14,999 | 60 | 3.1% |
| $15,000 to $24,999 | 194 | 10.0% |
| $25,000 to $34,999 | 126 | 6.5% |
| $35,000 to $49,999 | 95 | 4.9% |
| $50,000 to $74,999 | 447 | 23.1% |
| $75,000 to $99,999 | 393 | 20.3% |
| $100,000 to $149,999 | 335 | 17.3% |
| $150,000 to $199,999 | 163 | 8.4% |
| $200,000+ | 56 | 2.9% |
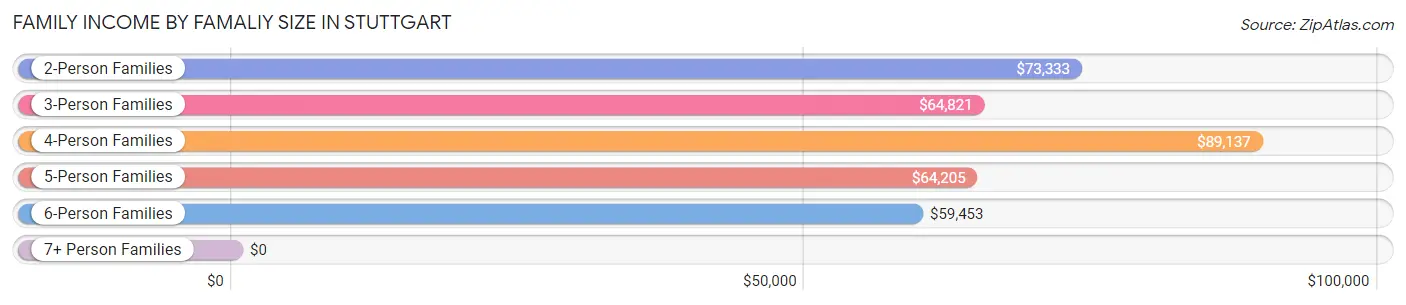
Family Income by Famaliy Size in Stuttgart
4-person families (229 | 11.8%) account for the highest median family income in Stuttgart with $89,137 per family, while 2-person families (1,030 | 53.2%) have the highest median income of $36,666 per family member.
| Income Bracket | # Families | Median Income |
| 2-Person Families | 1,030 (53.2%) | $73,333 |
| 3-Person Families | 467 (24.1%) | $64,821 |
| 4-Person Families | 229 (11.8%) | $89,137 |
| 5-Person Families | 127 (6.6%) | $64,205 |
| 6-Person Families | 75 (3.9%) | $59,453 |
| 7+ Person Families | 9 (0.5%) | $0 |
| Total | 1,937 (100.0%) | $70,729 |
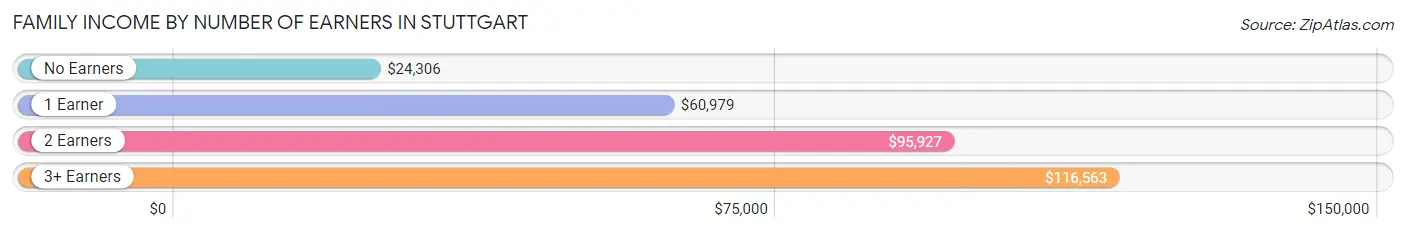
Family Income by Number of Earners in Stuttgart
The median family income in Stuttgart is $70,729, with families comprising 3+ earners (117) having the highest median family income of $116,563, while families with no earners (408) have the lowest median family income of $24,306, accounting for 6.0% and 21.1% of families, respectively.
| Number of Earners | # Families | Median Income |
| No Earners | 408 (21.1%) | $24,306 |
| 1 Earner | 629 (32.5%) | $60,979 |
| 2 Earners | 783 (40.4%) | $95,927 |
| 3+ Earners | 117 (6.0%) | $116,563 |
| Total | 1,937 (100.0%) | $70,729 |
Household Income in Stuttgart
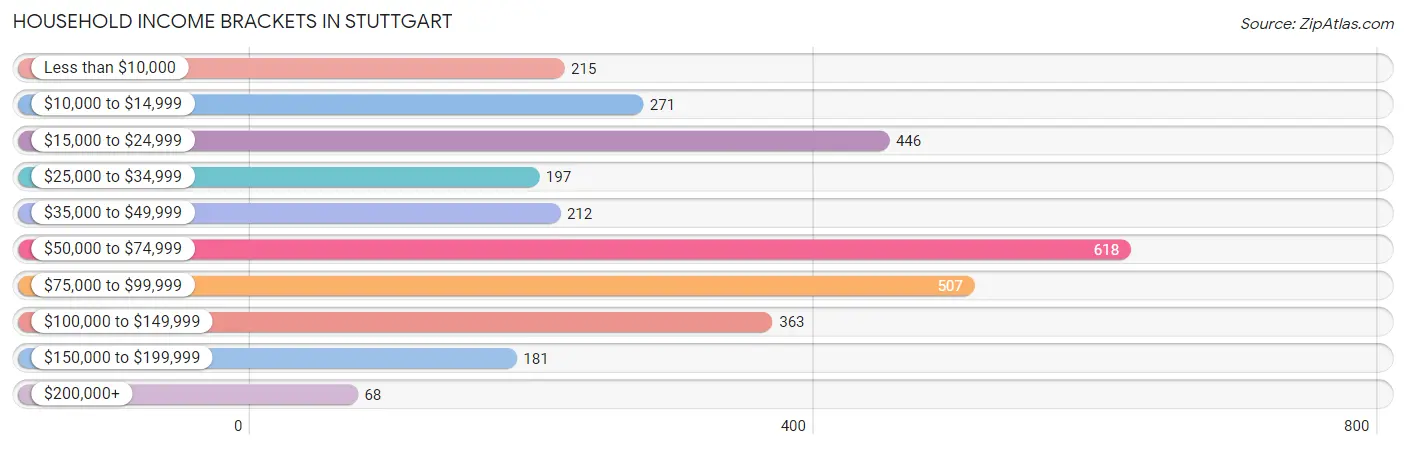
Household Income Brackets in Stuttgart
With 618 households falling in the category, the $50,000 to $74,999 income range is the most frequent in Stuttgart, accounting for 20.1% of all households. In contrast, only 68 households (2.2%) fall into the $200,000+ income bracket, making it the least populous group.
| Income Bracket | # Households | % Households |
| Less than $10,000 | 215 | 7.0% |
| $10,000 to $14,999 | 271 | 8.8% |
| $15,000 to $24,999 | 446 | 14.5% |
| $25,000 to $34,999 | 197 | 6.4% |
| $35,000 to $49,999 | 212 | 6.9% |
| $50,000 to $74,999 | 618 | 20.1% |
| $75,000 to $99,999 | 507 | 16.5% |
| $100,000 to $149,999 | 363 | 11.8% |
| $150,000 to $199,999 | 181 | 5.9% |
| $200,000+ | 68 | 2.2% |
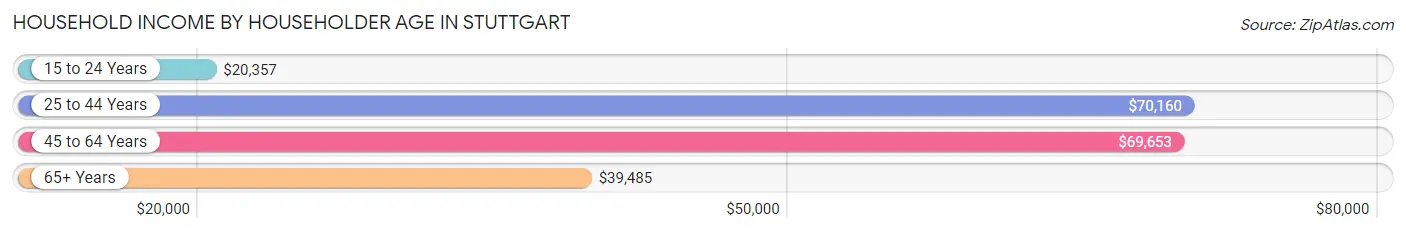
Household Income by Householder Age in Stuttgart
The median household income in Stuttgart is $59,124, with the highest median household income of $70,160 found in the 25 to 44 years age bracket for the primary householder. A total of 918 households (29.8%) fall into this category. Meanwhile, the 15 to 24 years age bracket for the primary householder has the lowest median household income of $20,357, with 90 households (2.9%) in this group.
| Income Bracket | # Households | Median Income |
| 15 to 24 Years | 90 (2.9%) | $20,357 |
| 25 to 44 Years | 918 (29.8%) | $70,160 |
| 45 to 64 Years | 1,077 (35.0%) | $69,653 |
| 65+ Years | 990 (32.2%) | $39,485 |
| Total | 3,075 (100.0%) | $59,124 |
Poverty in Stuttgart
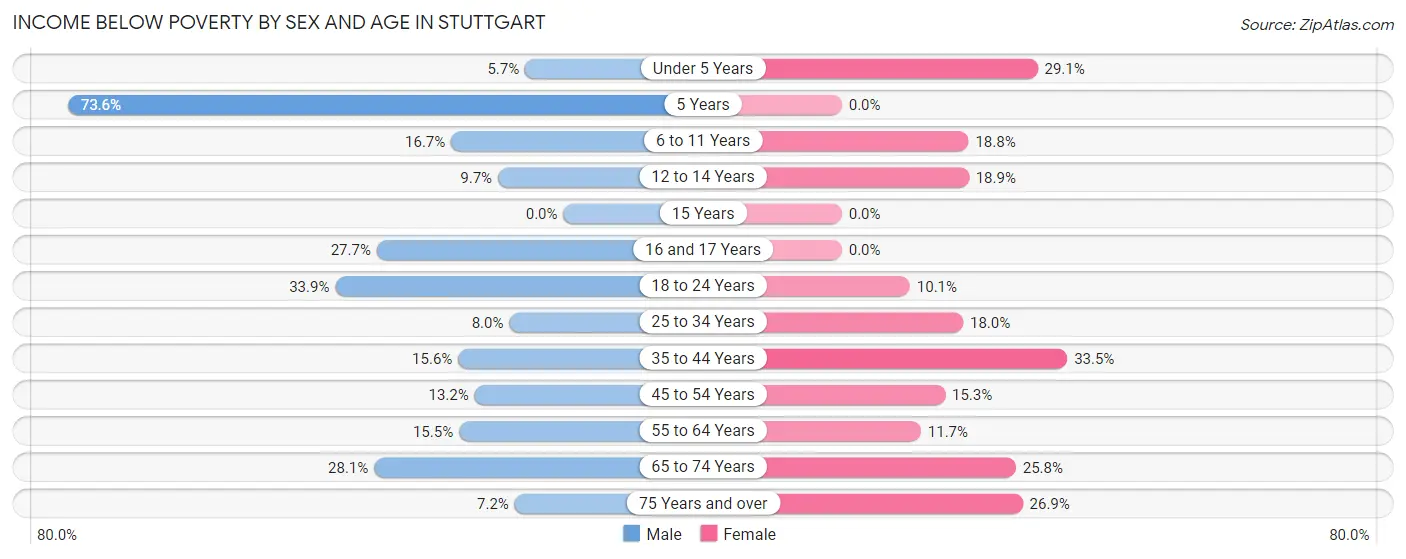
Income Below Poverty by Sex and Age in Stuttgart
With 17.4% poverty level for males and 20.4% for females among the residents of Stuttgart, 5 year old males and 35 to 44 year old females are the most vulnerable to poverty, with 39 males (73.6%) and 168 females (33.5%) in their respective age groups living below the poverty level.
| Age Bracket | Male | Female |
| Under 5 Years | 19 (5.7%) | 91 (29.1%) |
| 5 Years | 39 (73.6%) | 0 (0.0%) |
| 6 to 11 Years | 54 (16.7%) | 92 (18.8%) |
| 12 to 14 Years | 10 (9.7%) | 23 (18.9%) |
| 15 Years | 0 (0.0%) | 0 (0.0%) |
| 16 and 17 Years | 23 (27.7%) | 0 (0.0%) |
| 18 to 24 Years | 147 (33.9%) | 19 (10.1%) |
| 25 to 34 Years | 33 (8.0%) | 110 (18.0%) |
| 35 to 44 Years | 75 (15.6%) | 168 (33.5%) |
| 45 to 54 Years | 69 (13.2%) | 88 (15.3%) |
| 55 to 64 Years | 62 (15.5%) | 58 (11.7%) |
| 65 to 74 Years | 120 (28.1%) | 123 (25.8%) |
| 75 Years and over | 17 (7.2%) | 98 (26.9%) |
| Total | 668 (17.4%) | 870 (20.4%) |
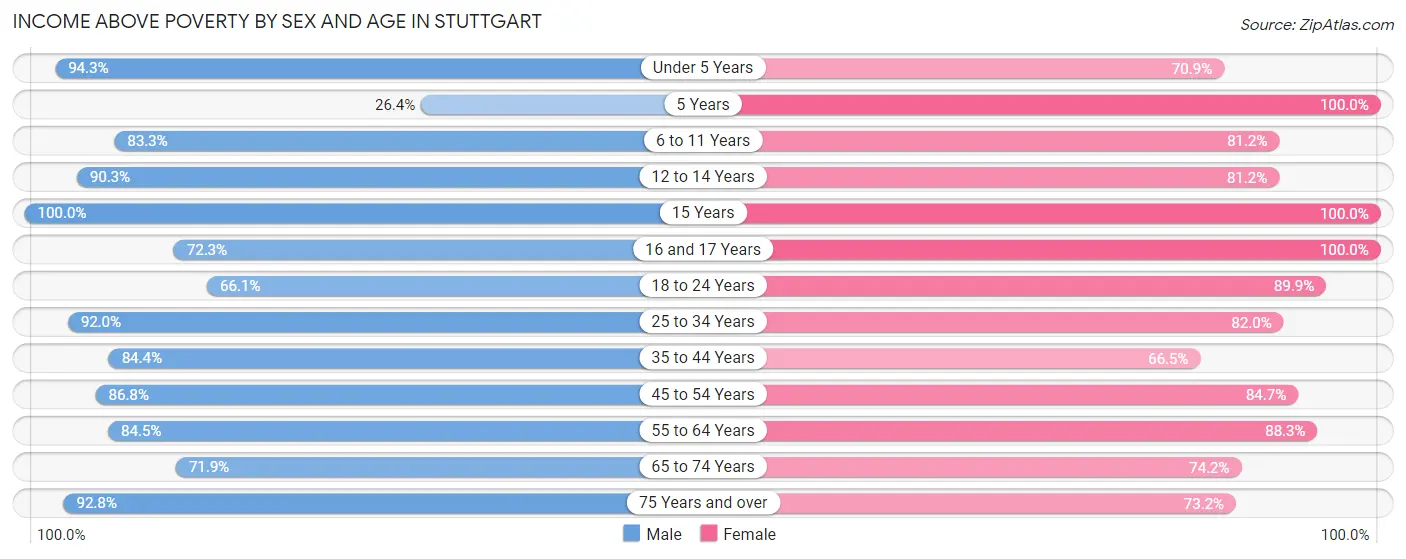
Income Above Poverty by Sex and Age in Stuttgart
According to the poverty statistics in Stuttgart, males aged 15 years and females aged 5 years are the age groups that are most secure financially, with 100.0% of males and 100.0% of females in these age groups living above the poverty line.
| Age Bracket | Male | Female |
| Under 5 Years | 315 (94.3%) | 222 (70.9%) |
| 5 Years | 14 (26.4%) | 26 (100.0%) |
| 6 to 11 Years | 270 (83.3%) | 397 (81.2%) |
| 12 to 14 Years | 93 (90.3%) | 99 (81.1%) |
| 15 Years | 21 (100.0%) | 33 (100.0%) |
| 16 and 17 Years | 60 (72.3%) | 63 (100.0%) |
| 18 to 24 Years | 287 (66.1%) | 169 (89.9%) |
| 25 to 34 Years | 378 (92.0%) | 501 (82.0%) |
| 35 to 44 Years | 405 (84.4%) | 334 (66.5%) |
| 45 to 54 Years | 454 (86.8%) | 486 (84.7%) |
| 55 to 64 Years | 338 (84.5%) | 436 (88.3%) |
| 65 to 74 Years | 307 (71.9%) | 353 (74.2%) |
| 75 Years and over | 218 (92.8%) | 267 (73.2%) |
| Total | 3,160 (82.6%) | 3,386 (79.6%) |
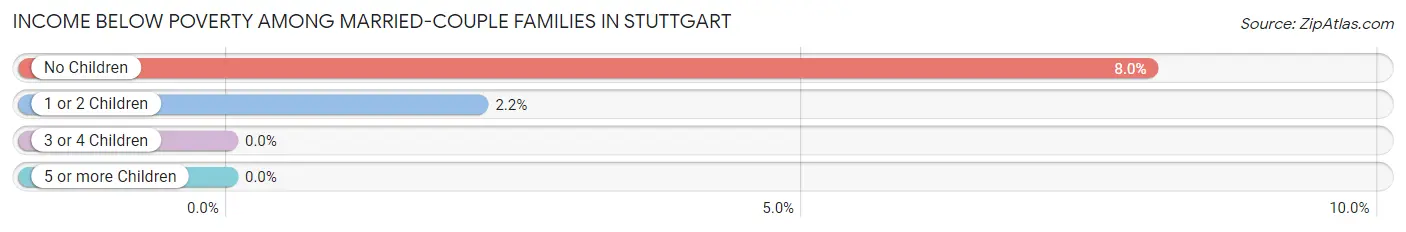
Income Below Poverty Among Married-Couple Families in Stuttgart
The poverty statistics for married-couple families in Stuttgart show that 5.6% or 82 of the total 1,469 families live below the poverty line. Families with no children have the highest poverty rate of 8.0%, comprising of 73 families. On the other hand, families with 3 or 4 children have the lowest poverty rate of 0.0%, which includes 0 families.
| Children | Above Poverty | Below Poverty |
| No Children | 838 (92.0%) | 73 (8.0%) |
| 1 or 2 Children | 404 (97.8%) | 9 (2.2%) |
| 3 or 4 Children | 136 (100.0%) | 0 (0.0%) |
| 5 or more Children | 9 (100.0%) | 0 (0.0%) |
| Total | 1,387 (94.4%) | 82 (5.6%) |
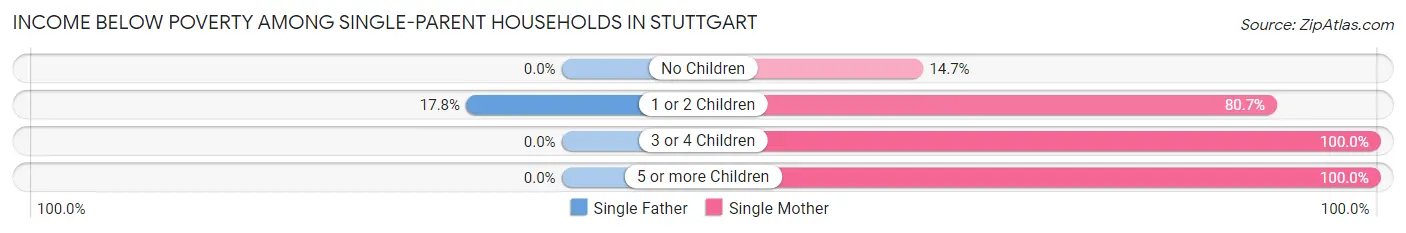
Income Below Poverty Among Single-Parent Households in Stuttgart
According to the poverty data in Stuttgart, 10.2% or 13 single-father households and 47.5% or 162 single-mother households are living below the poverty line. Among single-father households, those with 1 or 2 children have the highest poverty rate, with 13 households (17.8%) experiencing poverty. Likewise, among single-mother households, those with 3 or 4 children have the highest poverty rate, with 33 households (100.0%) falling below the poverty line.
| Children | Single Father | Single Mother |
| No Children | 0 (0.0%) | 27 (14.7%) |
| 1 or 2 Children | 13 (17.8%) | 92 (80.7%) |
| 3 or 4 Children | 0 (0.0%) | 33 (100.0%) |
| 5 or more Children | 0 (0.0%) | 10 (100.0%) |
| Total | 13 (10.2%) | 162 (47.5%) |
Income Below Poverty Among Married-Couple vs Single-Parent Households in Stuttgart
The poverty data for Stuttgart shows that 82 of the married-couple family households (5.6%) and 175 of the single-parent households (37.4%) are living below the poverty level. Within the married-couple family households, those with no children have the highest poverty rate, with 73 households (8.0%) falling below the poverty line. Among the single-parent households, those with 3 or 4 children have the highest poverty rate, with 33 household (100.0%) living below poverty.
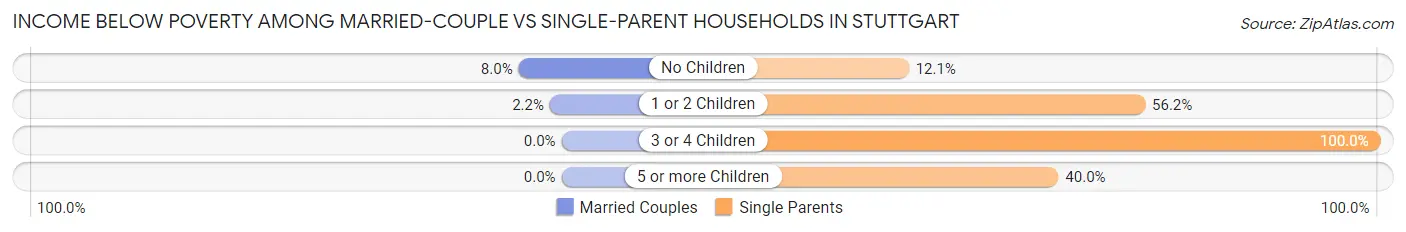
| Children | Married-Couple Families | Single-Parent Households |
| No Children | 73 (8.0%) | 27 (12.1%) |
| 1 or 2 Children | 9 (2.2%) | 105 (56.1%) |
| 3 or 4 Children | 0 (0.0%) | 33 (100.0%) |
| 5 or more Children | 0 (0.0%) | 10 (40.0%) |
| Total | 82 (5.6%) | 175 (37.4%) |
Employment Characteristics in Stuttgart
Employment by Class of Employer in Stuttgart
Among the 3,341 employed individuals in Stuttgart, private company employees (2,301 | 68.9%), state government employees (253 | 7.6%), and self-employed (not incorporated) (215 | 6.4%) make up the most common classes of employment.
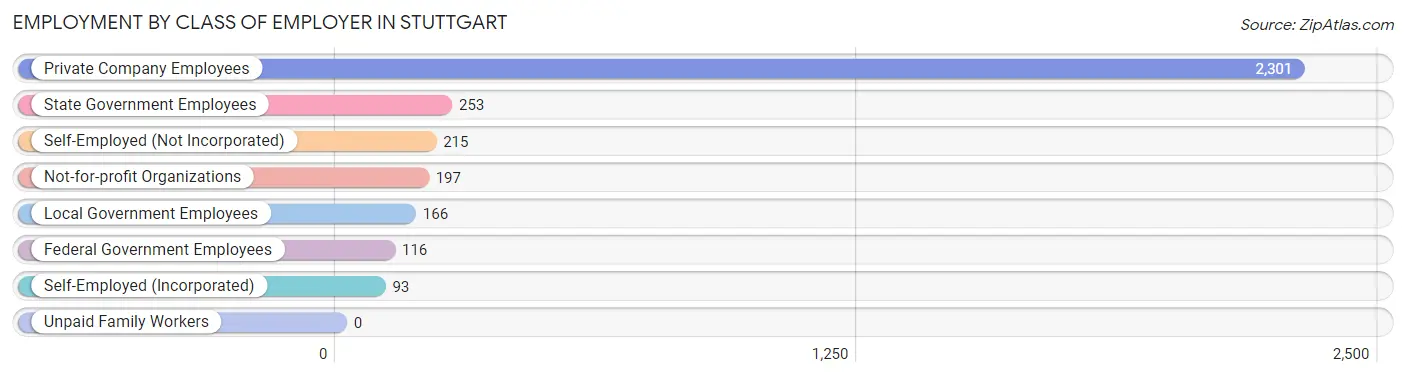
| Employer Class | # Employees | % Employees |
| Private Company Employees | 2,301 | 68.9% |
| Self-Employed (Incorporated) | 93 | 2.8% |
| Self-Employed (Not Incorporated) | 215 | 6.4% |
| Not-for-profit Organizations | 197 | 5.9% |
| Local Government Employees | 166 | 5.0% |
| State Government Employees | 253 | 7.6% |
| Federal Government Employees | 116 | 3.5% |
| Unpaid Family Workers | 0 | 0.0% |
| Total | 3,341 | 100.0% |
Employment Status by Age in Stuttgart
According to the labor force statistics for Stuttgart, out of the total population over 16 years of age (6,341), 58.1% or 3,684 individuals are in the labor force, with 8.7% or 321 of them unemployed. The age group with the highest labor force participation rate is 30 to 34 years, with 87.9% or 436 individuals in the labor force. Within the labor force, the 16 to 19 years age range has the highest percentage of unemployed individuals, with 50.9% or 56 of them being unemployed.
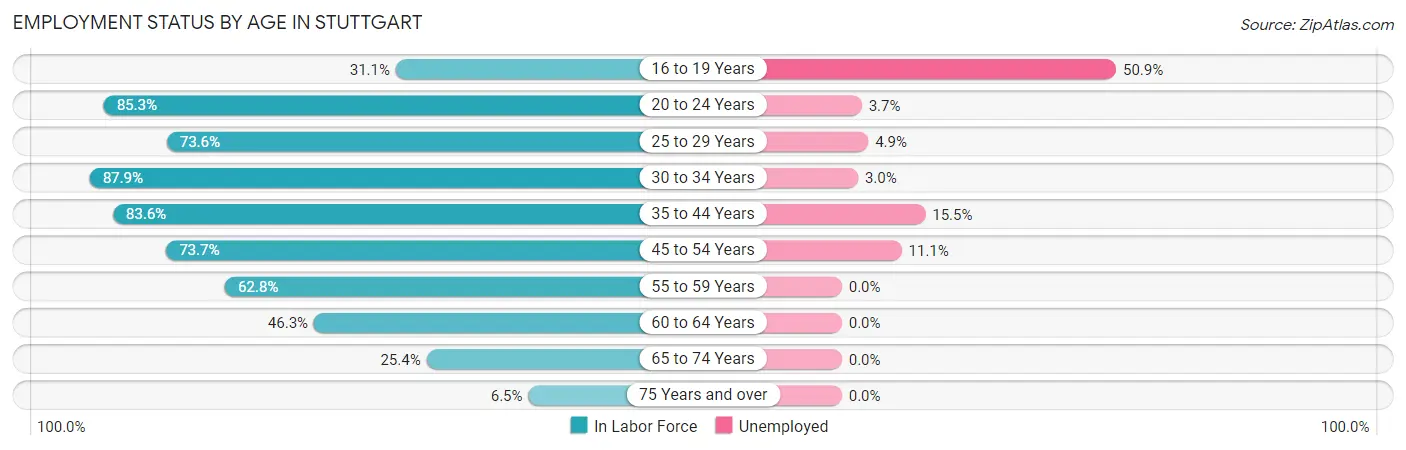
| Age Bracket | In Labor Force | Unemployed |
| 16 to 19 Years | 110 (31.1%) | 56 (50.9%) |
| 20 to 24 Years | 353 (85.3%) | 13 (3.7%) |
| 25 to 29 Years | 387 (73.6%) | 19 (4.9%) |
| 30 to 34 Years | 436 (87.9%) | 13 (3.0%) |
| 35 to 44 Years | 821 (83.6%) | 127 (15.5%) |
| 45 to 54 Years | 820 (73.7%) | 91 (11.1%) |
| 55 to 59 Years | 262 (62.8%) | 0 (0.0%) |
| 60 to 64 Years | 223 (46.3%) | 0 (0.0%) |
| 65 to 74 Years | 231 (25.4%) | 0 (0.0%) |
| 75 Years and over | 42 (6.5%) | 0 (0.0%) |
| Total | 3,684 (58.1%) | 321 (8.7%) |
Employment Status by Educational Attainment in Stuttgart
According to labor force statistics for Stuttgart, 73.4% of individuals (2,947) out of the total population between 25 and 64 years of age (4,015) are in the labor force, with 8.5% or 250 of them being unemployed. The group with the highest labor force participation rate are those with the educational attainment of bachelor's degree or higher, with 89.7% or 674 individuals in the labor force. Within the labor force, individuals with less than high school education have the highest percentage of unemployment, with 42.1% or 69 of them being unemployed.
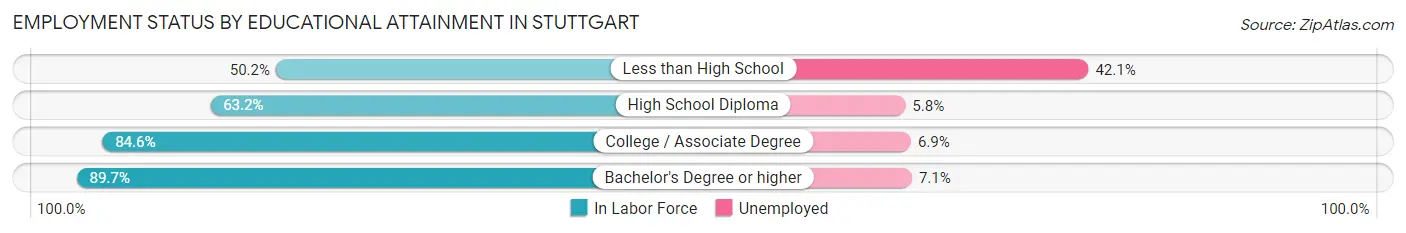
| Educational Attainment | In Labor Force | Unemployed |
| Less than High School | 164 (50.2%) | 138 (42.1%) |
| High School Diploma | 1,107 (63.2%) | 102 (5.8%) |
| College / Associate Degree | 1,003 (84.6%) | 82 (6.9%) |
| Bachelor's Degree or higher | 674 (89.7%) | 53 (7.1%) |
| Total | 2,947 (73.4%) | 341 (8.5%) |
Employment Occupations by Sex in Stuttgart
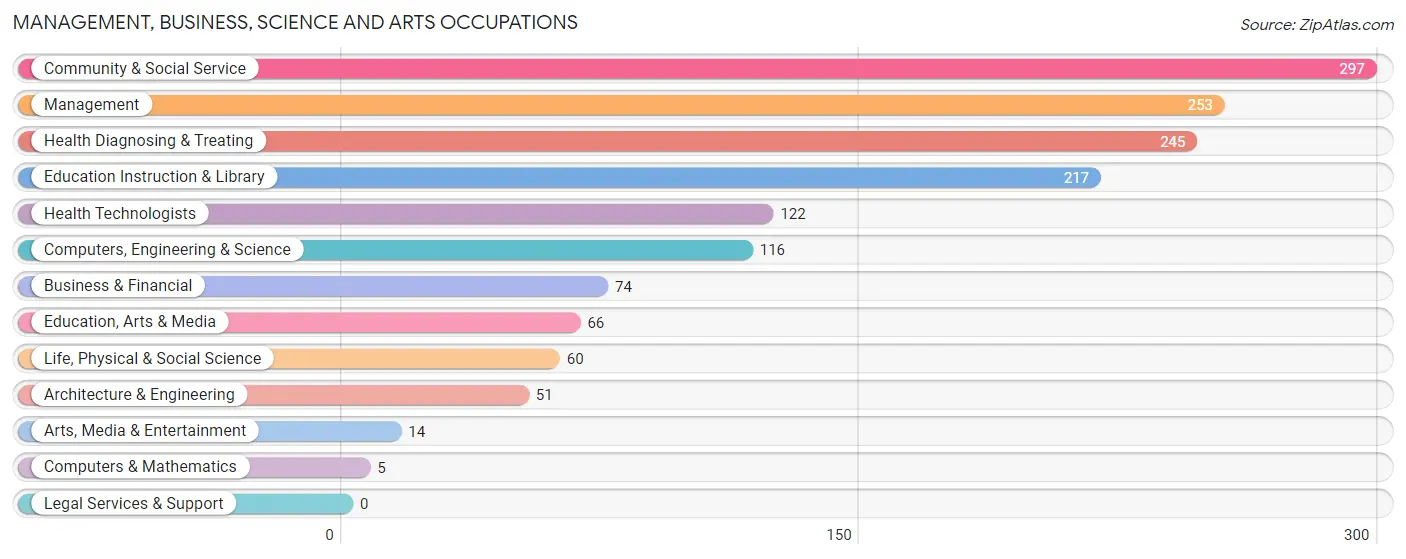
Management, Business, Science and Arts Occupations
The most common Management, Business, Science and Arts occupations in Stuttgart are Community & Social Service (297 | 8.8%), Management (253 | 7.5%), Health Diagnosing & Treating (245 | 7.3%), Education Instruction & Library (217 | 6.5%), and Health Technologists (122 | 3.6%).
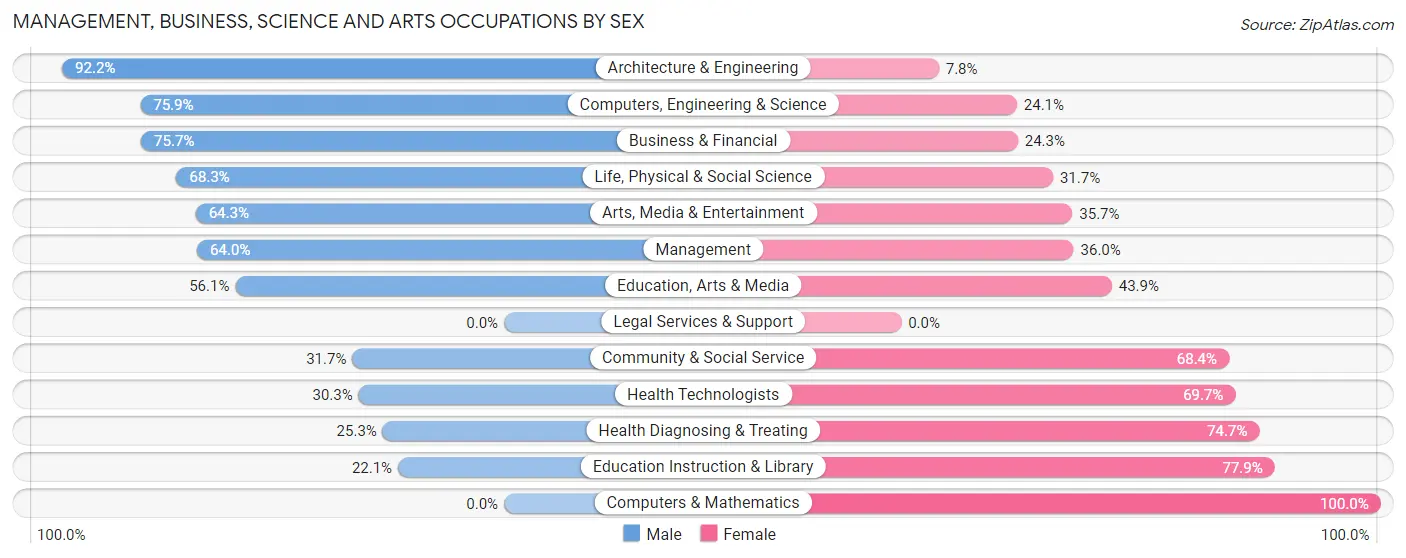
Management, Business, Science and Arts Occupations by Sex
Within the Management, Business, Science and Arts occupations in Stuttgart, the most male-oriented occupations are Architecture & Engineering (92.2%), Computers, Engineering & Science (75.9%), and Business & Financial (75.7%), while the most female-oriented occupations are Computers & Mathematics (100.0%), Education Instruction & Library (77.9%), and Health Diagnosing & Treating (74.7%).
| Occupation | Male | Female |
| Management | 162 (64.0%) | 91 (36.0%) |
| Business & Financial | 56 (75.7%) | 18 (24.3%) |
| Computers, Engineering & Science | 88 (75.9%) | 28 (24.1%) |
| Computers & Mathematics | 0 (0.0%) | 5 (100.0%) |
| Architecture & Engineering | 47 (92.2%) | 4 (7.8%) |
| Life, Physical & Social Science | 41 (68.3%) | 19 (31.7%) |
| Community & Social Service | 94 (31.7%) | 203 (68.3%) |
| Education, Arts & Media | 37 (56.1%) | 29 (43.9%) |
| Legal Services & Support | 0 (0.0%) | 0 (0.0%) |
| Education Instruction & Library | 48 (22.1%) | 169 (77.9%) |
| Arts, Media & Entertainment | 9 (64.3%) | 5 (35.7%) |
| Health Diagnosing & Treating | 62 (25.3%) | 183 (74.7%) |
| Health Technologists | 37 (30.3%) | 85 (69.7%) |
| Total (Category) | 462 (46.9%) | 523 (53.1%) |
| Total (Overall) | 1,720 (51.1%) | 1,645 (48.9%) |
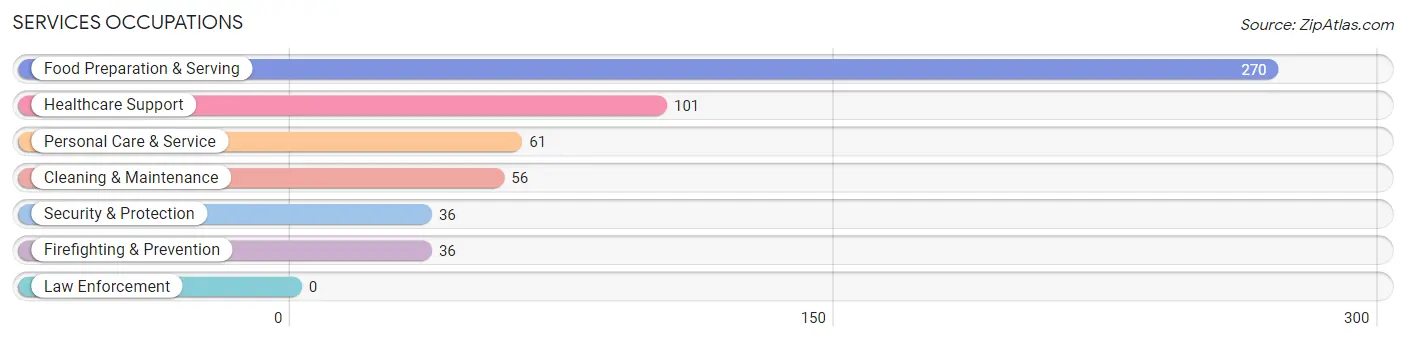
Services Occupations
The most common Services occupations in Stuttgart are Food Preparation & Serving (270 | 8.0%), Healthcare Support (101 | 3.0%), Personal Care & Service (61 | 1.8%), Cleaning & Maintenance (56 | 1.7%), and Security & Protection (36 | 1.1%).
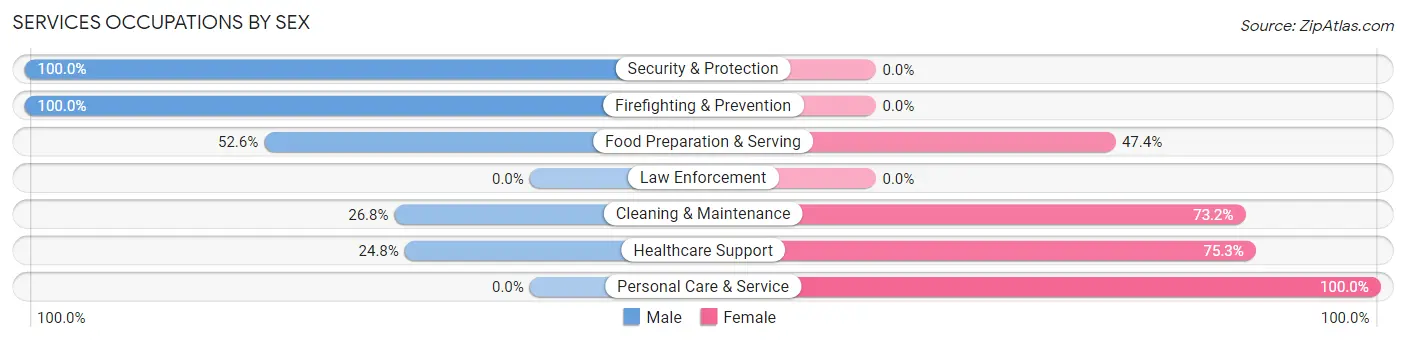
Services Occupations by Sex
Within the Services occupations in Stuttgart, the most male-oriented occupations are Security & Protection (100.0%), Firefighting & Prevention (100.0%), and Food Preparation & Serving (52.6%), while the most female-oriented occupations are Personal Care & Service (100.0%), Healthcare Support (75.2%), and Cleaning & Maintenance (73.2%).
| Occupation | Male | Female |
| Healthcare Support | 25 (24.7%) | 76 (75.2%) |
| Security & Protection | 36 (100.0%) | 0 (0.0%) |
| Firefighting & Prevention | 36 (100.0%) | 0 (0.0%) |
| Law Enforcement | 0 (0.0%) | 0 (0.0%) |
| Food Preparation & Serving | 142 (52.6%) | 128 (47.4%) |
| Cleaning & Maintenance | 15 (26.8%) | 41 (73.2%) |
| Personal Care & Service | 0 (0.0%) | 61 (100.0%) |
| Total (Category) | 218 (41.6%) | 306 (58.4%) |
| Total (Overall) | 1,720 (51.1%) | 1,645 (48.9%) |
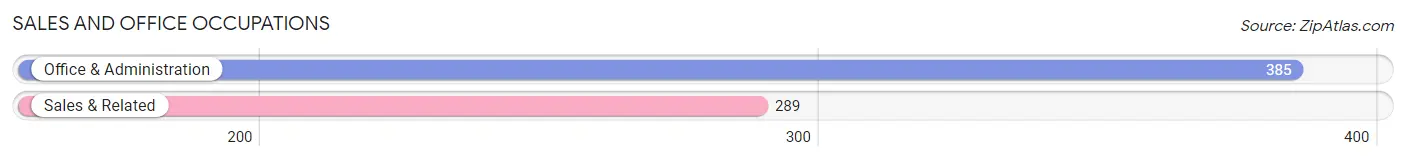
Sales and Office Occupations
The most common Sales and Office occupations in Stuttgart are Office & Administration (385 | 11.4%), and Sales & Related (289 | 8.6%).
Sales and Office Occupations by Sex
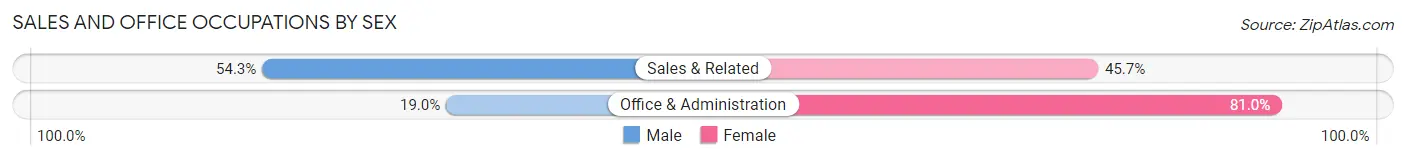
| Occupation | Male | Female |
| Sales & Related | 157 (54.3%) | 132 (45.7%) |
| Office & Administration | 73 (19.0%) | 312 (81.0%) |
| Total (Category) | 230 (34.1%) | 444 (65.9%) |
| Total (Overall) | 1,720 (51.1%) | 1,645 (48.9%) |
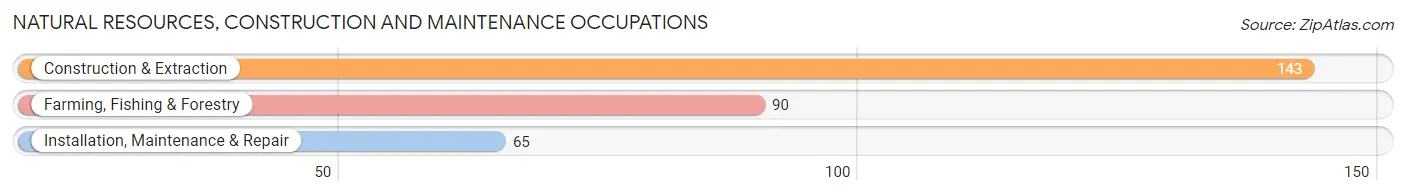
Natural Resources, Construction and Maintenance Occupations
The most common Natural Resources, Construction and Maintenance occupations in Stuttgart are Construction & Extraction (143 | 4.3%), Farming, Fishing & Forestry (90 | 2.7%), and Installation, Maintenance & Repair (65 | 1.9%).
Natural Resources, Construction and Maintenance Occupations by Sex
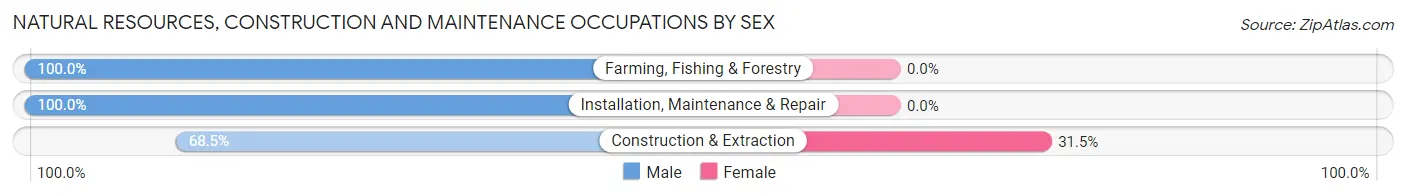
| Occupation | Male | Female |
| Farming, Fishing & Forestry | 90 (100.0%) | 0 (0.0%) |
| Construction & Extraction | 98 (68.5%) | 45 (31.5%) |
| Installation, Maintenance & Repair | 65 (100.0%) | 0 (0.0%) |
| Total (Category) | 253 (84.9%) | 45 (15.1%) |
| Total (Overall) | 1,720 (51.1%) | 1,645 (48.9%) |
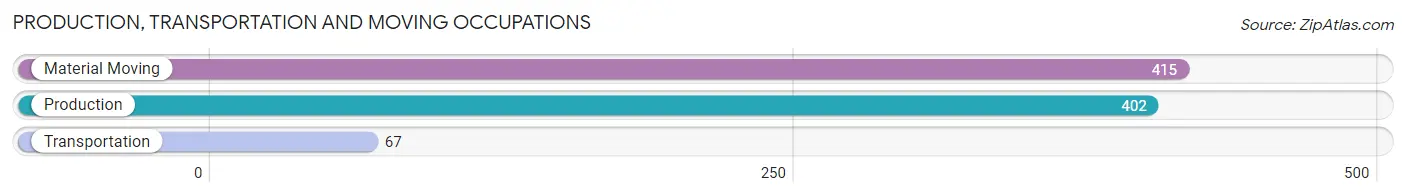
Production, Transportation and Moving Occupations
The most common Production, Transportation and Moving occupations in Stuttgart are Material Moving (415 | 12.3%), Production (402 | 11.9%), and Transportation (67 | 2.0%).
Production, Transportation and Moving Occupations by Sex
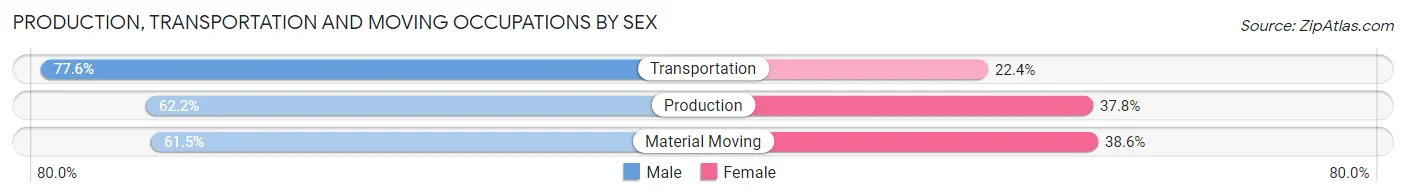
| Occupation | Male | Female |
| Production | 250 (62.2%) | 152 (37.8%) |
| Transportation | 52 (77.6%) | 15 (22.4%) |
| Material Moving | 255 (61.5%) | 160 (38.6%) |
| Total (Category) | 557 (63.0%) | 327 (37.0%) |
| Total (Overall) | 1,720 (51.1%) | 1,645 (48.9%) |
Employment Industries by Sex in Stuttgart
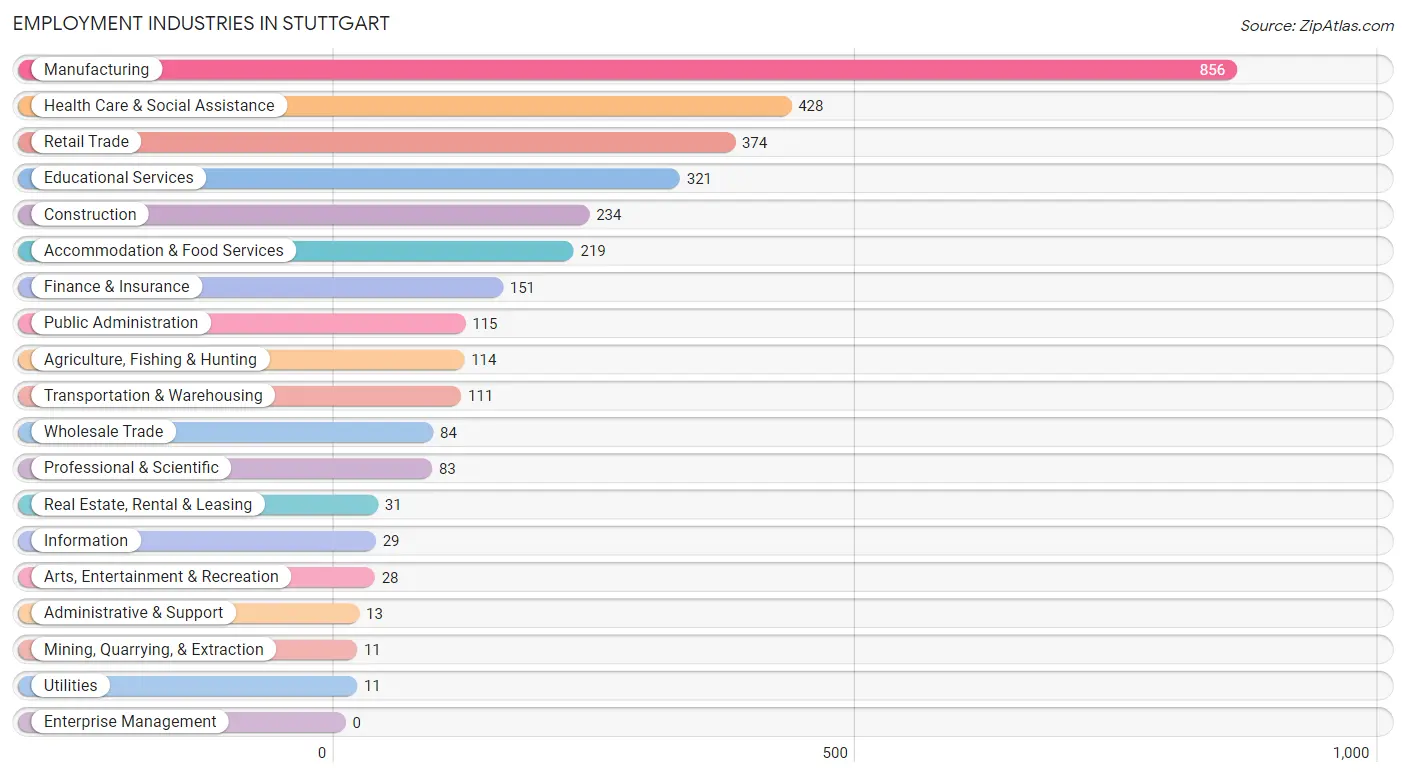
Employment Industries in Stuttgart
The major employment industries in Stuttgart include Manufacturing (856 | 25.4%), Health Care & Social Assistance (428 | 12.7%), Retail Trade (374 | 11.1%), Educational Services (321 | 9.5%), and Construction (234 | 7.0%).
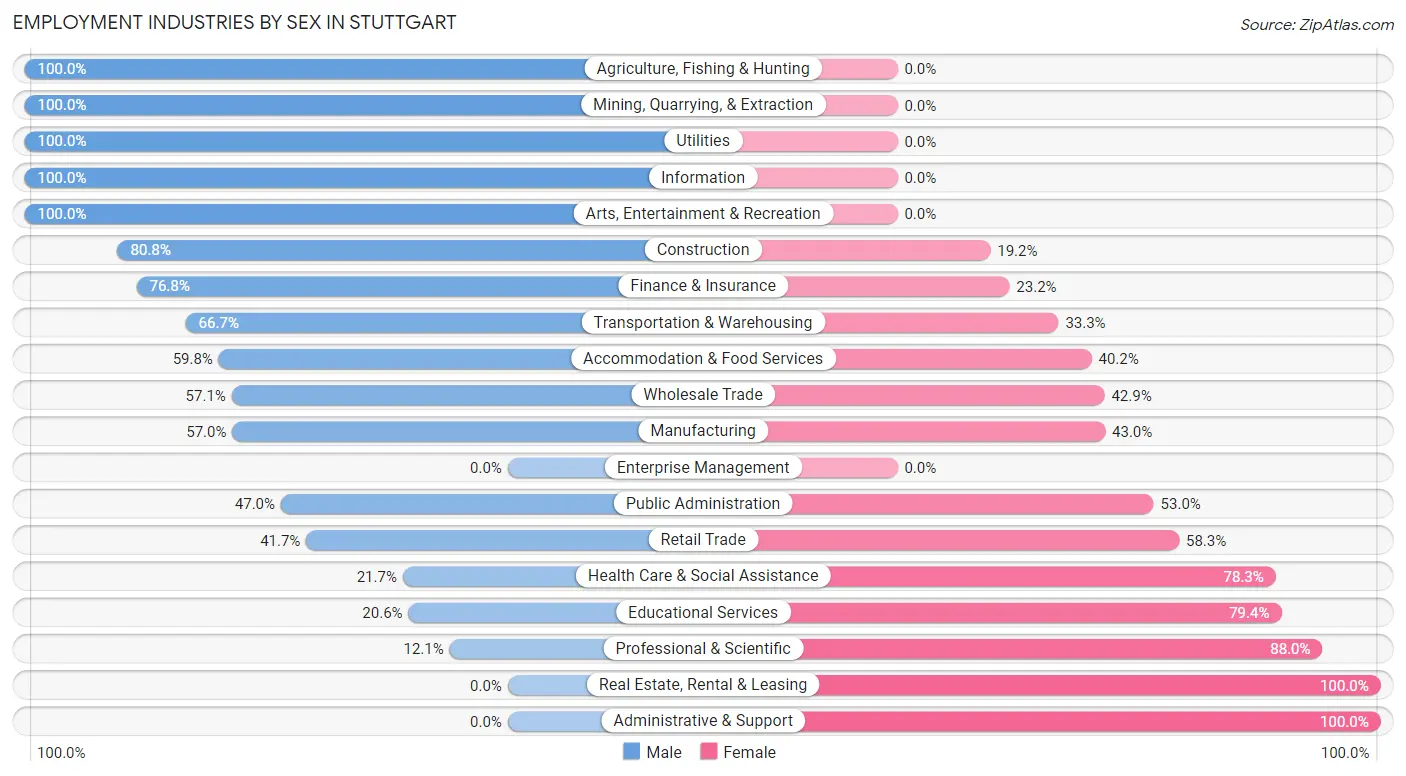
Employment Industries by Sex in Stuttgart
The Stuttgart industries that see more men than women are Agriculture, Fishing & Hunting (100.0%), Mining, Quarrying, & Extraction (100.0%), and Utilities (100.0%), whereas the industries that tend to have a higher number of women are Real Estate, Rental & Leasing (100.0%), Administrative & Support (100.0%), and Professional & Scientific (87.9%).
| Industry | Male | Female |
| Agriculture, Fishing & Hunting | 114 (100.0%) | 0 (0.0%) |
| Mining, Quarrying, & Extraction | 11 (100.0%) | 0 (0.0%) |
| Construction | 189 (80.8%) | 45 (19.2%) |
| Manufacturing | 488 (57.0%) | 368 (43.0%) |
| Wholesale Trade | 48 (57.1%) | 36 (42.9%) |
| Retail Trade | 156 (41.7%) | 218 (58.3%) |
| Transportation & Warehousing | 74 (66.7%) | 37 (33.3%) |
| Utilities | 11 (100.0%) | 0 (0.0%) |
| Information | 29 (100.0%) | 0 (0.0%) |
| Finance & Insurance | 116 (76.8%) | 35 (23.2%) |
| Real Estate, Rental & Leasing | 0 (0.0%) | 31 (100.0%) |
| Professional & Scientific | 10 (12.0%) | 73 (87.9%) |
| Enterprise Management | 0 (0.0%) | 0 (0.0%) |
| Administrative & Support | 0 (0.0%) | 13 (100.0%) |
| Educational Services | 66 (20.6%) | 255 (79.4%) |
| Health Care & Social Assistance | 93 (21.7%) | 335 (78.3%) |
| Arts, Entertainment & Recreation | 28 (100.0%) | 0 (0.0%) |
| Accommodation & Food Services | 131 (59.8%) | 88 (40.2%) |
| Public Administration | 54 (47.0%) | 61 (53.0%) |
| Total | 1,720 (51.1%) | 1,645 (48.9%) |
Education in Stuttgart
School Enrollment in Stuttgart
The most common levels of schooling among the 1,921 students in Stuttgart are elementary school (533 | 27.8%), high school (382 | 19.9%), and middle school (293 | 15.2%).
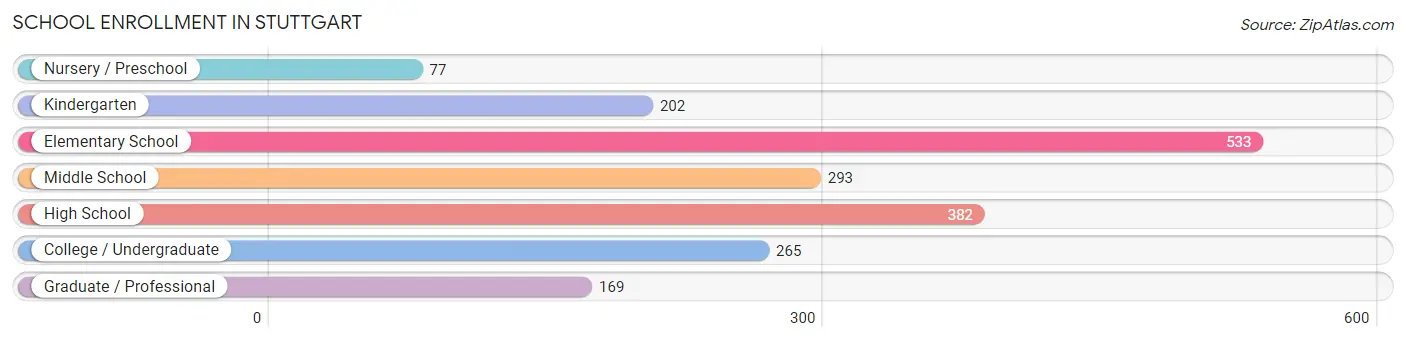
| School Level | # Students | % Students |
| Nursery / Preschool | 77 | 4.0% |
| Kindergarten | 202 | 10.5% |
| Elementary School | 533 | 27.8% |
| Middle School | 293 | 15.2% |
| High School | 382 | 19.9% |
| College / Undergraduate | 265 | 13.8% |
| Graduate / Professional | 169 | 8.8% |
| Total | 1,921 | 100.0% |
School Enrollment by Age by Funding Source in Stuttgart
Out of a total of 1,921 students who are enrolled in schools in Stuttgart, 204 (10.6%) attend a private institution, while the remaining 1,717 (89.4%) are enrolled in public schools. The age group of 25 to 34 year olds has the highest likelihood of being enrolled in private schools, with 39 (46.4% in the age bracket) enrolled. Conversely, the age group of 20 to 24 year olds has the lowest likelihood of being enrolled in a private school, with 153 (100.0% in the age bracket) attending a public institution.
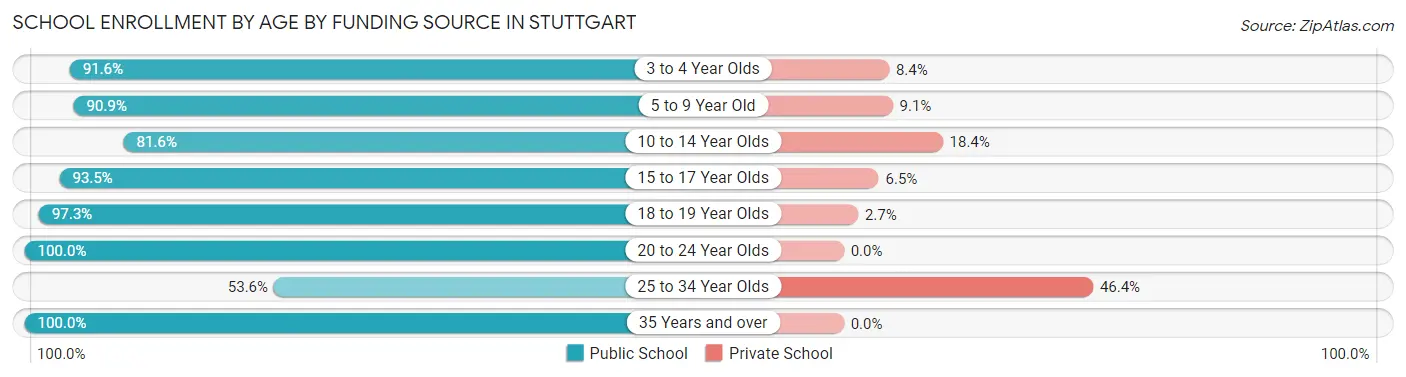
| Age Bracket | Public School | Private School |
| 3 to 4 Year Olds | 76 (91.6%) | 7 (8.4%) |
| 5 to 9 Year Old | 519 (90.9%) | 52 (9.1%) |
| 10 to 14 Year Olds | 394 (81.6%) | 89 (18.4%) |
| 15 to 17 Year Olds | 187 (93.5%) | 13 (6.5%) |
| 18 to 19 Year Olds | 146 (97.3%) | 4 (2.7%) |
| 20 to 24 Year Olds | 153 (100.0%) | 0 (0.0%) |
| 25 to 34 Year Olds | 45 (53.6%) | 39 (46.4%) |
| 35 Years and over | 197 (100.0%) | 0 (0.0%) |
| Total | 1,717 (89.4%) | 204 (10.6%) |
Educational Attainment by Field of Study in Stuttgart
Business (228 | 23.0%), bio, nature & agricultural (193 | 19.4%), education (136 | 13.7%), science & technology (121 | 12.2%), and physical & health sciences (86 | 8.7%) are the most common fields of study among 993 individuals in Stuttgart who have obtained a bachelor's degree or higher.
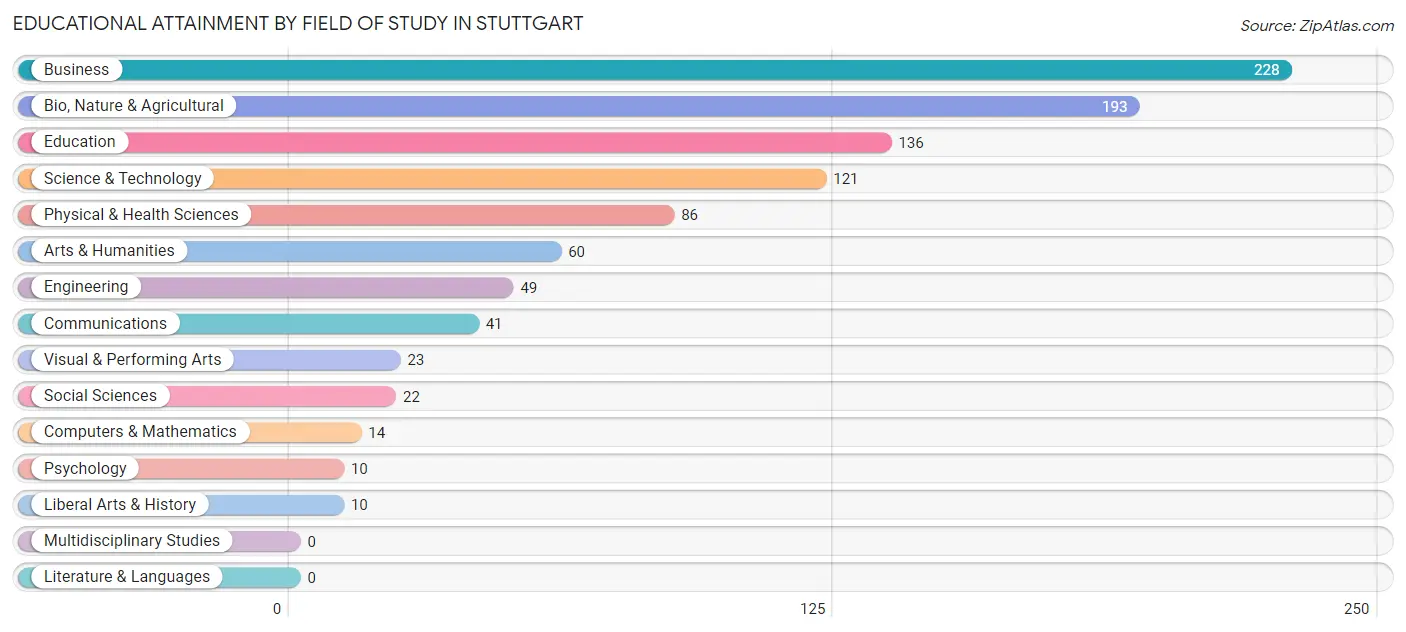
| Field of Study | # Graduates | % Graduates |
| Computers & Mathematics | 14 | 1.4% |
| Bio, Nature & Agricultural | 193 | 19.4% |
| Physical & Health Sciences | 86 | 8.7% |
| Psychology | 10 | 1.0% |
| Social Sciences | 22 | 2.2% |
| Engineering | 49 | 4.9% |
| Multidisciplinary Studies | 0 | 0.0% |
| Science & Technology | 121 | 12.2% |
| Business | 228 | 23.0% |
| Education | 136 | 13.7% |
| Literature & Languages | 0 | 0.0% |
| Liberal Arts & History | 10 | 1.0% |
| Visual & Performing Arts | 23 | 2.3% |
| Communications | 41 | 4.1% |
| Arts & Humanities | 60 | 6.0% |
| Total | 993 | 100.0% |
Transportation & Commute in Stuttgart
Vehicle Availability by Sex in Stuttgart
The most prevalent vehicle ownership categories in Stuttgart are males with 2 vehicles (1,084, accounting for 63.2%) and females with 2 vehicles (890, making up 66.9%).
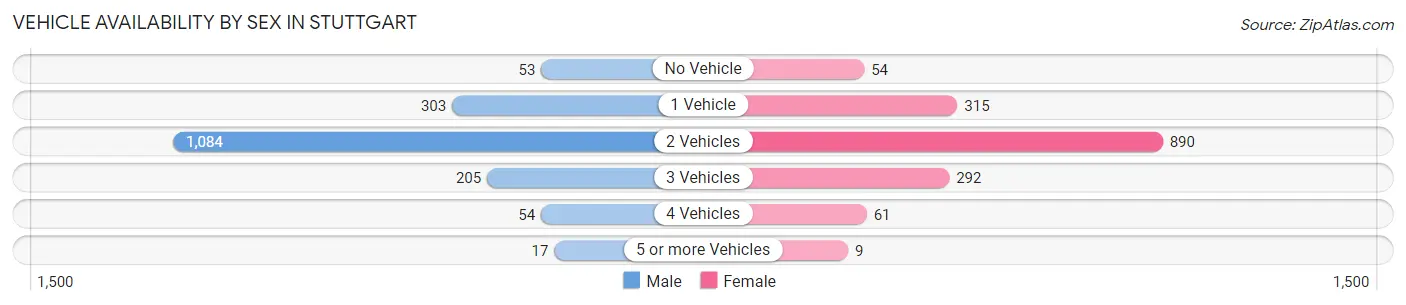
| Vehicles Available | Male | Female |
| No Vehicle | 53 (3.1%) | 54 (3.3%) |
| 1 Vehicle | 303 (17.7%) | 315 (19.4%) |
| 2 Vehicles | 1,084 (63.2%) | 890 (54.9%) |
| 3 Vehicles | 205 (11.9%) | 292 (18.0%) |
| 4 Vehicles | 54 (3.2%) | 61 (3.8%) |
| 5 or more Vehicles | 17 (1.0%) | 9 (0.6%) |
| Total | 1,716 (100.0%) | 1,621 (100.0%) |
Commute Time in Stuttgart
The most frequently occuring commute durations in Stuttgart are 5 to 9 minutes (1,053 commuters, 32.1%), 10 to 14 minutes (673 commuters, 20.5%), and less than 5 minutes (591 commuters, 18.0%).
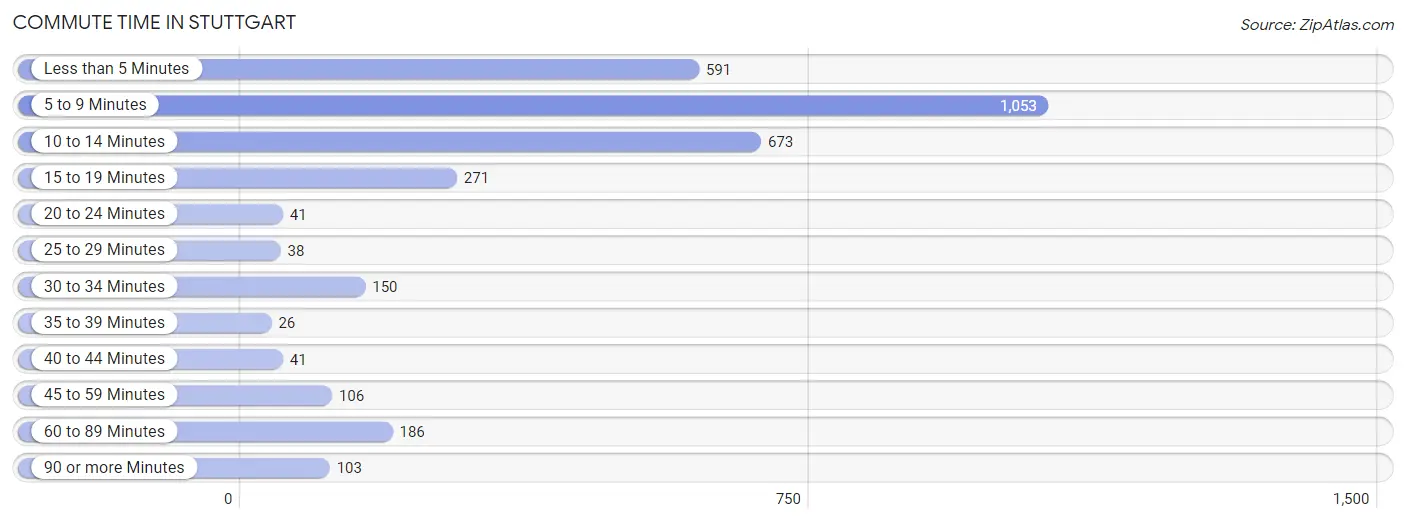
| Commute Time | # Commuters | % Commuters |
| Less than 5 Minutes | 591 | 18.0% |
| 5 to 9 Minutes | 1,053 | 32.1% |
| 10 to 14 Minutes | 673 | 20.5% |
| 15 to 19 Minutes | 271 | 8.3% |
| 20 to 24 Minutes | 41 | 1.3% |
| 25 to 29 Minutes | 38 | 1.2% |
| 30 to 34 Minutes | 150 | 4.6% |
| 35 to 39 Minutes | 26 | 0.8% |
| 40 to 44 Minutes | 41 | 1.3% |
| 45 to 59 Minutes | 106 | 3.2% |
| 60 to 89 Minutes | 186 | 5.7% |
| 90 or more Minutes | 103 | 3.1% |
Commute Time by Sex in Stuttgart
The most common commute times in Stuttgart are 5 to 9 minutes (601 commuters, 34.9%) for males and 5 to 9 minutes (452 commuters, 29.0%) for females.
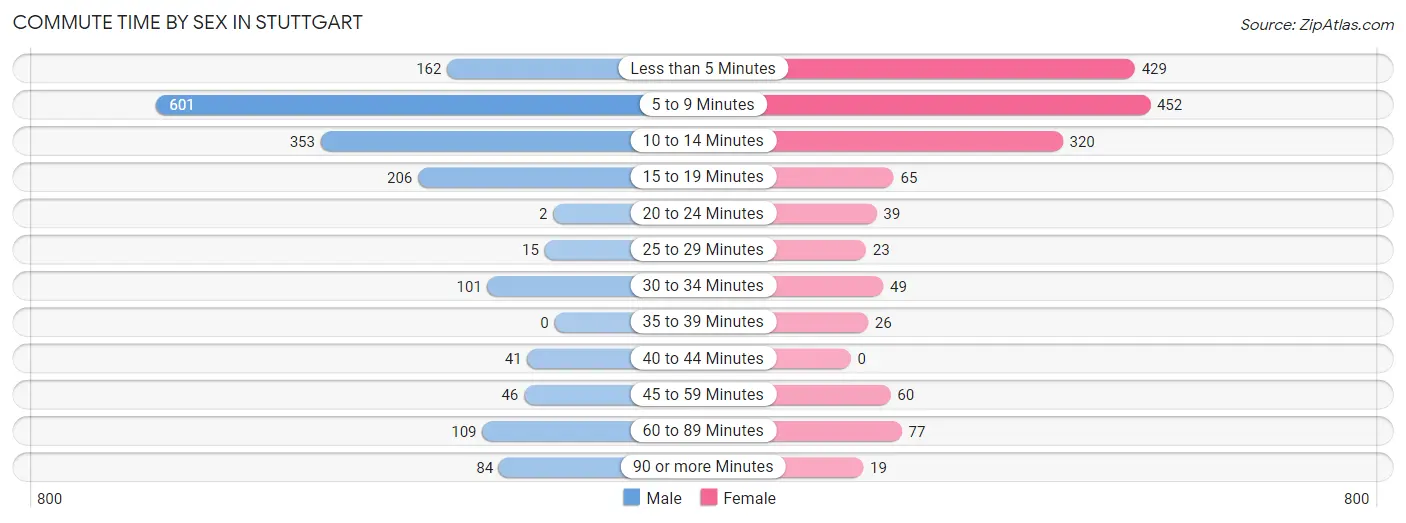
| Commute Time | Male | Female |
| Less than 5 Minutes | 162 (9.4%) | 429 (27.5%) |
| 5 to 9 Minutes | 601 (34.9%) | 452 (29.0%) |
| 10 to 14 Minutes | 353 (20.5%) | 320 (20.5%) |
| 15 to 19 Minutes | 206 (12.0%) | 65 (4.2%) |
| 20 to 24 Minutes | 2 (0.1%) | 39 (2.5%) |
| 25 to 29 Minutes | 15 (0.9%) | 23 (1.5%) |
| 30 to 34 Minutes | 101 (5.9%) | 49 (3.1%) |
| 35 to 39 Minutes | 0 (0.0%) | 26 (1.7%) |
| 40 to 44 Minutes | 41 (2.4%) | 0 (0.0%) |
| 45 to 59 Minutes | 46 (2.7%) | 60 (3.8%) |
| 60 to 89 Minutes | 109 (6.3%) | 77 (4.9%) |
| 90 or more Minutes | 84 (4.9%) | 19 (1.2%) |
Time of Departure to Work by Sex in Stuttgart
The most frequent times of departure to work in Stuttgart are 6:30 AM to 6:59 AM (387, 22.5%) for males and 7:30 AM to 7:59 AM (404, 25.9%) for females.
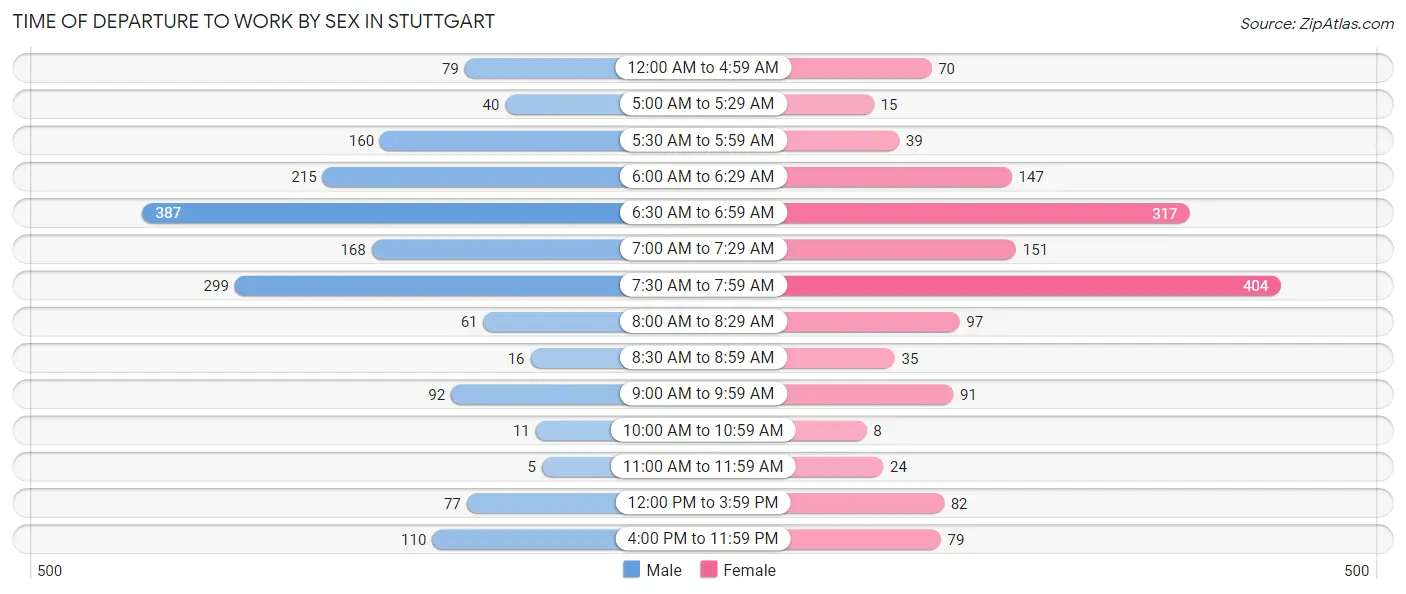
| Time of Departure | Male | Female |
| 12:00 AM to 4:59 AM | 79 (4.6%) | 70 (4.5%) |
| 5:00 AM to 5:29 AM | 40 (2.3%) | 15 (1.0%) |
| 5:30 AM to 5:59 AM | 160 (9.3%) | 39 (2.5%) |
| 6:00 AM to 6:29 AM | 215 (12.5%) | 147 (9.4%) |
| 6:30 AM to 6:59 AM | 387 (22.5%) | 317 (20.3%) |
| 7:00 AM to 7:29 AM | 168 (9.8%) | 151 (9.7%) |
| 7:30 AM to 7:59 AM | 299 (17.4%) | 404 (25.9%) |
| 8:00 AM to 8:29 AM | 61 (3.5%) | 97 (6.2%) |
| 8:30 AM to 8:59 AM | 16 (0.9%) | 35 (2.2%) |
| 9:00 AM to 9:59 AM | 92 (5.3%) | 91 (5.8%) |
| 10:00 AM to 10:59 AM | 11 (0.6%) | 8 (0.5%) |
| 11:00 AM to 11:59 AM | 5 (0.3%) | 24 (1.5%) |
| 12:00 PM to 3:59 PM | 77 (4.5%) | 82 (5.3%) |
| 4:00 PM to 11:59 PM | 110 (6.4%) | 79 (5.1%) |
| Total | 1,720 (100.0%) | 1,559 (100.0%) |
Housing Occupancy in Stuttgart
Occupancy by Ownership in Stuttgart
Of the total 3,075 dwellings in Stuttgart, owner-occupied units account for 1,715 (55.8%), while renter-occupied units make up 1,360 (44.2%).
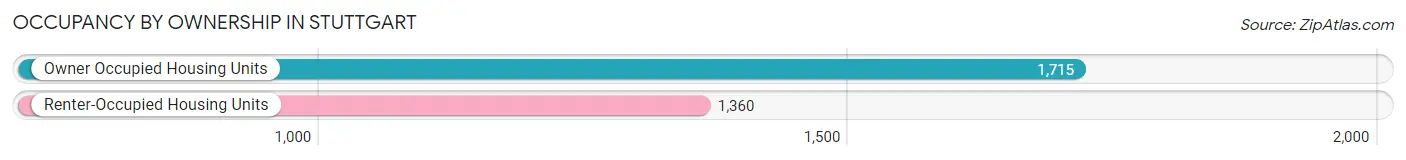
| Occupancy | # Housing Units | % Housing Units |
| Owner Occupied Housing Units | 1,715 | 55.8% |
| Renter-Occupied Housing Units | 1,360 | 44.2% |
| Total Occupied Housing Units | 3,075 | 100.0% |
Occupancy by Household Size in Stuttgart
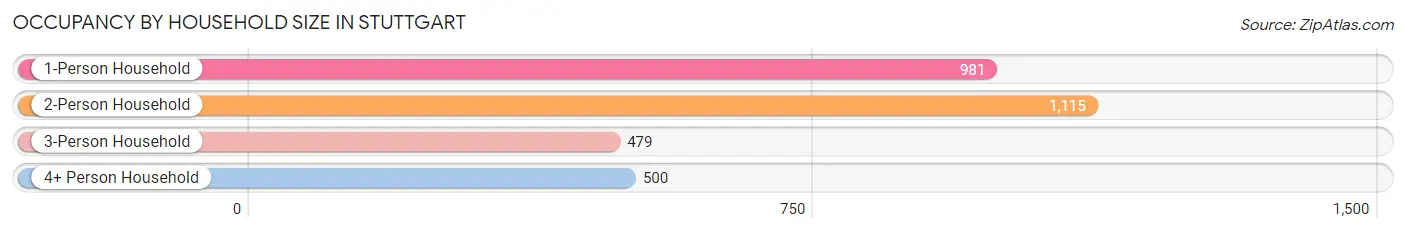
| Household Size | # Housing Units | % Housing Units |
| 1-Person Household | 981 | 31.9% |
| 2-Person Household | 1,115 | 36.3% |
| 3-Person Household | 479 | 15.6% |
| 4+ Person Household | 500 | 16.3% |
| Total Housing Units | 3,075 | 100.0% |
Occupancy by Ownership by Household Size in Stuttgart
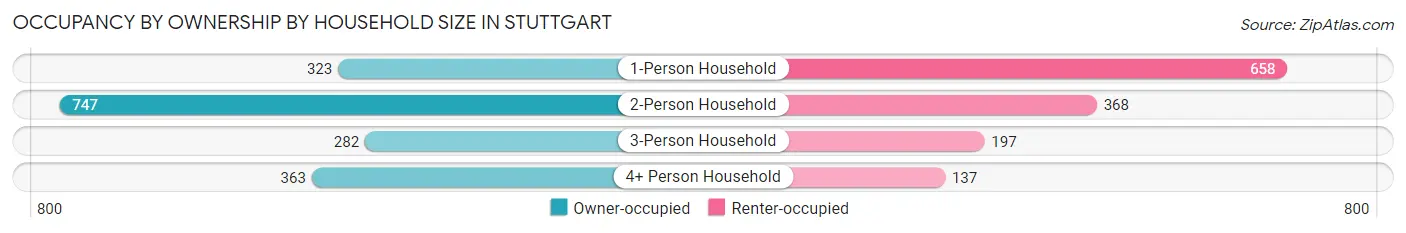
| Household Size | Owner-occupied | Renter-occupied |
| 1-Person Household | 323 (32.9%) | 658 (67.1%) |
| 2-Person Household | 747 (67.0%) | 368 (33.0%) |
| 3-Person Household | 282 (58.9%) | 197 (41.1%) |
| 4+ Person Household | 363 (72.6%) | 137 (27.4%) |
| Total Housing Units | 1,715 (55.8%) | 1,360 (44.2%) |
Occupancy by Educational Attainment in Stuttgart
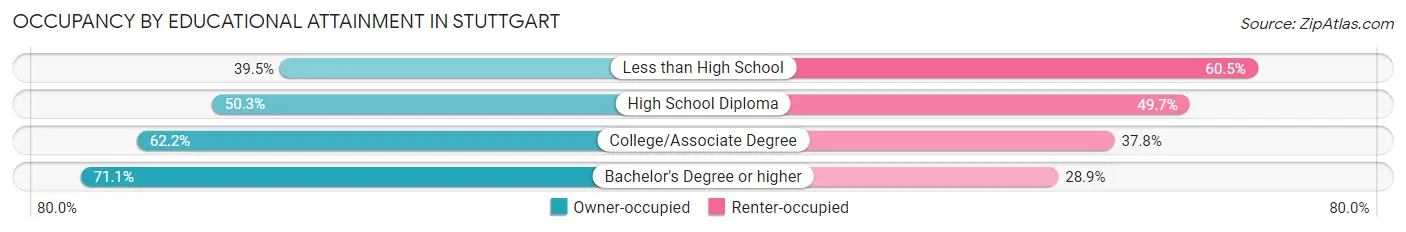
| Household Size | Owner-occupied | Renter-occupied |
| Less than High School | 188 (39.5%) | 288 (60.5%) |
| High School Diploma | 598 (50.3%) | 591 (49.7%) |
| College/Associate Degree | 513 (62.2%) | 312 (37.8%) |
| Bachelor's Degree or higher | 416 (71.1%) | 169 (28.9%) |
Occupancy by Age of Householder in Stuttgart
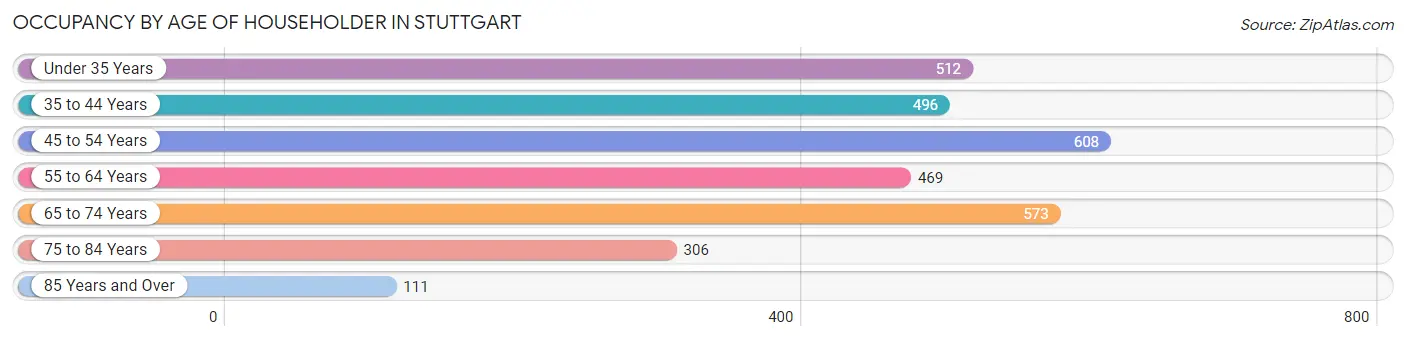
| Age Bracket | # Households | % Households |
| Under 35 Years | 512 | 16.7% |
| 35 to 44 Years | 496 | 16.1% |
| 45 to 54 Years | 608 | 19.8% |
| 55 to 64 Years | 469 | 15.2% |
| 65 to 74 Years | 573 | 18.6% |
| 75 to 84 Years | 306 | 10.0% |
| 85 Years and Over | 111 | 3.6% |
| Total | 3,075 | 100.0% |
Housing Finances in Stuttgart
Median Income by Occupancy in Stuttgart
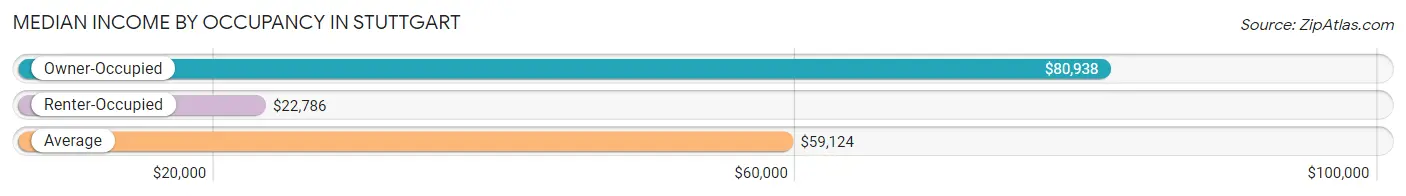
| Occupancy Type | # Households | Median Income |
| Owner-Occupied | 1,715 (55.8%) | $80,938 |
| Renter-Occupied | 1,360 (44.2%) | $22,786 |
| Average | 3,075 (100.0%) | $59,124 |
Occupancy by Householder Income Bracket in Stuttgart
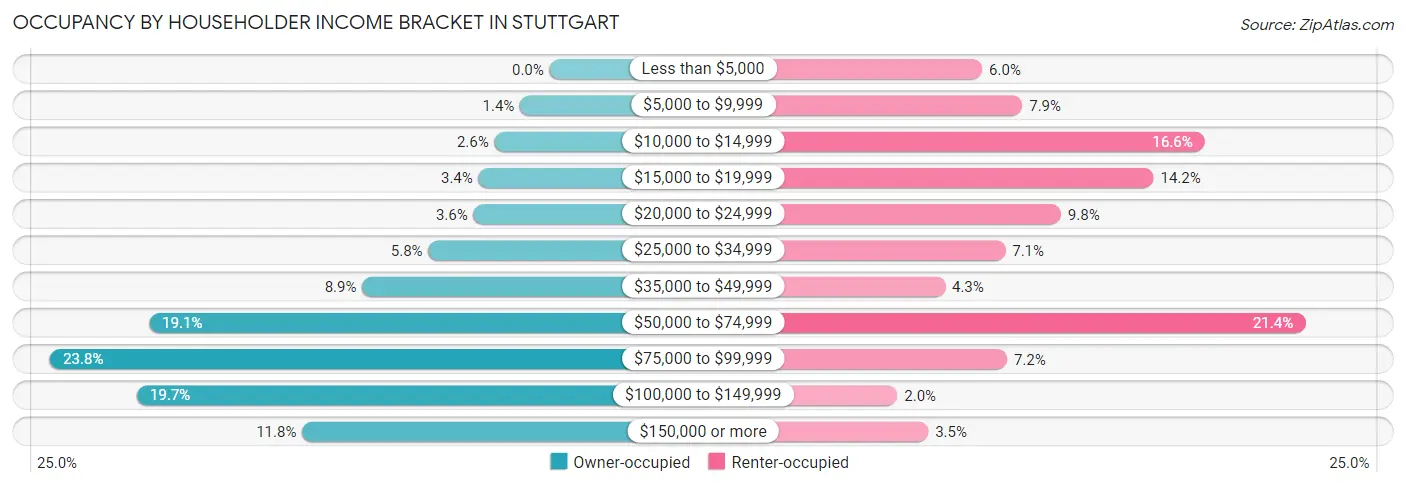
| Income Bracket | Owner-occupied | Renter-occupied |
| Less than $5,000 | 0 (0.0%) | 82 (6.0%) |
| $5,000 to $9,999 | 24 (1.4%) | 108 (7.9%) |
| $10,000 to $14,999 | 45 (2.6%) | 226 (16.6%) |
| $15,000 to $19,999 | 58 (3.4%) | 193 (14.2%) |
| $20,000 to $24,999 | 62 (3.6%) | 133 (9.8%) |
| $25,000 to $34,999 | 99 (5.8%) | 97 (7.1%) |
| $35,000 to $49,999 | 153 (8.9%) | 58 (4.3%) |
| $50,000 to $74,999 | 327 (19.1%) | 291 (21.4%) |
| $75,000 to $99,999 | 408 (23.8%) | 98 (7.2%) |
| $100,000 to $149,999 | 337 (19.7%) | 27 (2.0%) |
| $150,000 or more | 202 (11.8%) | 47 (3.5%) |
| Total | 1,715 (100.0%) | 1,360 (100.0%) |
Monthly Housing Cost Tiers in Stuttgart
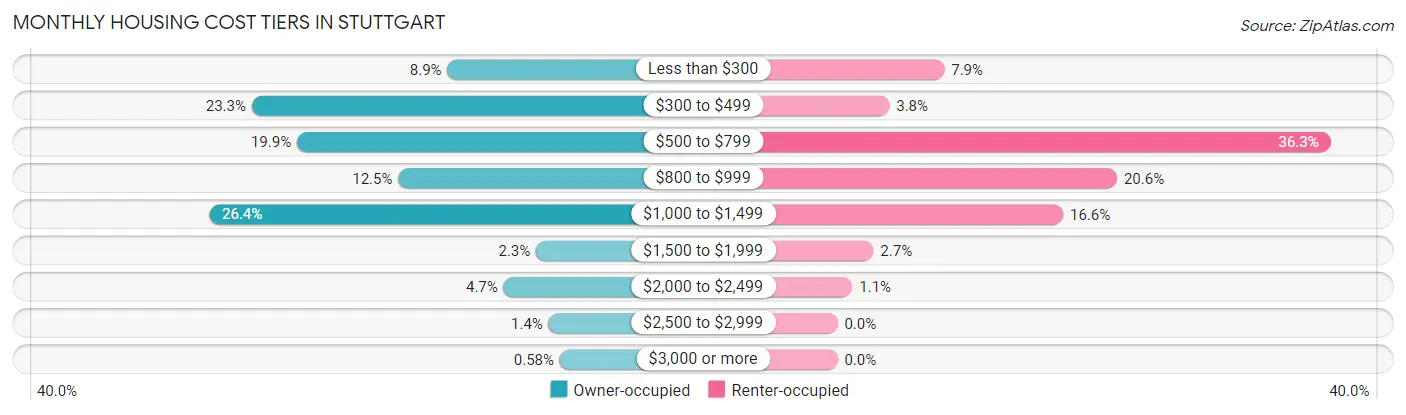
| Monthly Cost | Owner-occupied | Renter-occupied |
| Less than $300 | 152 (8.9%) | 107 (7.9%) |
| $300 to $499 | 399 (23.3%) | 52 (3.8%) |
| $500 to $799 | 342 (19.9%) | 494 (36.3%) |
| $800 to $999 | 214 (12.5%) | 280 (20.6%) |
| $1,000 to $1,499 | 453 (26.4%) | 226 (16.6%) |
| $1,500 to $1,999 | 40 (2.3%) | 36 (2.6%) |
| $2,000 to $2,499 | 81 (4.7%) | 15 (1.1%) |
| $2,500 to $2,999 | 24 (1.4%) | 0 (0.0%) |
| $3,000 or more | 10 (0.6%) | 0 (0.0%) |
| Total | 1,715 (100.0%) | 1,360 (100.0%) |
Physical Housing Characteristics in Stuttgart
Housing Structures in Stuttgart
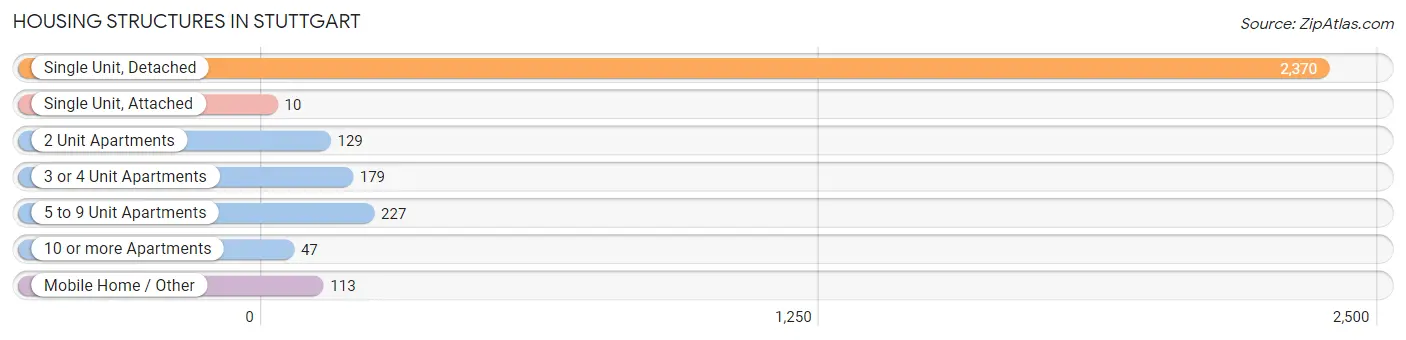
| Structure Type | # Housing Units | % Housing Units |
| Single Unit, Detached | 2,370 | 77.1% |
| Single Unit, Attached | 10 | 0.3% |
| 2 Unit Apartments | 129 | 4.2% |
| 3 or 4 Unit Apartments | 179 | 5.8% |
| 5 to 9 Unit Apartments | 227 | 7.4% |
| 10 or more Apartments | 47 | 1.5% |
| Mobile Home / Other | 113 | 3.7% |
| Total | 3,075 | 100.0% |
Housing Structures by Occupancy in Stuttgart
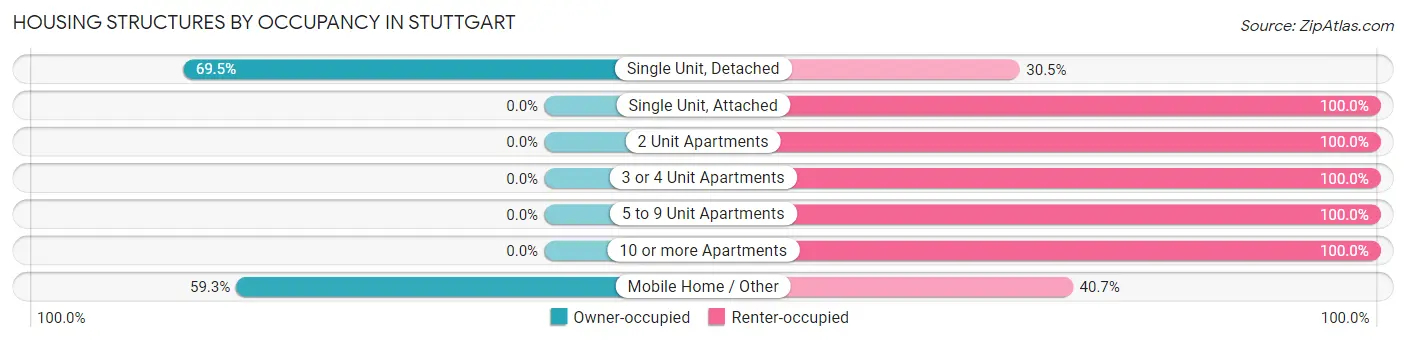
| Structure Type | Owner-occupied | Renter-occupied |
| Single Unit, Detached | 1,648 (69.5%) | 722 (30.5%) |
| Single Unit, Attached | 0 (0.0%) | 10 (100.0%) |
| 2 Unit Apartments | 0 (0.0%) | 129 (100.0%) |
| 3 or 4 Unit Apartments | 0 (0.0%) | 179 (100.0%) |
| 5 to 9 Unit Apartments | 0 (0.0%) | 227 (100.0%) |
| 10 or more Apartments | 0 (0.0%) | 47 (100.0%) |
| Mobile Home / Other | 67 (59.3%) | 46 (40.7%) |
| Total | 1,715 (55.8%) | 1,360 (44.2%) |
Housing Structures by Number of Rooms in Stuttgart
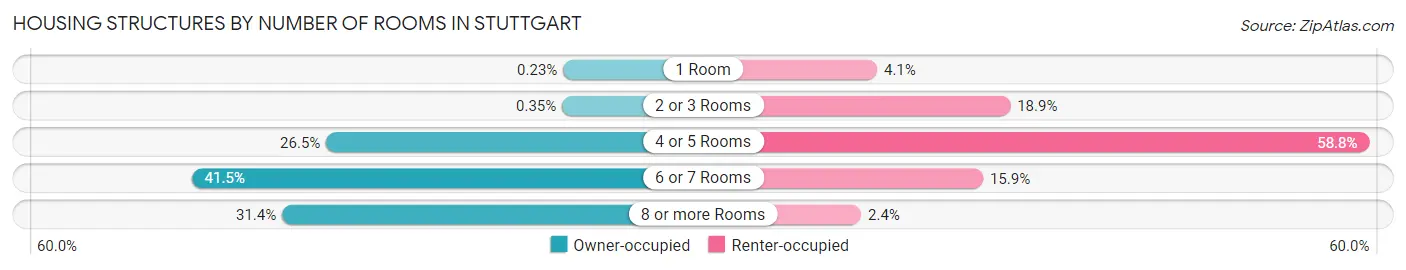
| Number of Rooms | Owner-occupied | Renter-occupied |
| 1 Room | 4 (0.2%) | 56 (4.1%) |
| 2 or 3 Rooms | 6 (0.4%) | 257 (18.9%) |
| 4 or 5 Rooms | 455 (26.5%) | 799 (58.8%) |
| 6 or 7 Rooms | 711 (41.5%) | 216 (15.9%) |
| 8 or more Rooms | 539 (31.4%) | 32 (2.4%) |
| Total | 1,715 (100.0%) | 1,360 (100.0%) |
Housing Structure by Heating Type in Stuttgart
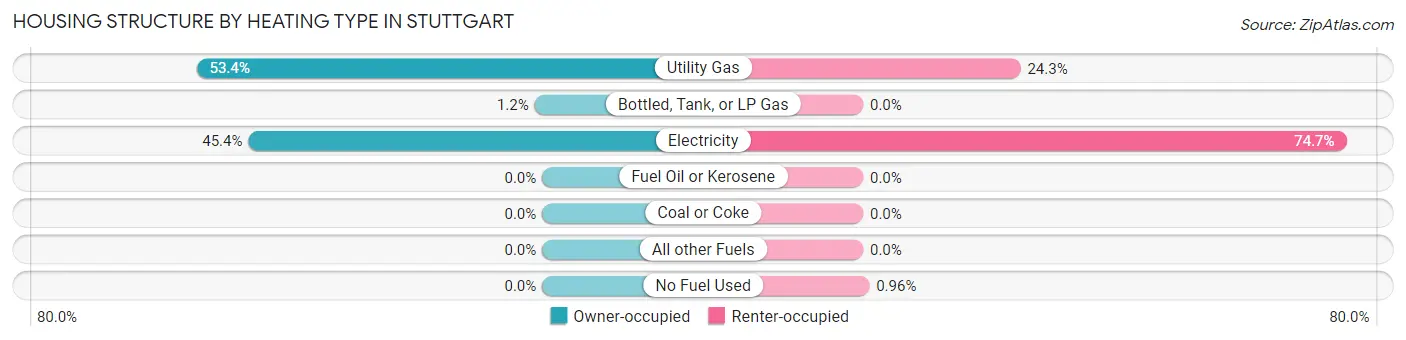
| Heating Type | Owner-occupied | Renter-occupied |
| Utility Gas | 916 (53.4%) | 331 (24.3%) |
| Bottled, Tank, or LP Gas | 20 (1.2%) | 0 (0.0%) |
| Electricity | 779 (45.4%) | 1,016 (74.7%) |
| Fuel Oil or Kerosene | 0 (0.0%) | 0 (0.0%) |
| Coal or Coke | 0 (0.0%) | 0 (0.0%) |
| All other Fuels | 0 (0.0%) | 0 (0.0%) |
| No Fuel Used | 0 (0.0%) | 13 (1.0%) |
| Total | 1,715 (100.0%) | 1,360 (100.0%) |
Household Vehicle Usage in Stuttgart
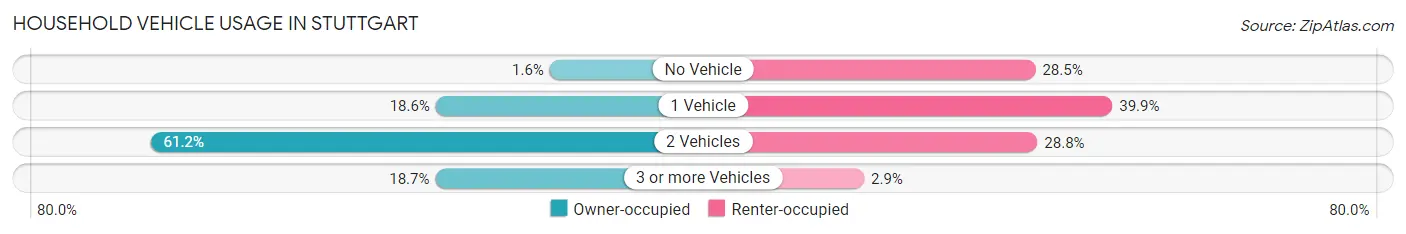
| Vehicles per Household | Owner-occupied | Renter-occupied |
| No Vehicle | 27 (1.6%) | 387 (28.5%) |
| 1 Vehicle | 319 (18.6%) | 543 (39.9%) |
| 2 Vehicles | 1,049 (61.2%) | 391 (28.7%) |
| 3 or more Vehicles | 320 (18.7%) | 39 (2.9%) |
| Total | 1,715 (100.0%) | 1,360 (100.0%) |
Real Estate & Mortgages in Stuttgart
Real Estate and Mortgage Overview in Stuttgart
| Characteristic | Without Mortgage | With Mortgage |
| Housing Units | 862 | 853 |
| Median Property Value | $151,500 | $150,100 |
| Median Household Income | $71,350 | $89 |
| Monthly Housing Costs | $450 | $10 |
| Real Estate Taxes | $823 | $52 |
Property Value by Mortgage Status in Stuttgart
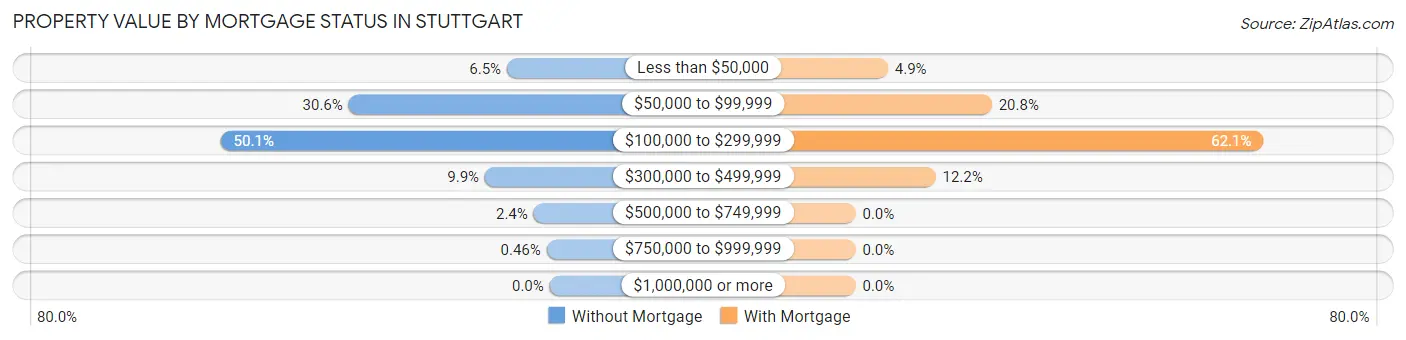
| Property Value | Without Mortgage | With Mortgage |
| Less than $50,000 | 56 (6.5%) | 42 (4.9%) |
| $50,000 to $99,999 | 264 (30.6%) | 177 (20.7%) |
| $100,000 to $299,999 | 432 (50.1%) | 530 (62.1%) |
| $300,000 to $499,999 | 85 (9.9%) | 104 (12.2%) |
| $500,000 to $749,999 | 21 (2.4%) | 0 (0.0%) |
| $750,000 to $999,999 | 4 (0.5%) | 0 (0.0%) |
| $1,000,000 or more | 0 (0.0%) | 0 (0.0%) |
| Total | 862 (100.0%) | 853 (100.0%) |
Household Income by Mortgage Status in Stuttgart
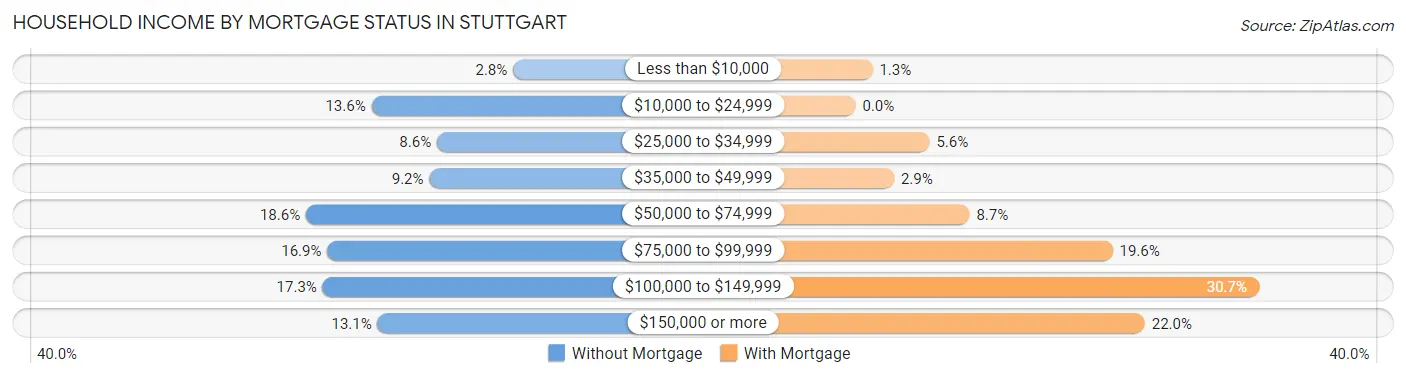
| Household Income | Without Mortgage | With Mortgage |
| Less than $10,000 | 24 (2.8%) | 11 (1.3%) |
| $10,000 to $24,999 | 117 (13.6%) | 0 (0.0%) |
| $25,000 to $34,999 | 74 (8.6%) | 48 (5.6%) |
| $35,000 to $49,999 | 79 (9.2%) | 25 (2.9%) |
| $50,000 to $74,999 | 160 (18.6%) | 74 (8.7%) |
| $75,000 to $99,999 | 146 (16.9%) | 167 (19.6%) |
| $100,000 to $149,999 | 149 (17.3%) | 262 (30.7%) |
| $150,000 or more | 113 (13.1%) | 188 (22.0%) |
| Total | 862 (100.0%) | 853 (100.0%) |
Property Value to Household Income Ratio in Stuttgart
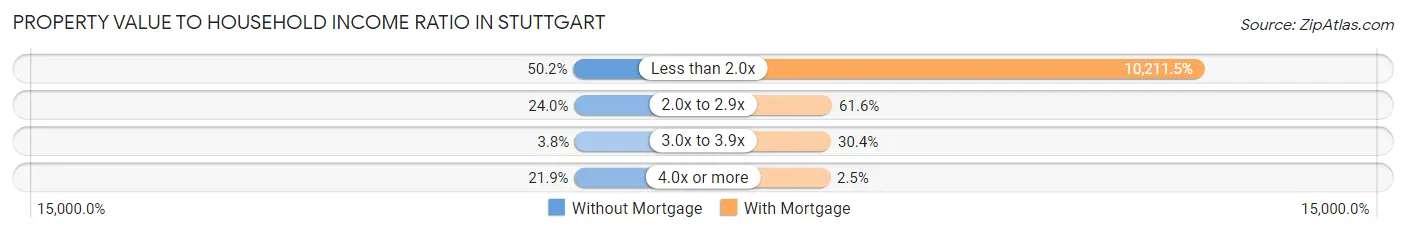
| Value-to-Income Ratio | Without Mortgage | With Mortgage |
| Less than 2.0x | 433 (50.2%) | 87,104 (10,211.5%) |
| 2.0x to 2.9x | 207 (24.0%) | 525 (61.6%) |
| 3.0x to 3.9x | 33 (3.8%) | 259 (30.4%) |
| 4.0x or more | 189 (21.9%) | 21 (2.5%) |
| Total | 862 (100.0%) | 853 (100.0%) |
Real Estate Taxes by Mortgage Status in Stuttgart
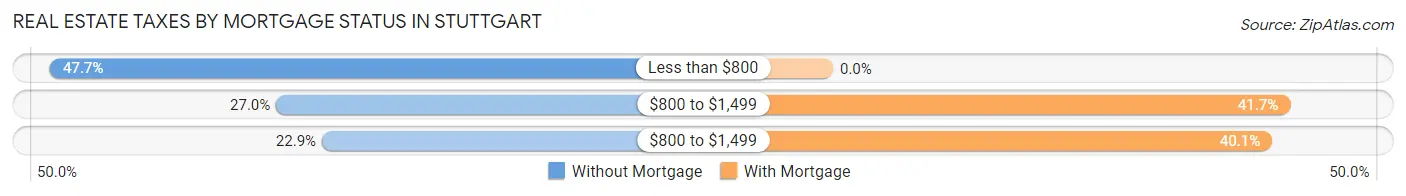
| Property Taxes | Without Mortgage | With Mortgage |
| Less than $800 | 411 (47.7%) | 0 (0.0%) |
| $800 to $1,499 | 233 (27.0%) | 356 (41.7%) |
| $800 to $1,499 | 197 (22.9%) | 342 (40.1%) |
| Total | 862 (100.0%) | 853 (100.0%) |
Health & Disability in Stuttgart
Health Insurance Coverage by Age in Stuttgart
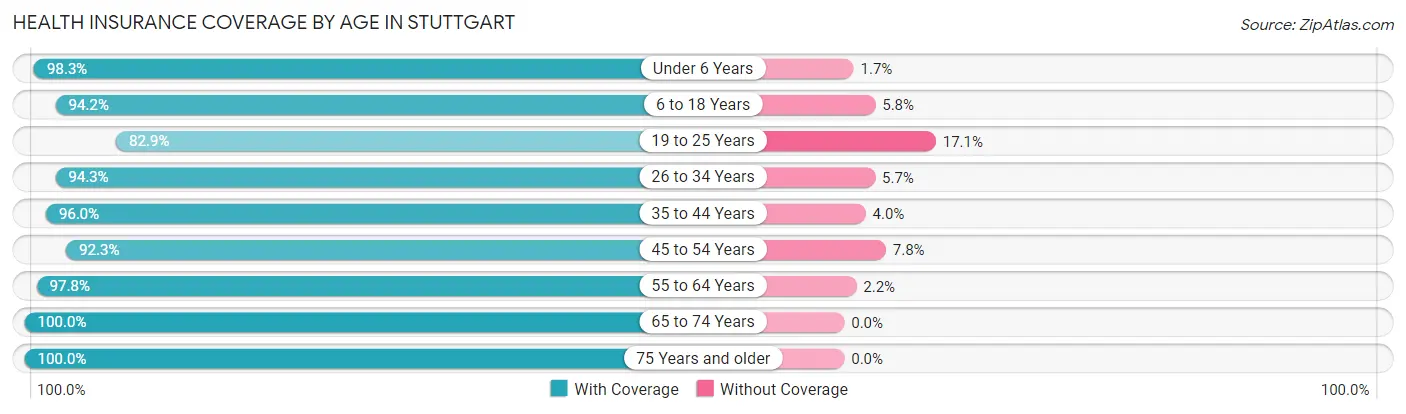
| Age Bracket | With Coverage | Without Coverage |
| Under 6 Years | 732 (98.3%) | 13 (1.7%) |
| 6 to 18 Years | 1,320 (94.2%) | 81 (5.8%) |
| 19 to 25 Years | 457 (82.9%) | 94 (17.1%) |
| 26 to 34 Years | 887 (94.3%) | 54 (5.7%) |
| 35 to 44 Years | 943 (96.0%) | 39 (4.0%) |
| 45 to 54 Years | 1,012 (92.2%) | 85 (7.7%) |
| 55 to 64 Years | 874 (97.8%) | 20 (2.2%) |
| 65 to 74 Years | 903 (100.0%) | 0 (0.0%) |
| 75 Years and older | 600 (100.0%) | 0 (0.0%) |
| Total | 7,728 (95.2%) | 386 (4.8%) |
Health Insurance Coverage by Citizenship Status in Stuttgart
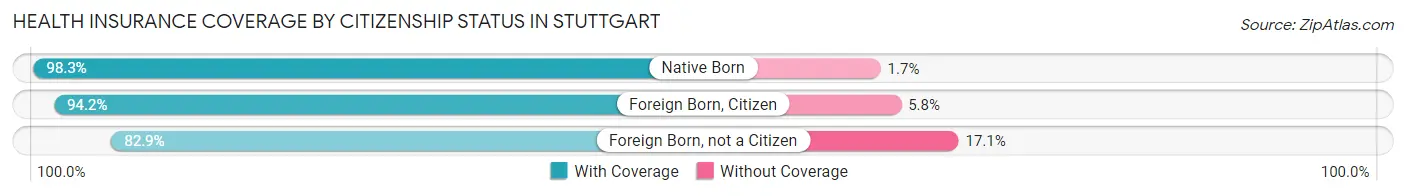
| Citizenship Status | With Coverage | Without Coverage |
| Native Born | 732 (98.3%) | 13 (1.7%) |
| Foreign Born, Citizen | 1,320 (94.2%) | 81 (5.8%) |
| Foreign Born, not a Citizen | 457 (82.9%) | 94 (17.1%) |
Health Insurance Coverage by Household Income in Stuttgart
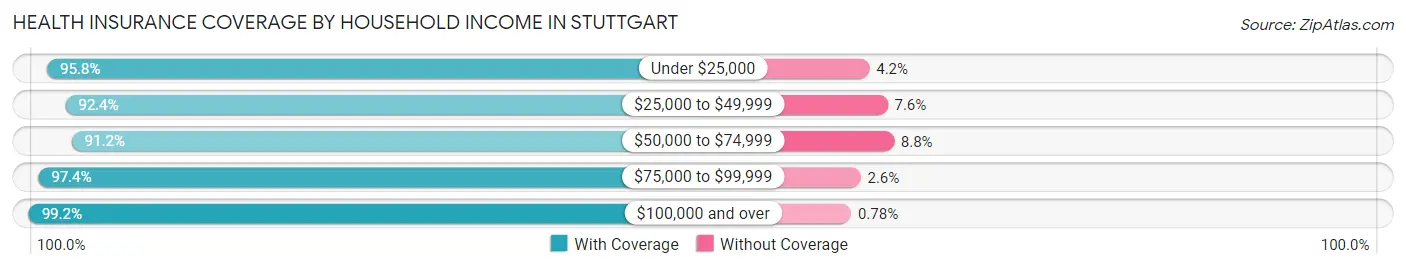
| Household Income | With Coverage | Without Coverage |
| Under $25,000 | 1,525 (95.8%) | 67 (4.2%) |
| $25,000 to $49,999 | 957 (92.4%) | 79 (7.6%) |
| $50,000 to $74,999 | 1,861 (91.2%) | 180 (8.8%) |
| $75,000 to $99,999 | 1,706 (97.4%) | 45 (2.6%) |
| $100,000 and over | 1,662 (99.2%) | 13 (0.8%) |
Public vs Private Health Insurance Coverage by Age in Stuttgart
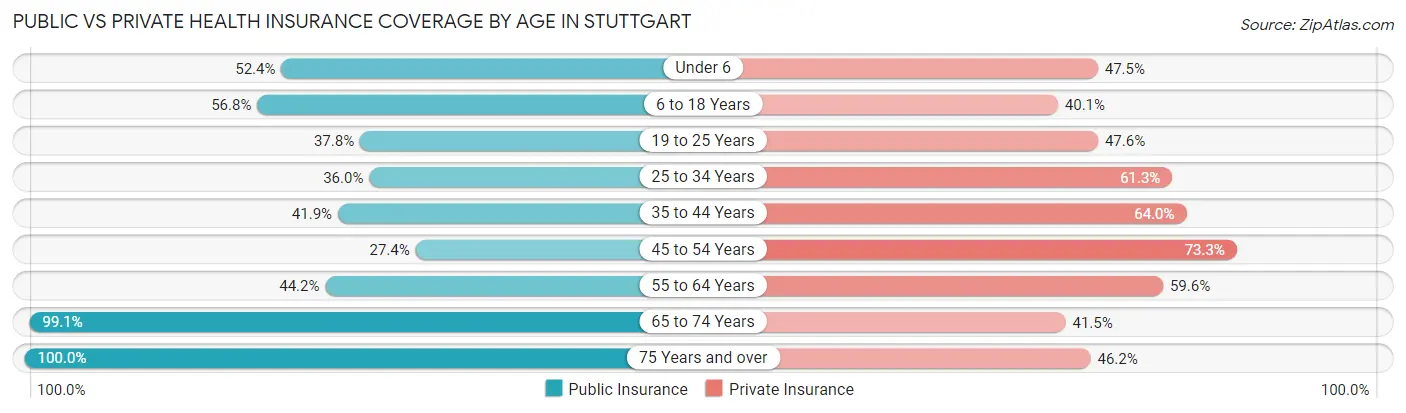
| Age Bracket | Public Insurance | Private Insurance |
| Under 6 | 390 (52.3%) | 354 (47.5%) |
| 6 to 18 Years | 796 (56.8%) | 562 (40.1%) |
| 19 to 25 Years | 208 (37.8%) | 262 (47.5%) |
| 25 to 34 Years | 339 (36.0%) | 577 (61.3%) |
| 35 to 44 Years | 411 (41.8%) | 628 (63.9%) |
| 45 to 54 Years | 301 (27.4%) | 804 (73.3%) |
| 55 to 64 Years | 395 (44.2%) | 533 (59.6%) |
| 65 to 74 Years | 895 (99.1%) | 375 (41.5%) |
| 75 Years and over | 600 (100.0%) | 277 (46.2%) |
| Total | 4,335 (53.4%) | 4,372 (53.9%) |
Disability Status by Sex by Age in Stuttgart
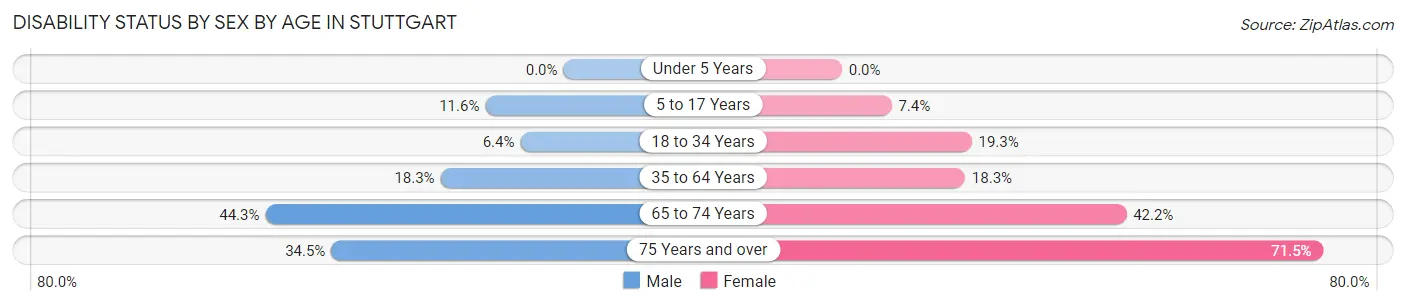
| Age Bracket | Male | Female |
| Under 5 Years | 0 (0.0%) | 0 (0.0%) |
| 5 to 17 Years | 69 (11.6%) | 54 (7.4%) |
| 18 to 34 Years | 54 (6.4%) | 154 (19.3%) |
| 35 to 64 Years | 256 (18.2%) | 287 (18.3%) |
| 65 to 74 Years | 189 (44.3%) | 201 (42.2%) |
| 75 Years and over | 81 (34.5%) | 261 (71.5%) |
Disability Class by Sex by Age in Stuttgart
Disability Class: Hearing Difficulty
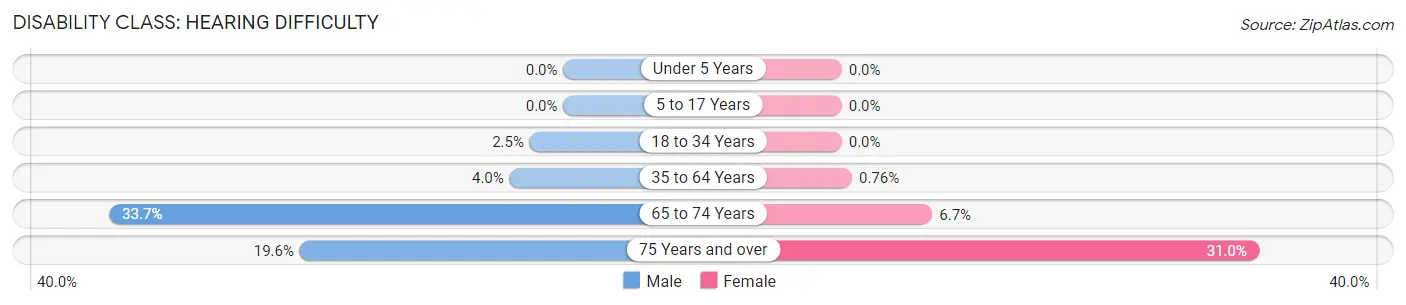
| Age Bracket | Male | Female |
| Under 5 Years | 0 (0.0%) | 0 (0.0%) |
| 5 to 17 Years | 0 (0.0%) | 0 (0.0%) |
| 18 to 34 Years | 21 (2.5%) | 0 (0.0%) |
| 35 to 64 Years | 56 (4.0%) | 12 (0.8%) |
| 65 to 74 Years | 144 (33.7%) | 32 (6.7%) |
| 75 Years and over | 46 (19.6%) | 113 (31.0%) |
Disability Class: Vision Difficulty
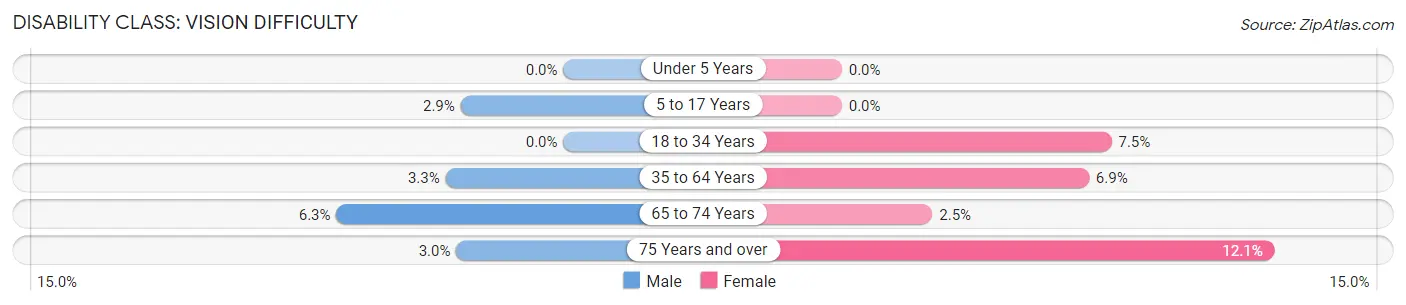
| Age Bracket | Male | Female |
| Under 5 Years | 0 (0.0%) | 0 (0.0%) |
| 5 to 17 Years | 17 (2.9%) | 0 (0.0%) |
| 18 to 34 Years | 0 (0.0%) | 60 (7.5%) |
| 35 to 64 Years | 46 (3.3%) | 108 (6.9%) |
| 65 to 74 Years | 27 (6.3%) | 12 (2.5%) |
| 75 Years and over | 7 (3.0%) | 44 (12.0%) |
Disability Class: Cognitive Difficulty
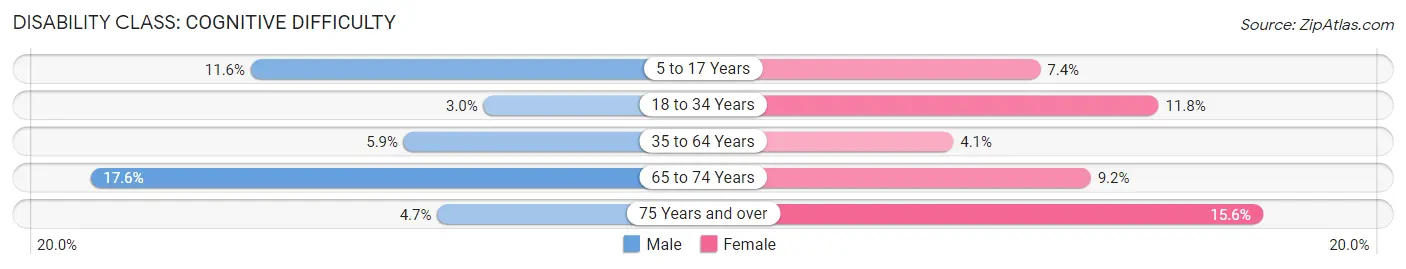
| Age Bracket | Male | Female |
| 5 to 17 Years | 69 (11.6%) | 54 (7.4%) |
| 18 to 34 Years | 25 (3.0%) | 94 (11.8%) |
| 35 to 64 Years | 83 (5.9%) | 65 (4.1%) |
| 65 to 74 Years | 75 (17.6%) | 44 (9.2%) |
| 75 Years and over | 11 (4.7%) | 57 (15.6%) |
Disability Class: Ambulatory Difficulty
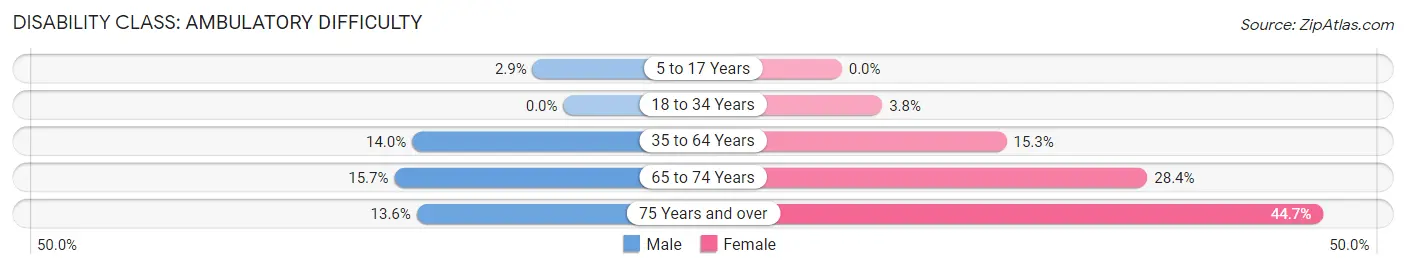
| Age Bracket | Male | Female |
| 5 to 17 Years | 17 (2.9%) | 0 (0.0%) |
| 18 to 34 Years | 0 (0.0%) | 30 (3.7%) |
| 35 to 64 Years | 197 (14.0%) | 240 (15.3%) |
| 65 to 74 Years | 67 (15.7%) | 135 (28.4%) |
| 75 Years and over | 32 (13.6%) | 163 (44.7%) |
Disability Class: Self-Care Difficulty
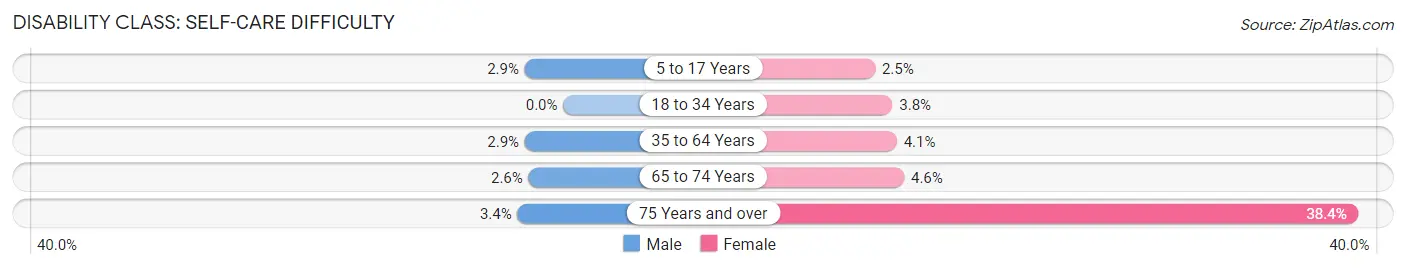
| Age Bracket | Male | Female |
| 5 to 17 Years | 17 (2.9%) | 18 (2.5%) |
| 18 to 34 Years | 0 (0.0%) | 30 (3.7%) |
| 35 to 64 Years | 40 (2.9%) | 64 (4.1%) |
| 65 to 74 Years | 11 (2.6%) | 22 (4.6%) |
| 75 Years and over | 8 (3.4%) | 140 (38.4%) |
Technology Access in Stuttgart
Computing Device Access in Stuttgart
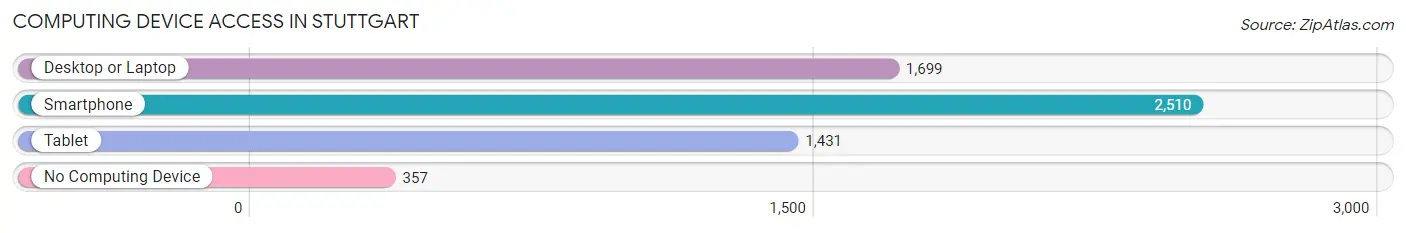
| Device Type | # Households | % Households |
| Desktop or Laptop | 1,699 | 55.2% |
| Smartphone | 2,510 | 81.6% |
| Tablet | 1,431 | 46.5% |
| No Computing Device | 357 | 11.6% |
| Total | 3,075 | 100.0% |
Internet Access in Stuttgart
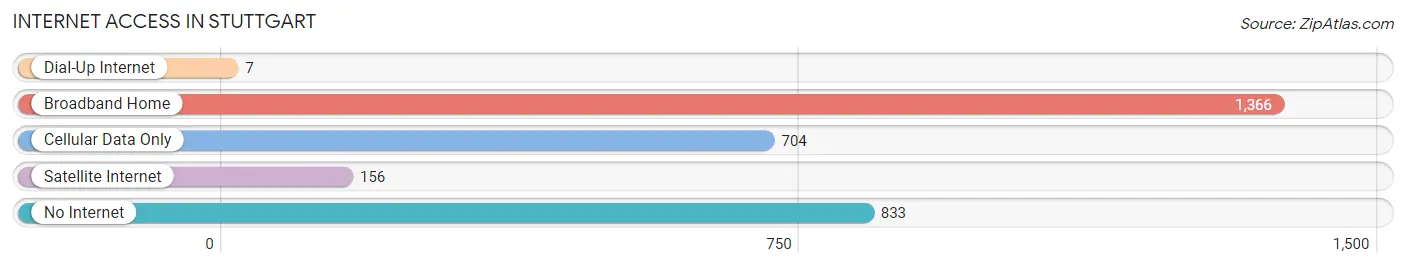
| Internet Type | # Households | % Households |
| Dial-Up Internet | 7 | 0.2% |
| Broadband Home | 1,366 | 44.4% |
| Cellular Data Only | 704 | 22.9% |
| Satellite Internet | 156 | 5.1% |
| No Internet | 833 | 27.1% |
| Total | 3,075 | 100.0% |
Stuttgart Summary
Stuttgart, Arkansas is a city located in the Arkansas Delta region of Arkansas. It is the county seat of Arkansas County and is located in the center of the county. The city is located on the banks of the Arkansas River and is home to a population of approximately 10,000 people.
History
Stuttgart was founded in 1878 by German immigrants who were looking for a place to settle and start a new life. The city was named after the German city of Stuttgart, and the settlers brought with them many of the customs and traditions of their homeland. The city was incorporated in 1884 and quickly became a thriving agricultural center. The city was known for its production of rice, cotton, and other crops.
In the early 1900s, Stuttgart was a major hub for the railroad industry. The city was home to several major railroads, including the St. Louis, Iron Mountain and Southern Railway, the Missouri Pacific Railroad, and the Arkansas Midland Railroad. The railroads brought a great deal of economic growth to the city and helped to make it a major transportation hub.
Geography
Stuttgart is located in the Arkansas Delta region of Arkansas. The city is situated on the banks of the Arkansas River and is surrounded by flat, fertile farmland. The city is located in the center of Arkansas County and is approximately 60 miles southeast of Little Rock. The city has a total area of 8.3 square miles, all of which is land.
Economy
Stuttgart is a major agricultural center in the Arkansas Delta region. The city is home to several large rice mills and is a major producer of rice, cotton, and other crops. The city is also home to several large poultry processing plants, which employ a large number of people in the area.
The city is also home to several manufacturing companies, including a large automotive parts manufacturer and a large furniture manufacturer. The city is also home to several retail stores, including a Walmart Supercenter and several other large retail stores.
Demographics
As of the 2010 census, Stuttgart had a population of 9,326 people. The racial makeup of the city was 75.3% White, 21.2% African American, 0.3% Native American, 0.7% Asian, 0.1% Pacific Islander, and 2.4% from other races. Hispanic or Latino of any race were 2.7% of the population.
The median income for a household in Stuttgart was $30,945, and the median income for a family was $37,917. The per capita income for the city was $17,845. About 17.2% of families and 20.3% of the population were below the poverty line, including 28.2% of those under age 18 and 14.2% of those age 65 or over.
Stuttgart is a diverse city with a rich history and a vibrant economy. The city is home to a variety of businesses and industries, and is a major agricultural center in the Arkansas Delta region. The city is also home to a large number of retail stores and restaurants, making it a great place to live and work.
Common Questions
What is the Total Population of Stuttgart?
Total Population of Stuttgart is 8,189.
What is the Total Male Population of Stuttgart?
Total Male Population of Stuttgart is 3,858.
What is the Total Female Population of Stuttgart?
Total Female Population of Stuttgart is 4,331.
What is the Ratio of Males per 100 Females in Stuttgart?
There are 89.08 Males per 100 Females in Stuttgart.
What is the Ratio of Females per 100 Males in Stuttgart?
There are 112.26 Females per 100 Males in Stuttgart.
What is the Median Population Age in Stuttgart?
Median Population Age in Stuttgart is 37.8 Years.
What is the Average Family Size in Stuttgart
Average Family Size in Stuttgart is 3.3 People.
What is the Average Household Size in Stuttgart
Average Household Size in Stuttgart is 2.6 People.
What is Per Capita Income in Stuttgart?
Per Capita income in Stuttgart is $26,210.
What is the Median Family Income in Stuttgart?
Median Family Income in Stuttgart is $70,729.
What is the Median Household income in Stuttgart?
Median Household Income in Stuttgart is $59,124.
What is Income or Wage Gap in Stuttgart?
Income or Wage Gap in Stuttgart is 45.3%.
Women in Stuttgart earn 54.7 cents for every dollar earned by a man.
What is Inequality or Gini Index in Stuttgart?
Inequality or Gini Index in Stuttgart is 0.43.
How Large is the Labor Force in Stuttgart?
There are 3,684 People in the Labor Forcein in Stuttgart.
What is the Percentage of People in the Labor Force in Stuttgart?
58.1% of People are in the Labor Force in Stuttgart.
What is the Unemployment Rate in Stuttgart?
Unemployment Rate in Stuttgart is 8.7%.