Tontitown, AR
Tontitown Map
Tontitown Overview
5,114
TOTAL POPULATION
2,487
MALE POPULATION
2,627
FEMALE POPULATION
94.67
MALES / 100 FEMALES
105.63
FEMALES / 100 MALES
38.8
MEDIAN AGE
3.0
AVG FAMILY SIZE
2.7
AVG HOUSEHOLD SIZE
$45,000
PER CAPITA INCOME
$100,455
AVG FAMILY INCOME
$83,705
AVG HOUSEHOLD INCOME
22.4%
WAGE / INCOME GAP [ % ]
77.6¢/ $1
WAGE / INCOME GAP [ $ ]
0.45
INEQUALITY / GINI INDEX
3,049
LABOR FORCE [ PEOPLE ]
70.7%
PERCENT IN LABOR FORCE
2.5%
UNEMPLOYMENT RATE
Tontitown Area Codes
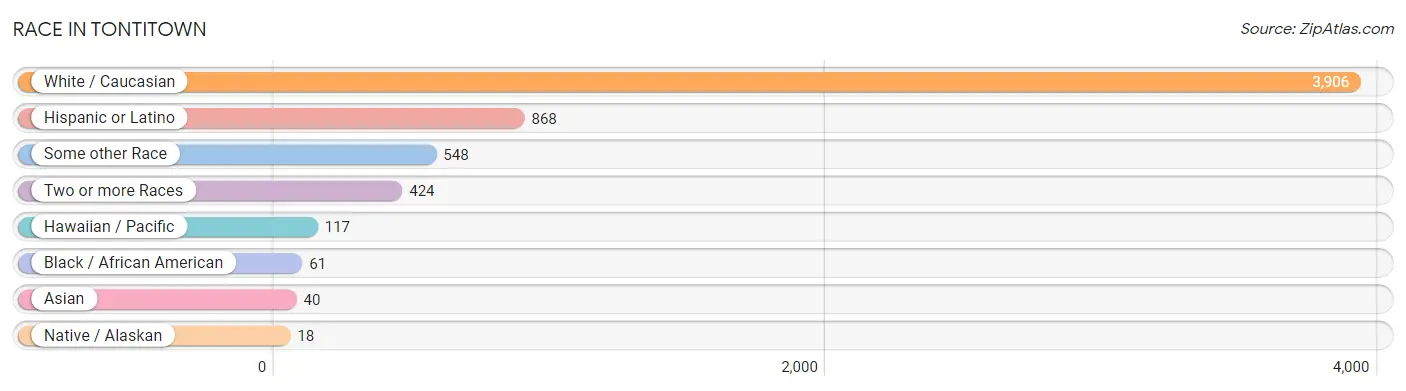
Race in Tontitown
The most populous races in Tontitown are White / Caucasian (3,906 | 76.4%), Hispanic or Latino (868 | 17.0%), and Some other Race (548 | 10.7%).
| Race | # Population | % Population |
| Asian | 40 | 0.8% |
| Black / African American | 61 | 1.2% |
| Hawaiian / Pacific | 117 | 2.3% |
| Hispanic or Latino | 868 | 17.0% |
| Native / Alaskan | 18 | 0.4% |
| White / Caucasian | 3,906 | 76.4% |
| Two or more Races | 424 | 8.3% |
| Some other Race | 548 | 10.7% |
| Total | 5,114 | 100.0% |
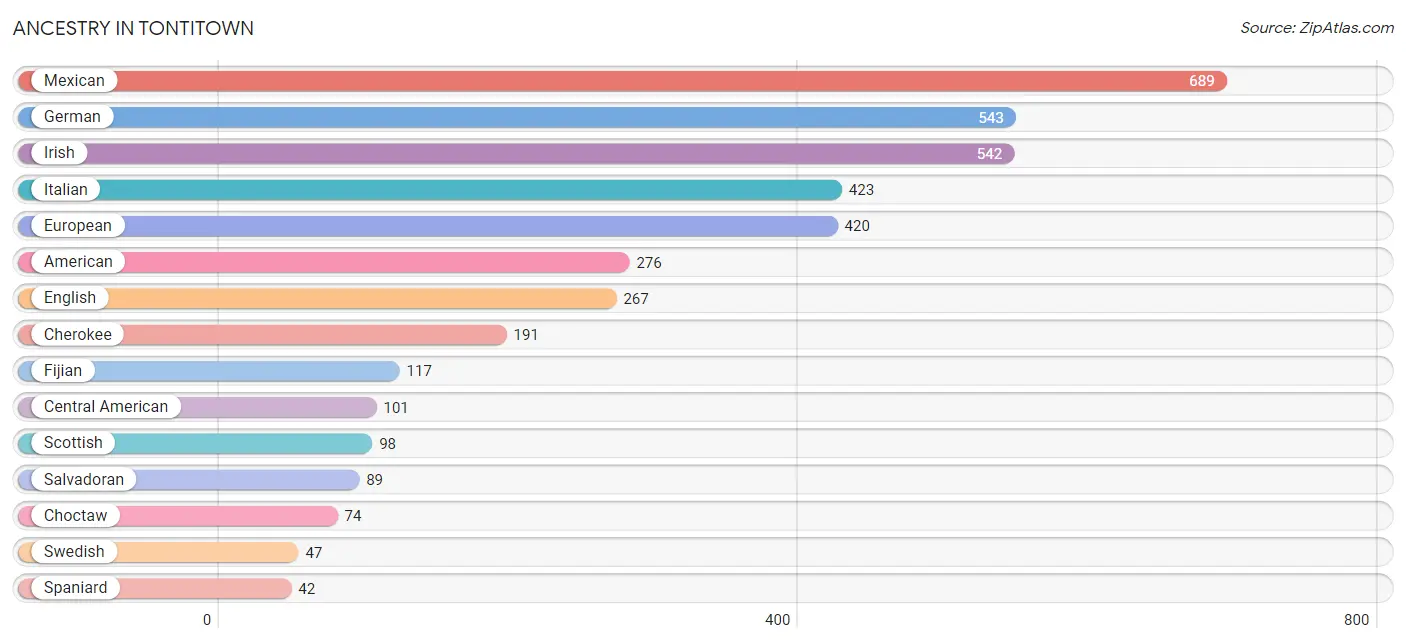
Ancestry in Tontitown
The most populous ancestries reported in Tontitown are Mexican (689 | 13.5%), German (543 | 10.6%), Irish (542 | 10.6%), Italian (423 | 8.3%), and European (420 | 8.2%), together accounting for 51.2% of all Tontitown residents.
| Ancestry | # Population | % Population |
| African | 35 | 0.7% |
| American | 276 | 5.4% |
| British | 18 | 0.4% |
| Central American | 101 | 2.0% |
| Central American Indian | 12 | 0.2% |
| Cherokee | 191 | 3.7% |
| Choctaw | 74 | 1.5% |
| Croatian | 19 | 0.4% |
| Dutch | 25 | 0.5% |
| Ecuadorian | 5 | 0.1% |
| English | 267 | 5.2% |
| European | 420 | 8.2% |
| Fijian | 117 | 2.3% |
| French | 39 | 0.8% |
| French Canadian | 11 | 0.2% |
| German | 543 | 10.6% |
| Honduran | 12 | 0.2% |
| Icelander | 8 | 0.2% |
| Indian (Asian) | 13 | 0.3% |
| Irish | 542 | 10.6% |
| Italian | 423 | 8.3% |
| Korean | 17 | 0.3% |
| Mexican | 689 | 13.5% |
| Polish | 4 | 0.1% |
| Potawatomi | 12 | 0.2% |
| Puerto Rican | 31 | 0.6% |
| Salvadoran | 89 | 1.7% |
| Scandinavian | 14 | 0.3% |
| Scotch-Irish | 40 | 0.8% |
| Scottish | 98 | 1.9% |
| South American | 5 | 0.1% |
| Spaniard | 42 | 0.8% |
| Sri Lankan | 4 | 0.1% |
| Subsaharan African | 35 | 0.7% |
| Swedish | 47 | 0.9% |
| Swiss | 4 | 0.1% |
| Thai | 23 | 0.4% |
| Welsh | 28 | 0.5% | View All 38 Rows |
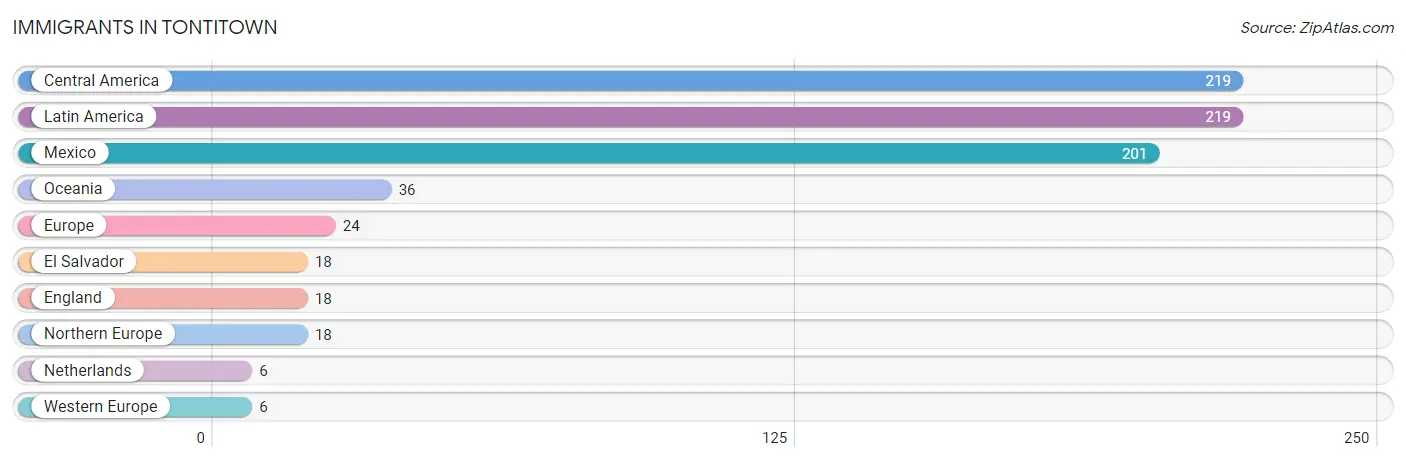
Immigrants in Tontitown
The most numerous immigrant groups reported in Tontitown came from Central America (219 | 4.3%), Latin America (219 | 4.3%), Mexico (201 | 3.9%), Oceania (36 | 0.7%), and Europe (24 | 0.5%), together accounting for 13.7% of all Tontitown residents.
| Immigration Origin | # Population | % Population |
| Central America | 219 | 4.3% |
| El Salvador | 18 | 0.4% |
| England | 18 | 0.4% |
| Europe | 24 | 0.5% |
| Latin America | 219 | 4.3% |
| Mexico | 201 | 3.9% |
| Netherlands | 6 | 0.1% |
| Northern Europe | 18 | 0.4% |
| Oceania | 36 | 0.7% |
| Western Europe | 6 | 0.1% | View All 10 Rows |
Sex and Age in Tontitown
Sex and Age in Tontitown
The most populous age groups in Tontitown are 35 to 39 Years (268 | 10.8%) for men and 15 to 19 Years (297 | 11.3%) for women.
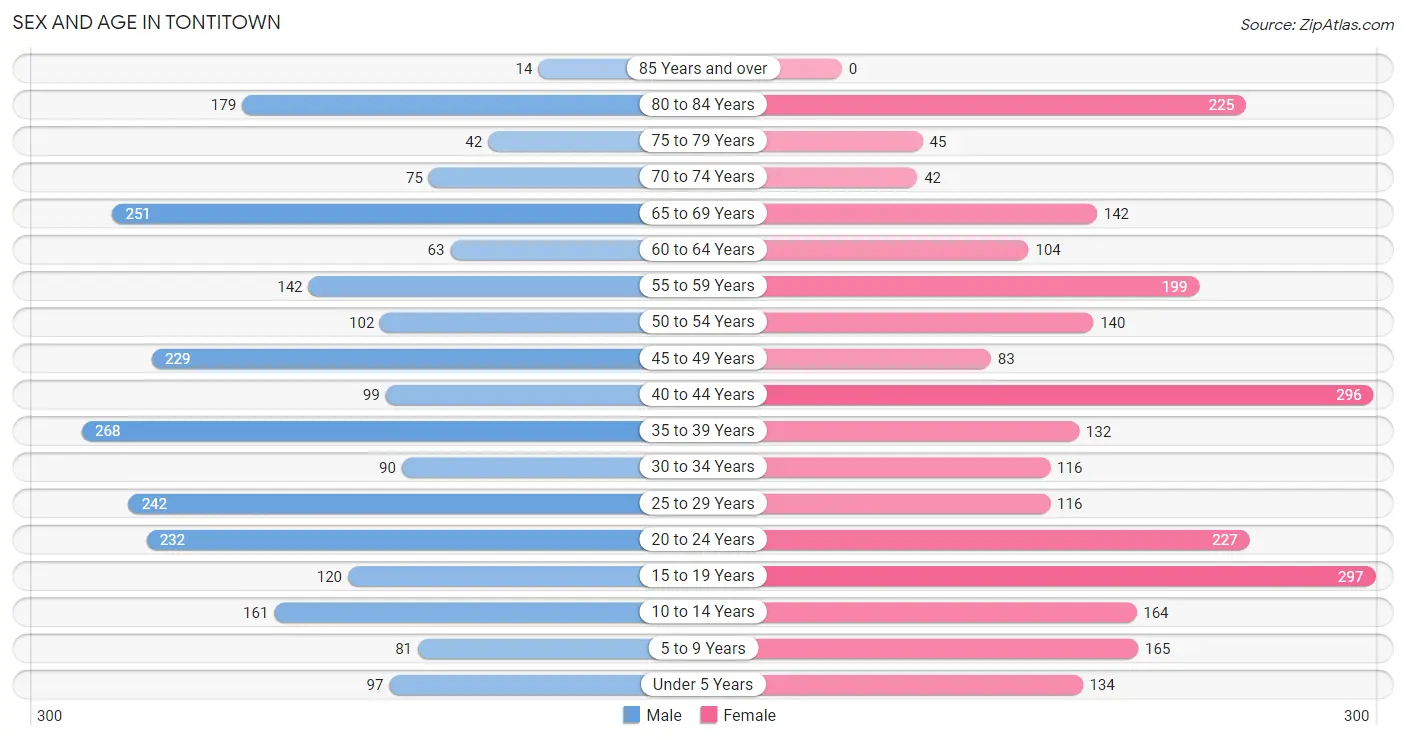
| Age Bracket | Male | Female |
| Under 5 Years | 97 (3.9%) | 134 (5.1%) |
| 5 to 9 Years | 81 (3.3%) | 165 (6.3%) |
| 10 to 14 Years | 161 (6.5%) | 164 (6.2%) |
| 15 to 19 Years | 120 (4.8%) | 297 (11.3%) |
| 20 to 24 Years | 232 (9.3%) | 227 (8.6%) |
| 25 to 29 Years | 242 (9.7%) | 116 (4.4%) |
| 30 to 34 Years | 90 (3.6%) | 116 (4.4%) |
| 35 to 39 Years | 268 (10.8%) | 132 (5.0%) |
| 40 to 44 Years | 99 (4.0%) | 296 (11.3%) |
| 45 to 49 Years | 229 (9.2%) | 83 (3.2%) |
| 50 to 54 Years | 102 (4.1%) | 140 (5.3%) |
| 55 to 59 Years | 142 (5.7%) | 199 (7.6%) |
| 60 to 64 Years | 63 (2.5%) | 104 (4.0%) |
| 65 to 69 Years | 251 (10.1%) | 142 (5.4%) |
| 70 to 74 Years | 75 (3.0%) | 42 (1.6%) |
| 75 to 79 Years | 42 (1.7%) | 45 (1.7%) |
| 80 to 84 Years | 179 (7.2%) | 225 (8.6%) |
| 85 Years and over | 14 (0.6%) | 0 (0.0%) |
| Total | 2,487 (100.0%) | 2,627 (100.0%) |
Families and Households in Tontitown
Median Family Size in Tontitown
The median family size in Tontitown is 3.01 persons per family, with married-couple families (1,364 | 87.8%) accounting for the largest median family size of 3.13 persons per family. On the other hand, single female/mother families (69 | 4.4%) represent the smallest median family size with 2.13 persons per family.
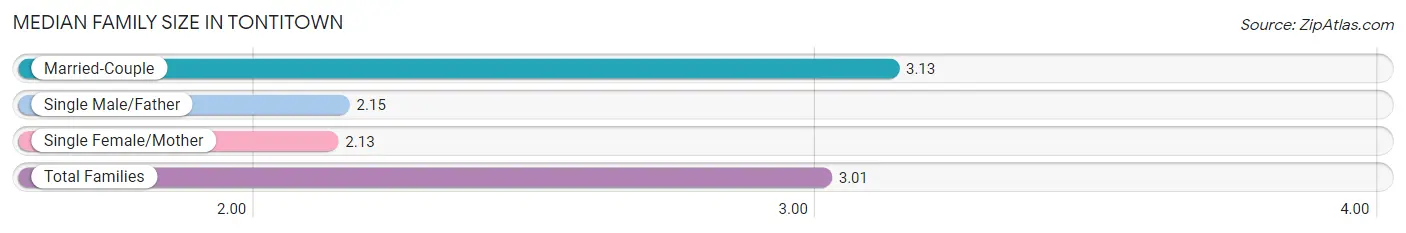
| Family Type | # Families | Family Size |
| Married-Couple | 1,364 (87.8%) | 3.13 |
| Single Male/Father | 121 (7.8%) | 2.15 |
| Single Female/Mother | 69 (4.4%) | 2.13 |
| Total Families | 1,554 (100.0%) | 3.01 |
Median Household Size in Tontitown
The median household size in Tontitown is 2.71 persons per household, with married-couple households (1,364 | 72.3%) accounting for the largest median household size of 3.14 persons per household. non-family households (333 | 17.6%) represent the smallest median household size with 1.16 persons per household.
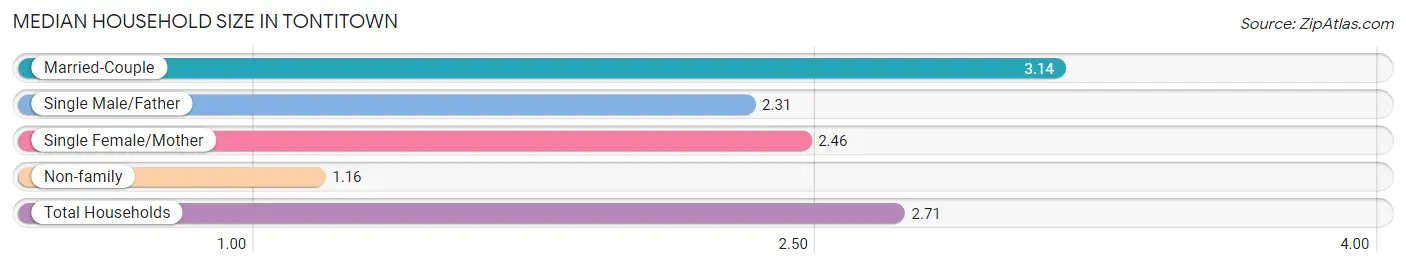
| Household Type | # Households | Household Size |
| Married-Couple | 1,364 (72.3%) | 3.14 |
| Single Male/Father | 121 (6.4%) | 2.31 |
| Single Female/Mother | 69 (3.7%) | 2.46 |
| Non-family | 333 (17.6%) | 1.16 |
| Total Households | 1,887 (100.0%) | 2.71 |
Household Size by Marriage Status in Tontitown
Out of a total of 1,887 households in Tontitown, 1,554 (82.4%) are family households, while 333 (17.6%) are nonfamily households. The most numerous type of family households are 2-person households, comprising 810, and the most common type of nonfamily households are 1-person households, comprising 294.
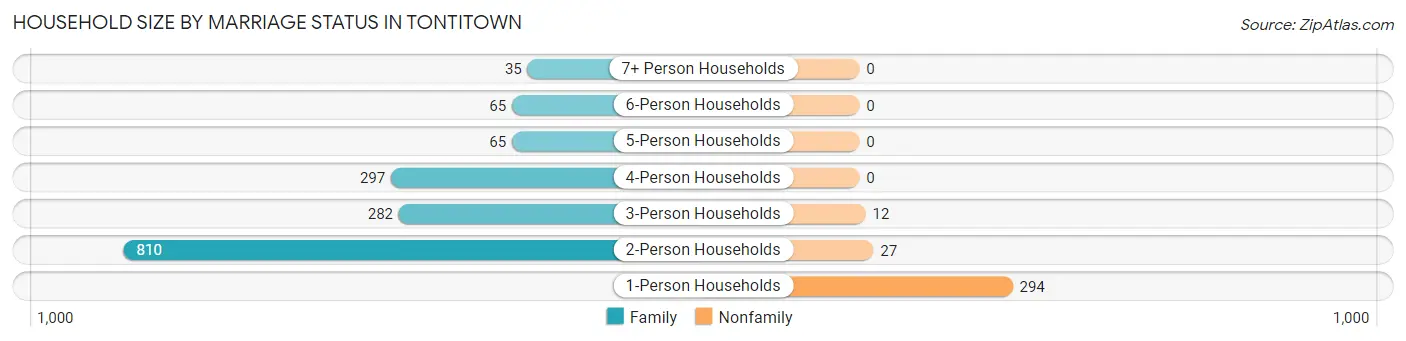
| Household Size | Family Households | Nonfamily Households |
| 1-Person Households | - | 294 (15.6%) |
| 2-Person Households | 810 (42.9%) | 27 (1.4%) |
| 3-Person Households | 282 (14.9%) | 12 (0.6%) |
| 4-Person Households | 297 (15.7%) | 0 (0.0%) |
| 5-Person Households | 65 (3.4%) | 0 (0.0%) |
| 6-Person Households | 65 (3.4%) | 0 (0.0%) |
| 7+ Person Households | 35 (1.8%) | 0 (0.0%) |
| Total | 1,554 (82.4%) | 333 (17.6%) |
Female Fertility in Tontitown
Fertility by Age in Tontitown
Average fertility rate in Tontitown is 16.0 births per 1,000 women. Women in the age bracket of 35 to 50 years have the highest fertility rate with 38.0 births per 1,000 women. Women in the age bracket of 35 to 50 years acount for 100.0% of all women with births.
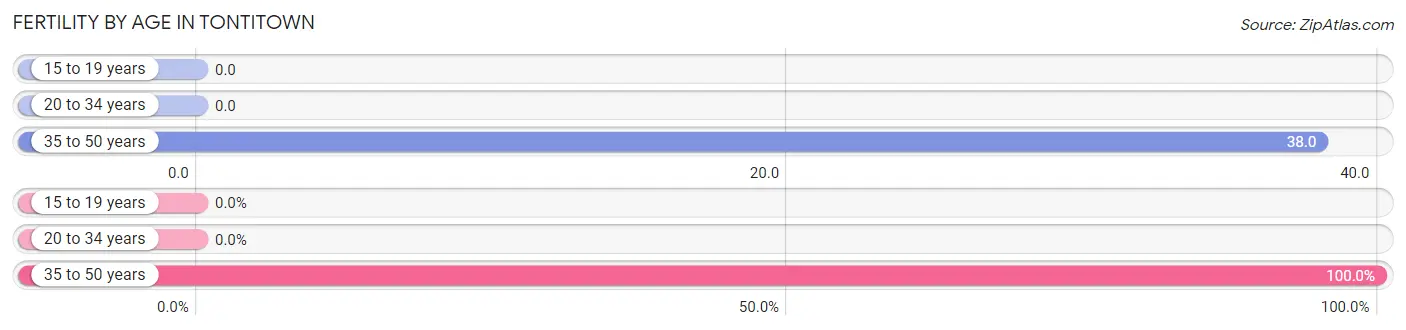
| Age Bracket | Women with Births | Births / 1,000 Women |
| 15 to 19 years | 0 (0.0%) | 0.0 |
| 20 to 34 years | 0 (0.0%) | 0.0 |
| 35 to 50 years | 21 (100.0%) | 38.0 |
| Total | 21 (100.0%) | 16.0 |
Fertility by Age by Marriage Status in Tontitown
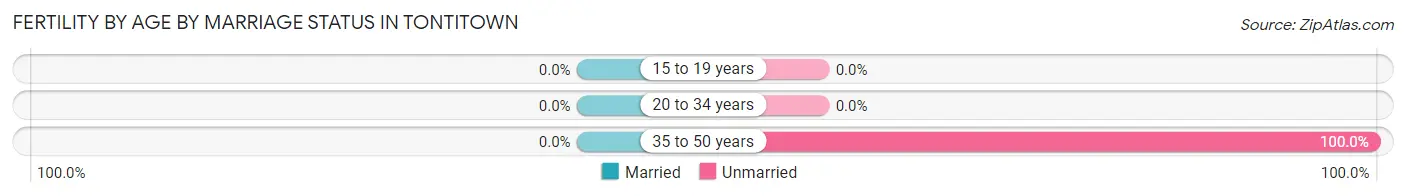
| Age Bracket | Married | Unmarried |
| 15 to 19 years | 0 (0.0%) | 0 (0.0%) |
| 20 to 34 years | 0 (0.0%) | 0 (0.0%) |
| 35 to 50 years | 0 (0.0%) | 21 (100.0%) |
| Total | 0 (0.0%) | 21 (100.0%) |
Fertility by Education in Tontitown
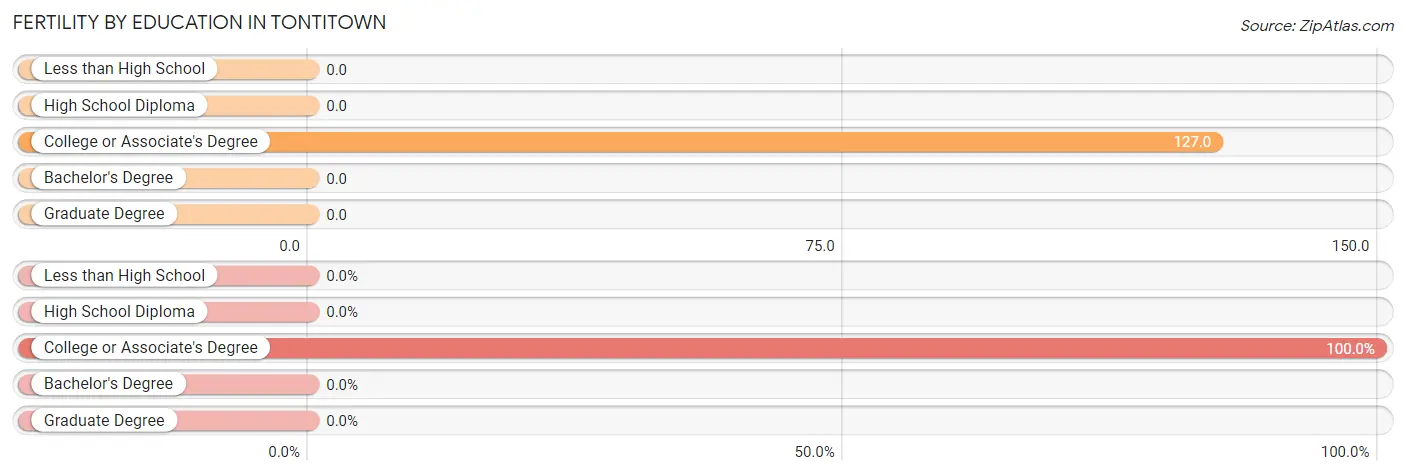
| Educational Attainment | Women with Births | Births / 1,000 Women |
| Less than High School | 0 (0.0%) | 0.0 |
| High School Diploma | 0 (0.0%) | 0.0 |
| College or Associate's Degree | 21 (100.0%) | 127.0 |
| Bachelor's Degree | 0 (0.0%) | 0.0 |
| Graduate Degree | 0 (0.0%) | 0.0 |
| Total | 21 (100.0%) | 16.0 |
Fertility by Education by Marriage Status in Tontitown
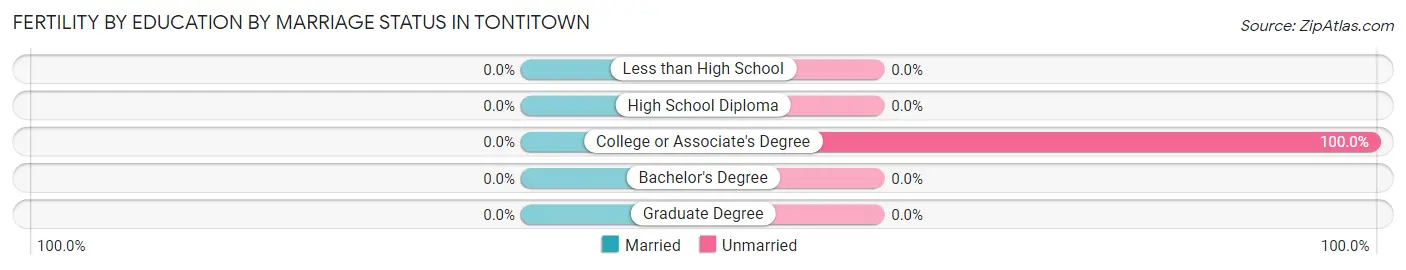
| Educational Attainment | Married | Unmarried |
| Less than High School | 0 (0.0%) | 0 (0.0%) |
| High School Diploma | 0 (0.0%) | 0 (0.0%) |
| College or Associate's Degree | 0 (0.0%) | 21 (100.0%) |
| Bachelor's Degree | 0 (0.0%) | 0 (0.0%) |
| Graduate Degree | 0 (0.0%) | 0 (0.0%) |
| Total | 0 (0.0%) | 21 (100.0%) |
Income in Tontitown
Income Overview in Tontitown
Per Capita Income in Tontitown is $45,000, while median incomes of families and households are $100,455 and $83,705 respectively.
| Characteristic | Number | Measure |
| Per Capita Income | 5,114 | $45,000 |
| Median Family Income | 1,554 | $100,455 |
| Mean Family Income | 1,554 | $136,784 |
| Median Household Income | 1,887 | $83,705 |
| Mean Household Income | 1,887 | $120,672 |
| Income Deficit | 1,554 | $0 |
| Wage / Income Gap (%) | 5,114 | 22.42% |
| Wage / Income Gap ($) | 5,114 | 77.58¢ per $1 |
| Gini / Inequality Index | 5,114 | 0.45 |
Earnings by Sex in Tontitown
Average Earnings in Tontitown are $44,849, $48,177 for men and $37,377 for women, a difference of 22.4%.
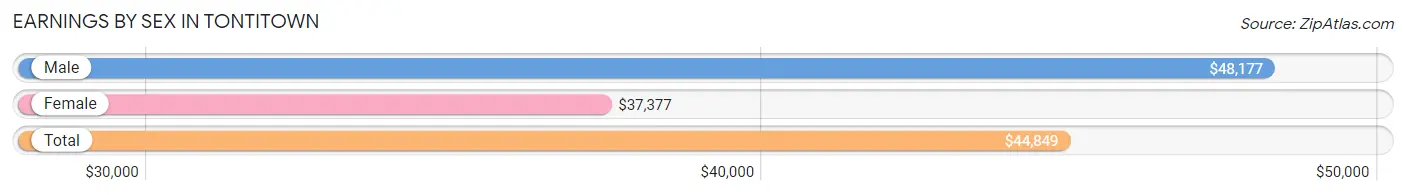
| Sex | Number | Average Earnings |
| Male | 1,690 (52.3%) | $48,177 |
| Female | 1,541 (47.7%) | $37,377 |
| Total | 3,231 (100.0%) | $44,849 |
Earnings by Sex by Income Bracket in Tontitown
The most common earnings brackets in Tontitown are $75,000 to $99,999 for men (232 | 13.7%) and $45,000 to $49,999 for women (227 | 14.7%).
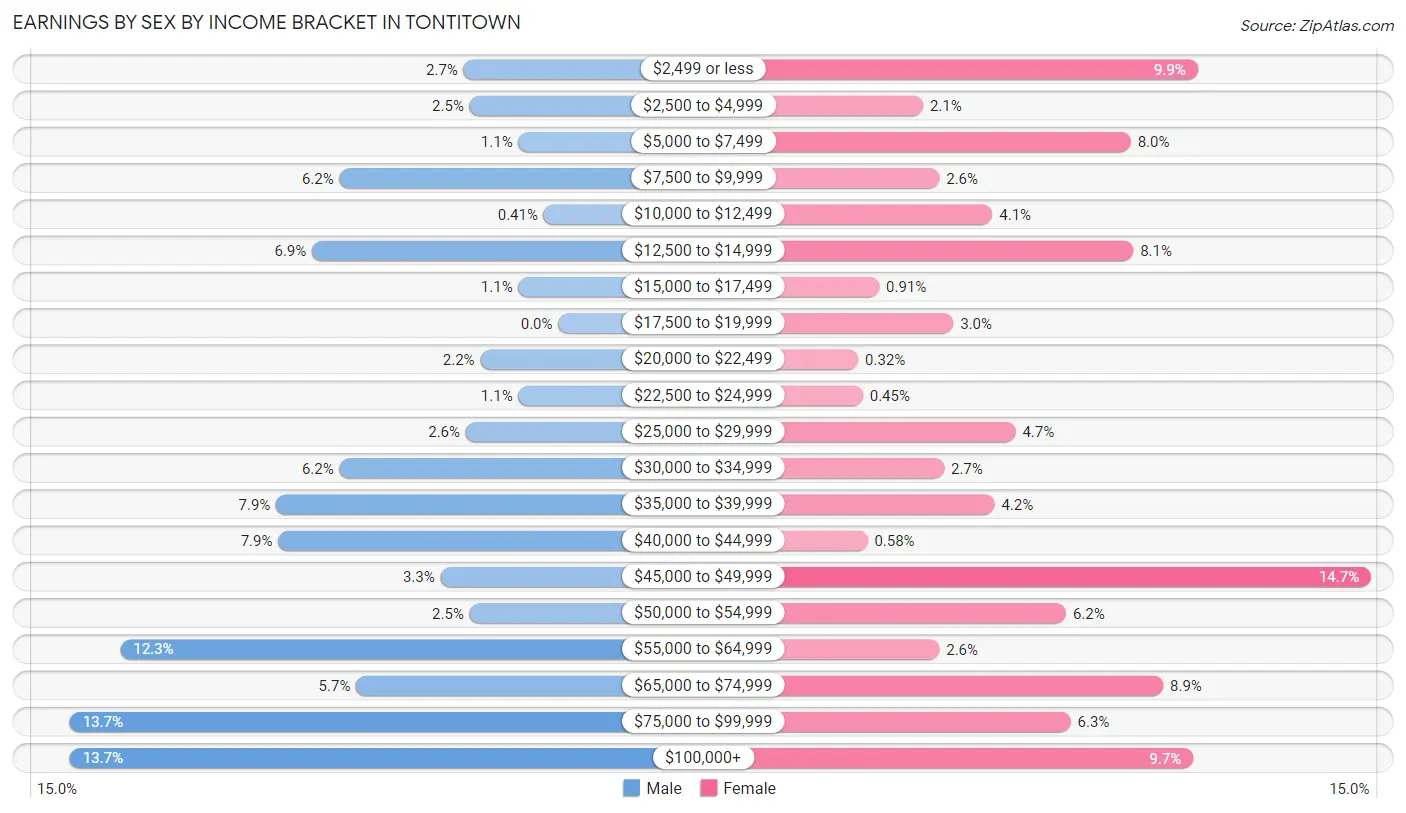
| Income | Male | Female |
| $2,499 or less | 45 (2.7%) | 152 (9.9%) |
| $2,500 to $4,999 | 42 (2.5%) | 33 (2.1%) |
| $5,000 to $7,499 | 19 (1.1%) | 123 (8.0%) |
| $7,500 to $9,999 | 104 (6.1%) | 40 (2.6%) |
| $10,000 to $12,499 | 7 (0.4%) | 63 (4.1%) |
| $12,500 to $14,999 | 117 (6.9%) | 124 (8.1%) |
| $15,000 to $17,499 | 19 (1.1%) | 14 (0.9%) |
| $17,500 to $19,999 | 0 (0.0%) | 46 (3.0%) |
| $20,000 to $22,499 | 37 (2.2%) | 5 (0.3%) |
| $22,500 to $24,999 | 19 (1.1%) | 7 (0.4%) |
| $25,000 to $29,999 | 44 (2.6%) | 73 (4.7%) |
| $30,000 to $34,999 | 104 (6.1%) | 42 (2.7%) |
| $35,000 to $39,999 | 134 (7.9%) | 64 (4.2%) |
| $40,000 to $44,999 | 133 (7.9%) | 9 (0.6%) |
| $45,000 to $49,999 | 56 (3.3%) | 227 (14.7%) |
| $50,000 to $54,999 | 42 (2.5%) | 95 (6.2%) |
| $55,000 to $64,999 | 208 (12.3%) | 40 (2.6%) |
| $65,000 to $74,999 | 96 (5.7%) | 137 (8.9%) |
| $75,000 to $99,999 | 232 (13.7%) | 97 (6.3%) |
| $100,000+ | 232 (13.7%) | 150 (9.7%) |
| Total | 1,690 (100.0%) | 1,541 (100.0%) |
Earnings by Sex by Educational Attainment in Tontitown
Average earnings in Tontitown are $56,696 for men and $47,163 for women, a difference of 16.8%. Men with an educational attainment of bachelor's degree enjoy the highest average annual earnings of $86,250, while those with less than high school education earn the least with $13,877. Women with an educational attainment of graduate degree earn the most with the average annual earnings of $70,580, while those with bachelor's degree education have the smallest earnings of $51,181.
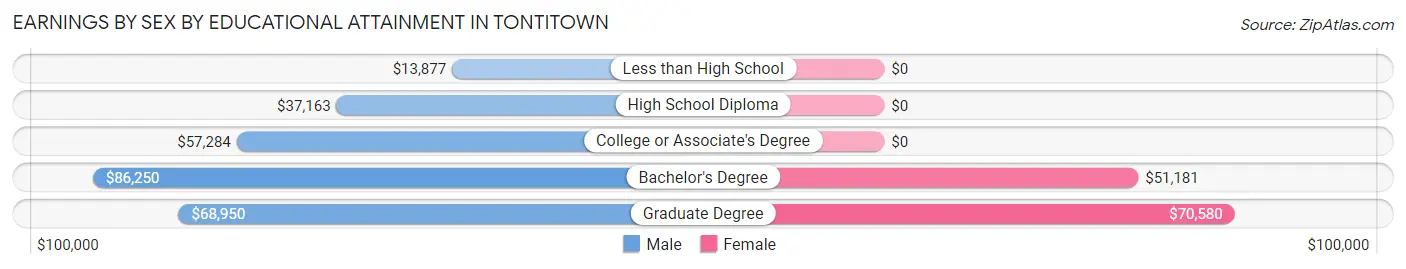
| Educational Attainment | Male Income | Female Income |
| Less than High School | $13,877 | $0 |
| High School Diploma | $37,163 | $0 |
| College or Associate's Degree | $57,284 | $0 |
| Bachelor's Degree | $86,250 | $51,181 |
| Graduate Degree | $68,950 | $70,580 |
| Total | $56,696 | $47,163 |
Family Income in Tontitown
Family Income Brackets in Tontitown
According to the Tontitown family income data, there are 328 families falling into the $100,000 to $149,999 income range, which is the most common income bracket and makes up 21.1% of all families.
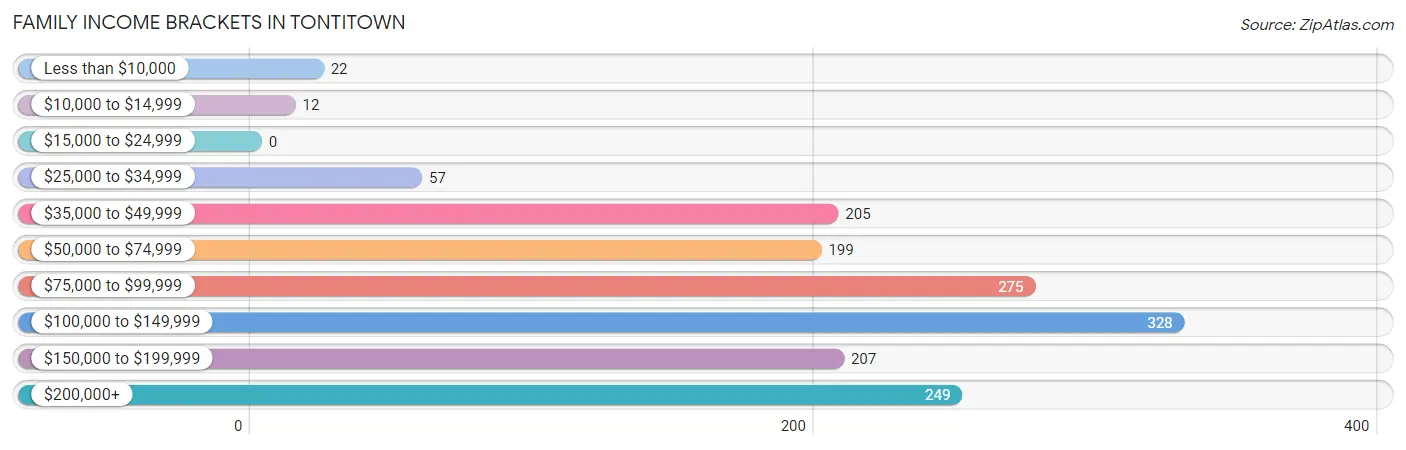
| Income Bracket | # Families | % Families |
| Less than $10,000 | 22 | 1.4% |
| $10,000 to $14,999 | 12 | 0.8% |
| $15,000 to $24,999 | 0 | 0.0% |
| $25,000 to $34,999 | 57 | 3.7% |
| $35,000 to $49,999 | 205 | 13.2% |
| $50,000 to $74,999 | 199 | 12.8% |
| $75,000 to $99,999 | 275 | 17.7% |
| $100,000 to $149,999 | 328 | 21.1% |
| $150,000 to $199,999 | 207 | 13.3% |
| $200,000+ | 249 | 16.0% |
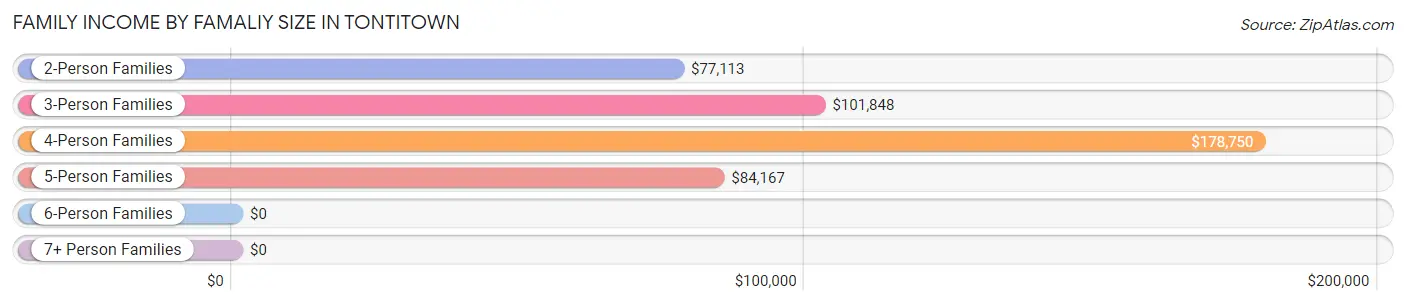
Family Income by Famaliy Size in Tontitown
4-person families (276 | 17.8%) account for the highest median family income in Tontitown with $178,750 per family, while 4-person families (276 | 17.8%) have the highest median income of $44,688 per family member.
| Income Bracket | # Families | Median Income |
| 2-Person Families | 835 (53.7%) | $77,113 |
| 3-Person Families | 278 (17.9%) | $101,848 |
| 4-Person Families | 276 (17.8%) | $178,750 |
| 5-Person Families | 72 (4.6%) | $84,167 |
| 6-Person Families | 58 (3.7%) | $0 |
| 7+ Person Families | 35 (2.2%) | $0 |
| Total | 1,554 (100.0%) | $100,455 |
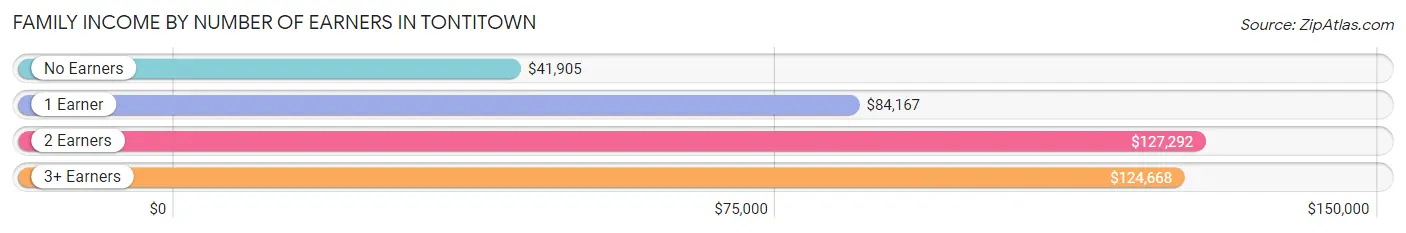
Family Income by Number of Earners in Tontitown
The median family income in Tontitown is $100,455, with families comprising 2 earners (729) having the highest median family income of $127,292, while families with no earners (340) have the lowest median family income of $41,905, accounting for 46.9% and 21.9% of families, respectively.
| Number of Earners | # Families | Median Income |
| No Earners | 340 (21.9%) | $41,905 |
| 1 Earner | 188 (12.1%) | $84,167 |
| 2 Earners | 729 (46.9%) | $127,292 |
| 3+ Earners | 297 (19.1%) | $124,668 |
| Total | 1,554 (100.0%) | $100,455 |
Household Income in Tontitown
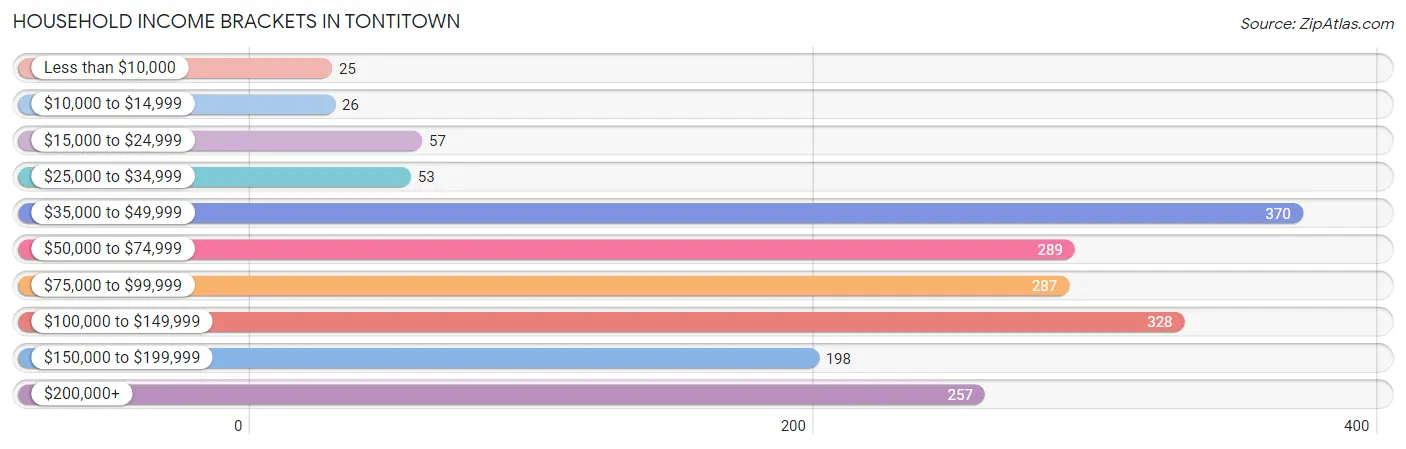
Household Income Brackets in Tontitown
With 370 households falling in the category, the $35,000 to $49,999 income range is the most frequent in Tontitown, accounting for 19.6% of all households. In contrast, only 25 households (1.3%) fall into the less than $10,000 income bracket, making it the least populous group.
| Income Bracket | # Households | % Households |
| Less than $10,000 | 25 | 1.3% |
| $10,000 to $14,999 | 26 | 1.4% |
| $15,000 to $24,999 | 57 | 3.0% |
| $25,000 to $34,999 | 53 | 2.8% |
| $35,000 to $49,999 | 370 | 19.6% |
| $50,000 to $74,999 | 289 | 15.3% |
| $75,000 to $99,999 | 287 | 15.2% |
| $100,000 to $149,999 | 328 | 17.4% |
| $150,000 to $199,999 | 198 | 10.5% |
| $200,000+ | 257 | 13.6% |
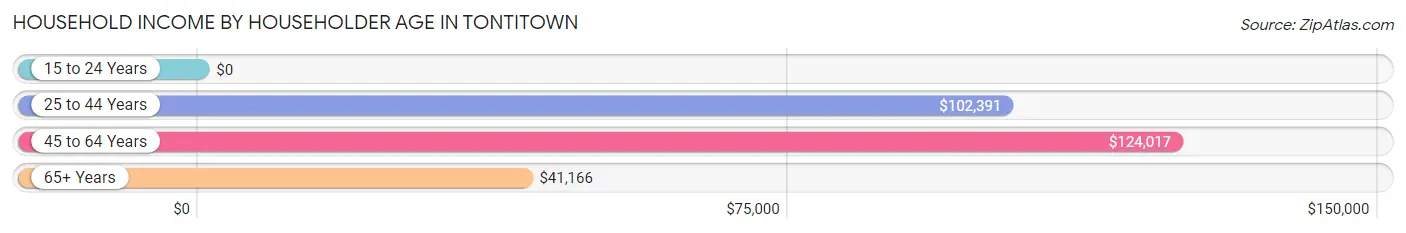
Household Income by Householder Age in Tontitown
The median household income in Tontitown is $83,705, with the highest median household income of $124,017 found in the 45 to 64 years age bracket for the primary householder. A total of 551 households (29.2%) fall into this category. Meanwhile, the 15 to 24 years age bracket for the primary householder has the lowest median household income of $0, with 47 households (2.5%) in this group.
| Income Bracket | # Households | Median Income |
| 15 to 24 Years | 47 (2.5%) | $0 |
| 25 to 44 Years | 740 (39.2%) | $102,391 |
| 45 to 64 Years | 551 (29.2%) | $124,017 |
| 65+ Years | 549 (29.1%) | $41,166 |
| Total | 1,887 (100.0%) | $83,705 |
Poverty in Tontitown
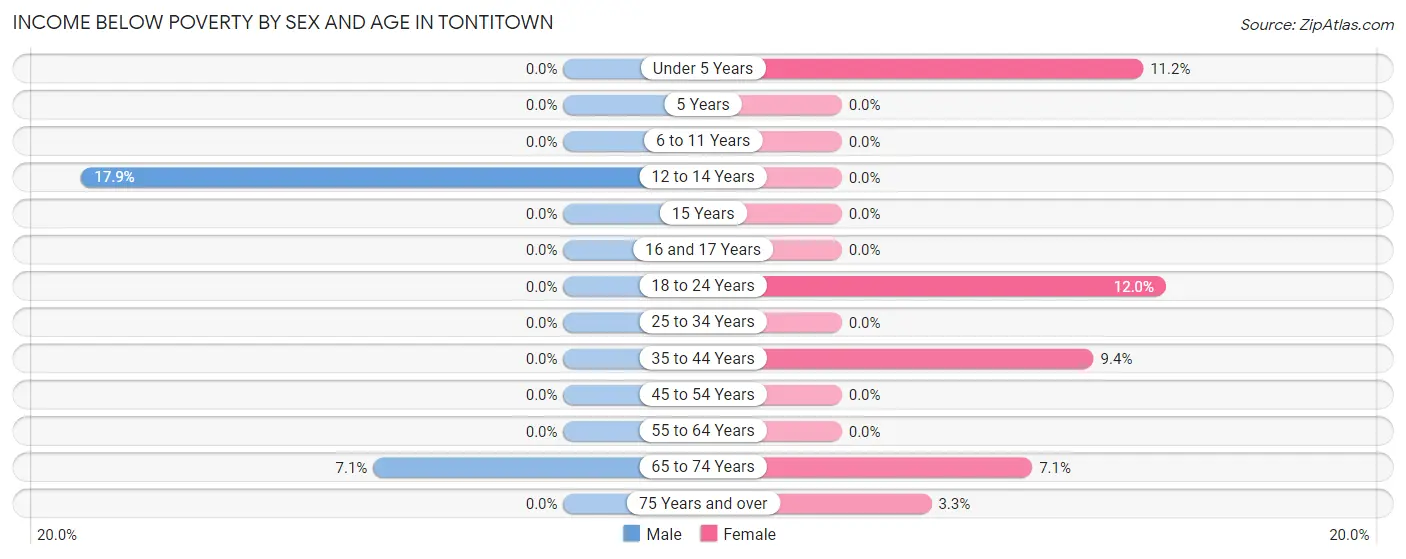
Income Below Poverty by Sex and Age in Tontitown
With 1.6% poverty level for males and 4.3% for females among the residents of Tontitown, 12 to 14 year old males and 18 to 24 year old females are the most vulnerable to poverty, with 17 males (17.9%) and 35 females (12.0%) in their respective age groups living below the poverty level.
| Age Bracket | Male | Female |
| Under 5 Years | 0 (0.0%) | 15 (11.2%) |
| 5 Years | 0 (0.0%) | 0 (0.0%) |
| 6 to 11 Years | 0 (0.0%) | 0 (0.0%) |
| 12 to 14 Years | 17 (17.9%) | 0 (0.0%) |
| 15 Years | 0 (0.0%) | 0 (0.0%) |
| 16 and 17 Years | 0 (0.0%) | 0 (0.0%) |
| 18 to 24 Years | 0 (0.0%) | 35 (12.0%) |
| 25 to 34 Years | 0 (0.0%) | 0 (0.0%) |
| 35 to 44 Years | 0 (0.0%) | 40 (9.3%) |
| 45 to 54 Years | 0 (0.0%) | 0 (0.0%) |
| 55 to 64 Years | 0 (0.0%) | 0 (0.0%) |
| 65 to 74 Years | 23 (7.1%) | 13 (7.1%) |
| 75 Years and over | 0 (0.0%) | 9 (3.3%) |
| Total | 40 (1.6%) | 112 (4.3%) |
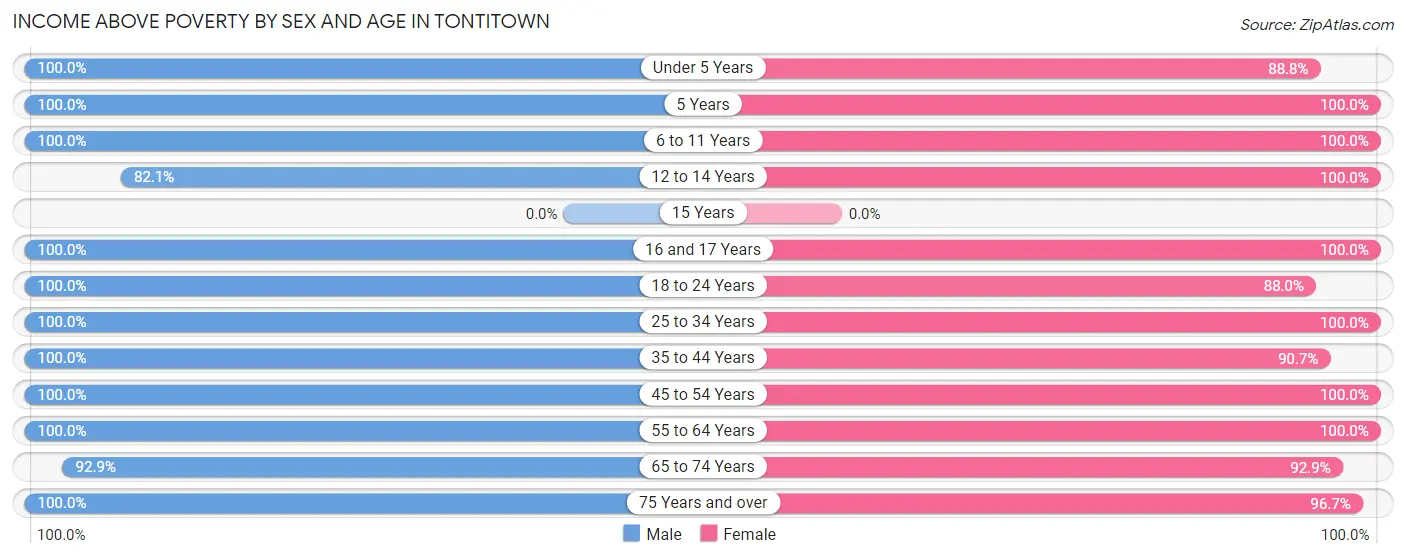
Income Above Poverty by Sex and Age in Tontitown
According to the poverty statistics in Tontitown, males aged under 5 years and females aged 5 years are the age groups that are most secure financially, with 100.0% of males and 100.0% of females in these age groups living above the poverty line.
| Age Bracket | Male | Female |
| Under 5 Years | 97 (100.0%) | 119 (88.8%) |
| 5 Years | 27 (100.0%) | 56 (100.0%) |
| 6 to 11 Years | 120 (100.0%) | 205 (100.0%) |
| 12 to 14 Years | 78 (82.1%) | 68 (100.0%) |
| 15 Years | 0 (0.0%) | 0 (0.0%) |
| 16 and 17 Years | 92 (100.0%) | 233 (100.0%) |
| 18 to 24 Years | 260 (100.0%) | 256 (88.0%) |
| 25 to 34 Years | 332 (100.0%) | 232 (100.0%) |
| 35 to 44 Years | 367 (100.0%) | 388 (90.6%) |
| 45 to 54 Years | 331 (100.0%) | 223 (100.0%) |
| 55 to 64 Years | 205 (100.0%) | 303 (100.0%) |
| 65 to 74 Years | 303 (92.9%) | 171 (92.9%) |
| 75 Years and over | 235 (100.0%) | 261 (96.7%) |
| Total | 2,447 (98.4%) | 2,515 (95.7%) |
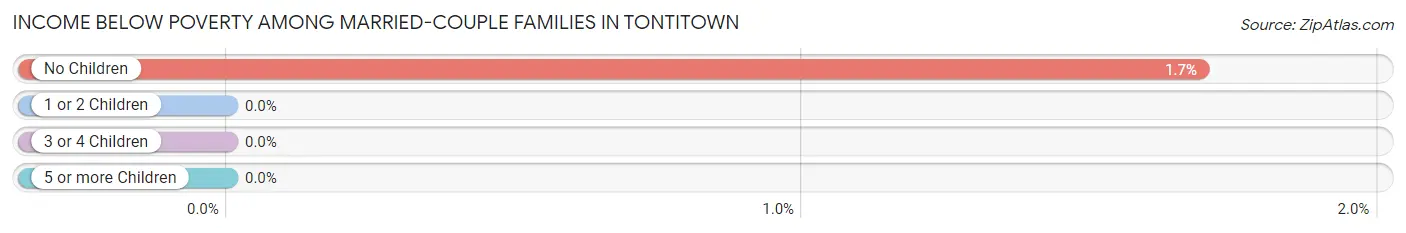
Income Below Poverty Among Married-Couple Families in Tontitown
The poverty statistics for married-couple families in Tontitown show that 0.9% or 13 of the total 1,364 families live below the poverty line. Families with no children have the highest poverty rate of 1.7%, comprising of 13 families. On the other hand, families with 1 or 2 children have the lowest poverty rate of 0.0%, which includes 0 families.
| Children | Above Poverty | Below Poverty |
| No Children | 754 (98.3%) | 13 (1.7%) |
| 1 or 2 Children | 493 (100.0%) | 0 (0.0%) |
| 3 or 4 Children | 104 (100.0%) | 0 (0.0%) |
| 5 or more Children | 0 (0.0%) | 0 (0.0%) |
| Total | 1,351 (99.1%) | 13 (0.9%) |
Income Below Poverty Among Single-Parent Households in Tontitown
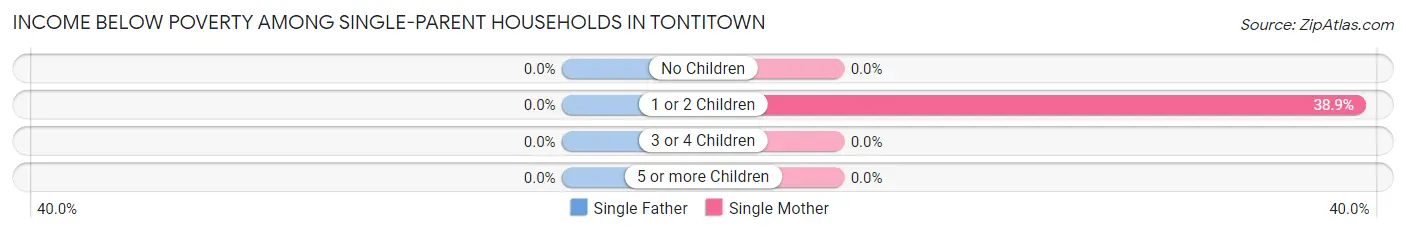
| Children | Single Father | Single Mother |
| No Children | 0 (0.0%) | 0 (0.0%) |
| 1 or 2 Children | 0 (0.0%) | 21 (38.9%) |
| 3 or 4 Children | 0 (0.0%) | 0 (0.0%) |
| 5 or more Children | 0 (0.0%) | 0 (0.0%) |
| Total | 0 (0.0%) | 21 (30.4%) |
Income Below Poverty Among Married-Couple vs Single-Parent Households in Tontitown
The poverty data for Tontitown shows that 13 of the married-couple family households (0.9%) and 21 of the single-parent households (11.1%) are living below the poverty level. Within the married-couple family households, those with no children have the highest poverty rate, with 13 households (1.7%) falling below the poverty line. Among the single-parent households, those with 1 or 2 children have the highest poverty rate, with 21 household (19.1%) living below poverty.
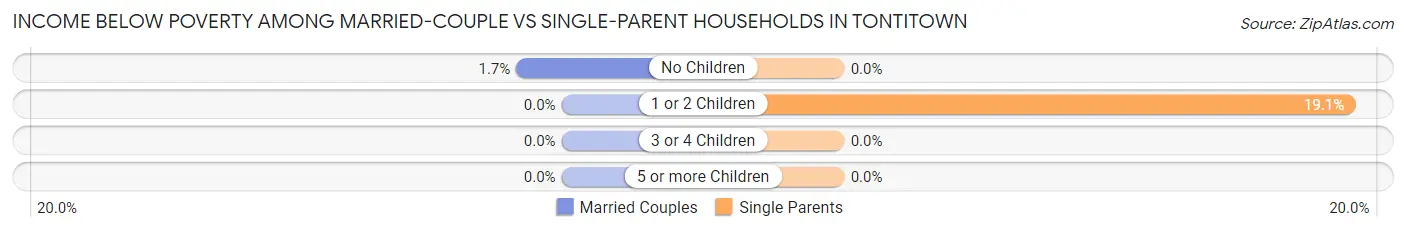
| Children | Married-Couple Families | Single-Parent Households |
| No Children | 13 (1.7%) | 0 (0.0%) |
| 1 or 2 Children | 0 (0.0%) | 21 (19.1%) |
| 3 or 4 Children | 0 (0.0%) | 0 (0.0%) |
| 5 or more Children | 0 (0.0%) | 0 (0.0%) |
| Total | 13 (0.9%) | 21 (11.1%) |
Employment Characteristics in Tontitown
Employment by Class of Employer in Tontitown
Among the 2,974 employed individuals in Tontitown, private company employees (1,766 | 59.4%), state government employees (259 | 8.7%), and not-for-profit organizations (255 | 8.6%) make up the most common classes of employment.
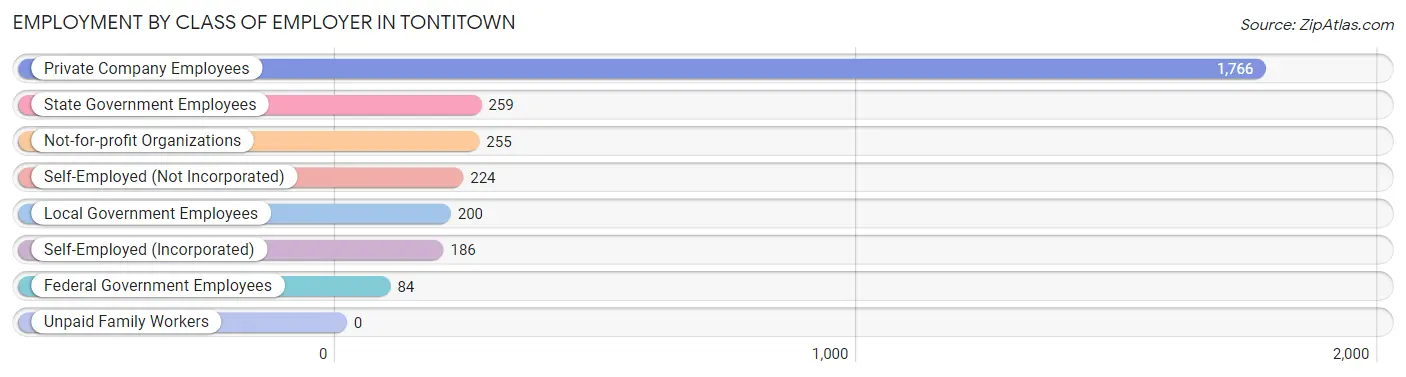
| Employer Class | # Employees | % Employees |
| Private Company Employees | 1,766 | 59.4% |
| Self-Employed (Incorporated) | 186 | 6.2% |
| Self-Employed (Not Incorporated) | 224 | 7.5% |
| Not-for-profit Organizations | 255 | 8.6% |
| Local Government Employees | 200 | 6.7% |
| State Government Employees | 259 | 8.7% |
| Federal Government Employees | 84 | 2.8% |
| Unpaid Family Workers | 0 | 0.0% |
| Total | 2,974 | 100.0% |
Employment Status by Age in Tontitown
According to the labor force statistics for Tontitown, out of the total population over 16 years of age (4,312), 70.7% or 3,049 individuals are in the labor force, with 2.5% or 76 of them unemployed. The age group with the highest labor force participation rate is 25 to 29 years, with 100.0% or 358 individuals in the labor force. Within the labor force, the 16 to 19 years age range has the highest percentage of unemployed individuals, with 18.8% or 57 of them being unemployed.
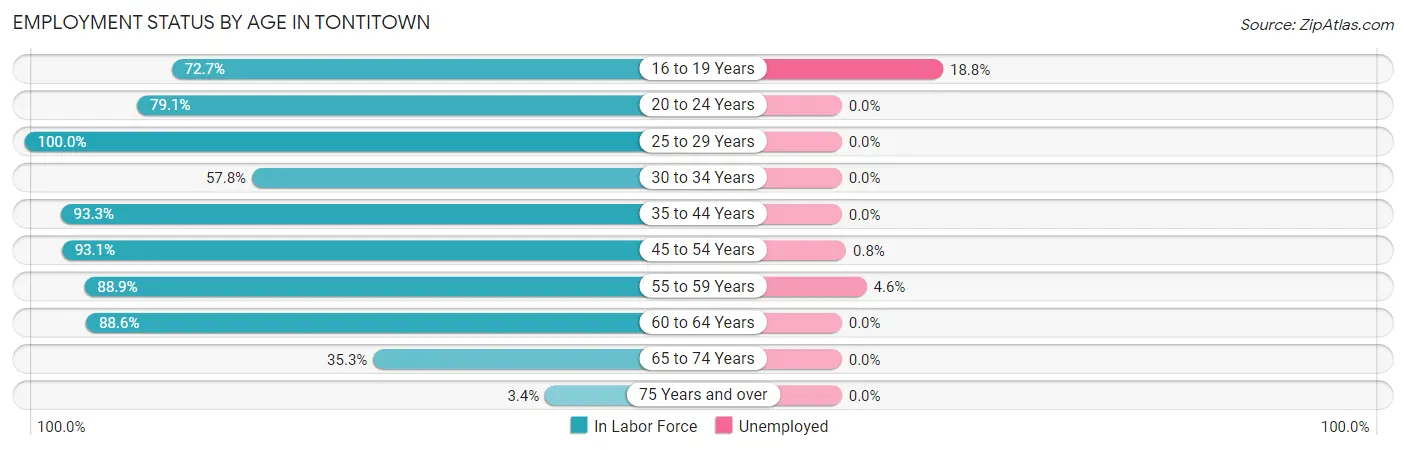
| Age Bracket | In Labor Force | Unemployed |
| 16 to 19 Years | 303 (72.7%) | 57 (18.8%) |
| 20 to 24 Years | 363 (79.1%) | 0 (0.0%) |
| 25 to 29 Years | 358 (100.0%) | 0 (0.0%) |
| 30 to 34 Years | 119 (57.8%) | 0 (0.0%) |
| 35 to 44 Years | 742 (93.3%) | 0 (0.0%) |
| 45 to 54 Years | 516 (93.1%) | 4 (0.8%) |
| 55 to 59 Years | 303 (88.9%) | 14 (4.6%) |
| 60 to 64 Years | 148 (88.6%) | 0 (0.0%) |
| 65 to 74 Years | 180 (35.3%) | 0 (0.0%) |
| 75 Years and over | 17 (3.4%) | 0 (0.0%) |
| Total | 3,049 (70.7%) | 76 (2.5%) |
Employment Status by Educational Attainment in Tontitown
According to labor force statistics for Tontitown, 90.3% of individuals (2,186) out of the total population between 25 and 64 years of age (2,421) are in the labor force, with 0.8% or 17 of them being unemployed. The group with the highest labor force participation rate are those with the educational attainment of less than high school, with 95.6% or 173 individuals in the labor force. Within the labor force, individuals with college / associate degree education have the highest percentage of unemployment, with 4.4% or 18 of them being unemployed.
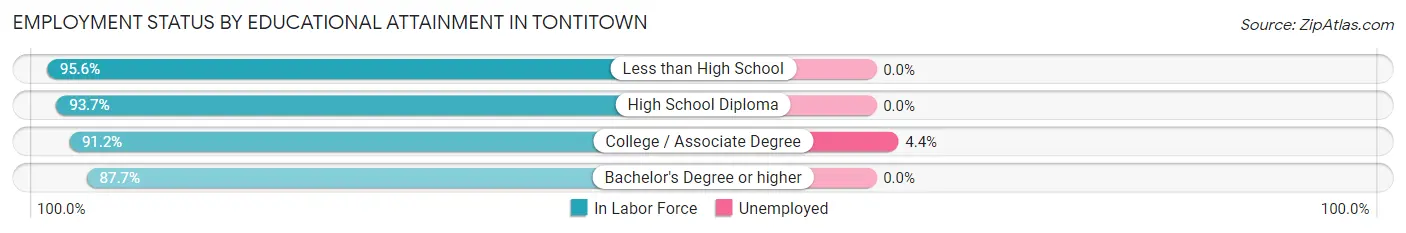
| Educational Attainment | In Labor Force | Unemployed |
| Less than High School | 173 (95.6%) | 0 (0.0%) |
| High School Diploma | 506 (93.7%) | 0 (0.0%) |
| College / Associate Degree | 413 (91.2%) | 20 (4.4%) |
| Bachelor's Degree or higher | 1,094 (87.7%) | 0 (0.0%) |
| Total | 2,186 (90.3%) | 19 (0.8%) |
Employment Occupations by Sex in Tontitown
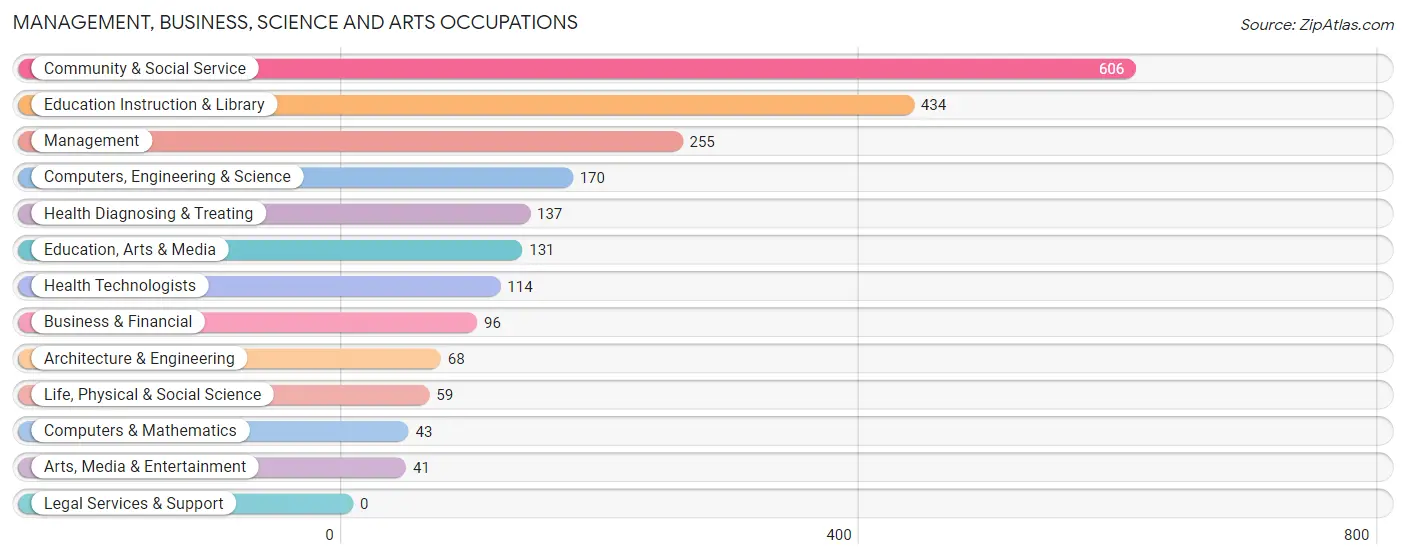
Management, Business, Science and Arts Occupations
The most common Management, Business, Science and Arts occupations in Tontitown are Community & Social Service (606 | 20.4%), Education Instruction & Library (434 | 14.6%), Management (255 | 8.6%), Computers, Engineering & Science (170 | 5.7%), and Health Diagnosing & Treating (137 | 4.6%).
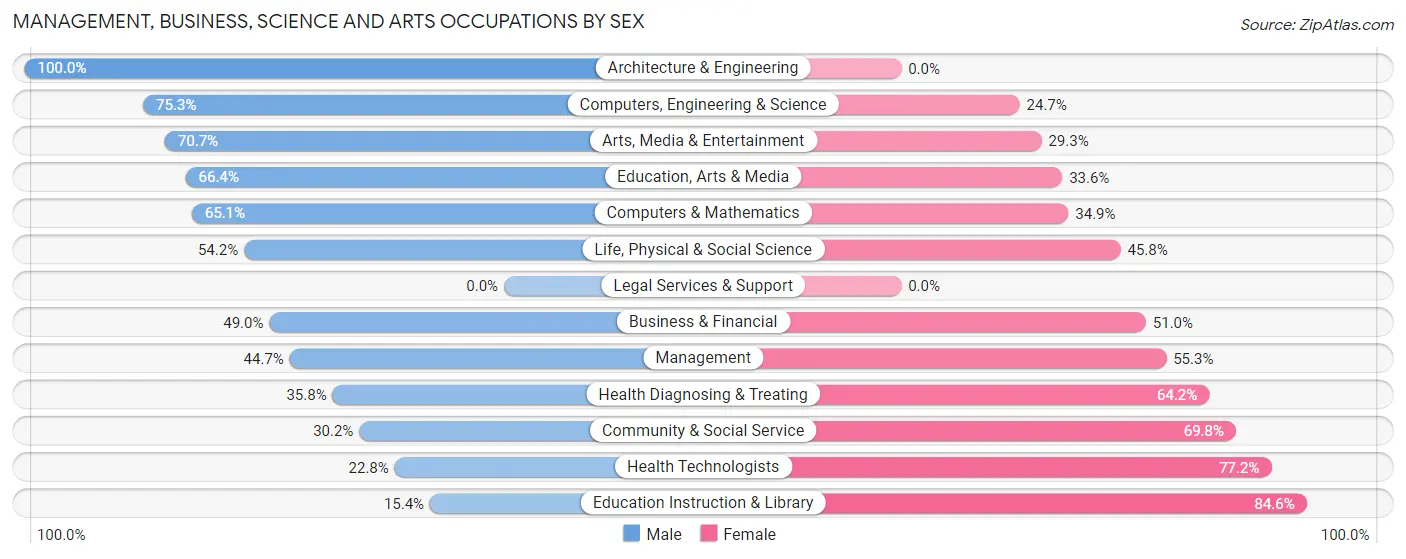
Management, Business, Science and Arts Occupations by Sex
Within the Management, Business, Science and Arts occupations in Tontitown, the most male-oriented occupations are Architecture & Engineering (100.0%), Computers, Engineering & Science (75.3%), and Arts, Media & Entertainment (70.7%), while the most female-oriented occupations are Education Instruction & Library (84.6%), Health Technologists (77.2%), and Community & Social Service (69.8%).
| Occupation | Male | Female |
| Management | 114 (44.7%) | 141 (55.3%) |
| Business & Financial | 47 (49.0%) | 49 (51.0%) |
| Computers, Engineering & Science | 128 (75.3%) | 42 (24.7%) |
| Computers & Mathematics | 28 (65.1%) | 15 (34.9%) |
| Architecture & Engineering | 68 (100.0%) | 0 (0.0%) |
| Life, Physical & Social Science | 32 (54.2%) | 27 (45.8%) |
| Community & Social Service | 183 (30.2%) | 423 (69.8%) |
| Education, Arts & Media | 87 (66.4%) | 44 (33.6%) |
| Legal Services & Support | 0 (0.0%) | 0 (0.0%) |
| Education Instruction & Library | 67 (15.4%) | 367 (84.6%) |
| Arts, Media & Entertainment | 29 (70.7%) | 12 (29.3%) |
| Health Diagnosing & Treating | 49 (35.8%) | 88 (64.2%) |
| Health Technologists | 26 (22.8%) | 88 (77.2%) |
| Total (Category) | 521 (41.2%) | 743 (58.8%) |
| Total (Overall) | 1,600 (53.8%) | 1,374 (46.2%) |
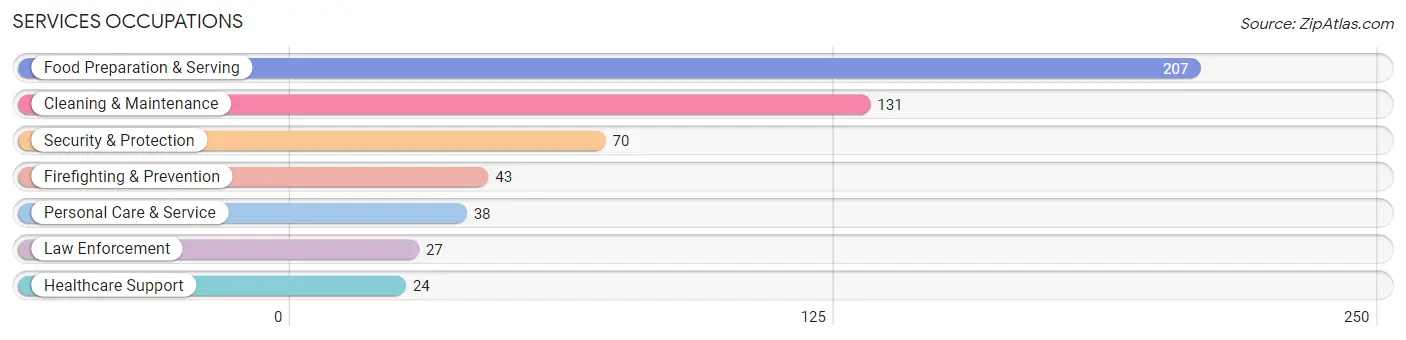
Services Occupations
The most common Services occupations in Tontitown are Food Preparation & Serving (207 | 7.0%), Cleaning & Maintenance (131 | 4.4%), Security & Protection (70 | 2.4%), Firefighting & Prevention (43 | 1.5%), and Personal Care & Service (38 | 1.3%).
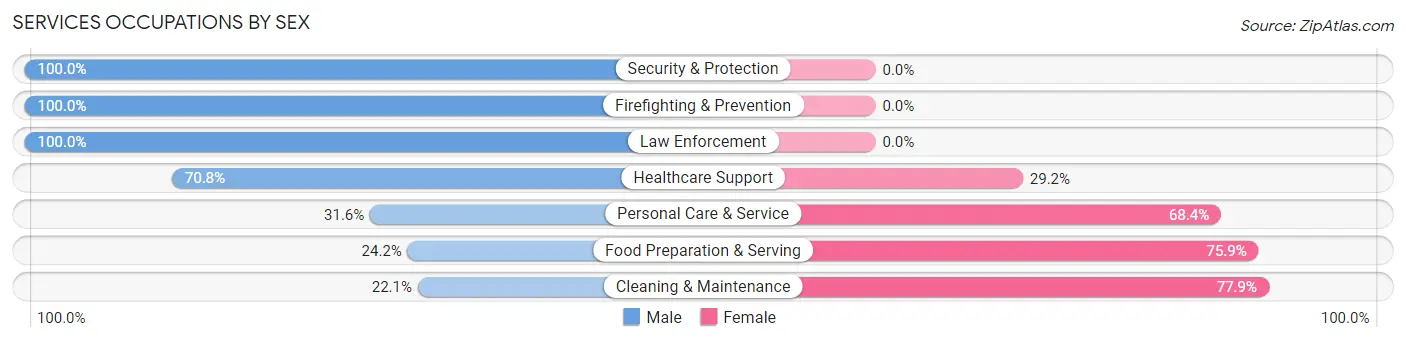
Services Occupations by Sex
Within the Services occupations in Tontitown, the most male-oriented occupations are Security & Protection (100.0%), Firefighting & Prevention (100.0%), and Law Enforcement (100.0%), while the most female-oriented occupations are Cleaning & Maintenance (77.9%), Food Preparation & Serving (75.8%), and Personal Care & Service (68.4%).
| Occupation | Male | Female |
| Healthcare Support | 17 (70.8%) | 7 (29.2%) |
| Security & Protection | 70 (100.0%) | 0 (0.0%) |
| Firefighting & Prevention | 43 (100.0%) | 0 (0.0%) |
| Law Enforcement | 27 (100.0%) | 0 (0.0%) |
| Food Preparation & Serving | 50 (24.1%) | 157 (75.8%) |
| Cleaning & Maintenance | 29 (22.1%) | 102 (77.9%) |
| Personal Care & Service | 12 (31.6%) | 26 (68.4%) |
| Total (Category) | 178 (37.9%) | 292 (62.1%) |
| Total (Overall) | 1,600 (53.8%) | 1,374 (46.2%) |
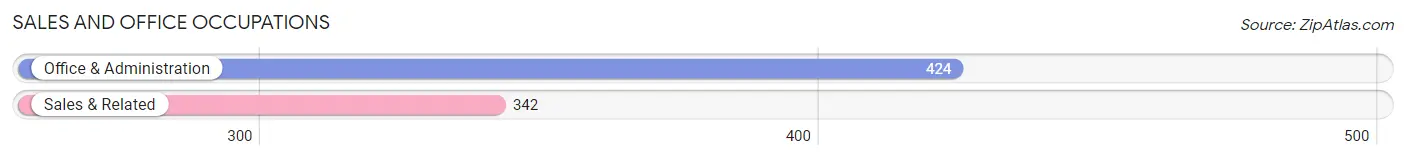
Sales and Office Occupations
The most common Sales and Office occupations in Tontitown are Office & Administration (424 | 14.3%), and Sales & Related (342 | 11.5%).
Sales and Office Occupations by Sex
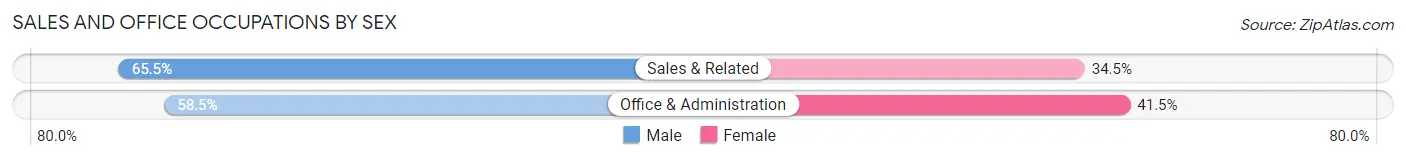
| Occupation | Male | Female |
| Sales & Related | 224 (65.5%) | 118 (34.5%) |
| Office & Administration | 248 (58.5%) | 176 (41.5%) |
| Total (Category) | 472 (61.6%) | 294 (38.4%) |
| Total (Overall) | 1,600 (53.8%) | 1,374 (46.2%) |
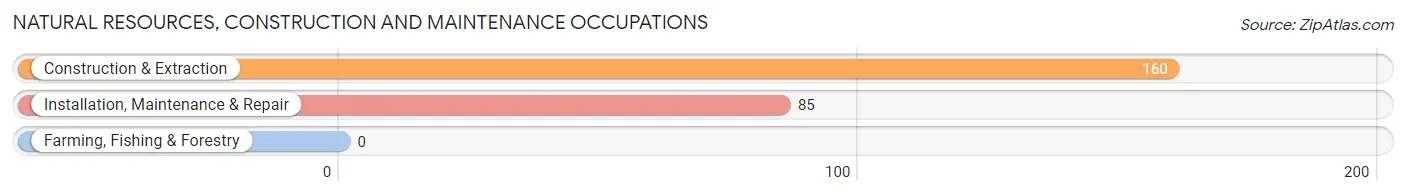
Natural Resources, Construction and Maintenance Occupations
The most common Natural Resources, Construction and Maintenance occupations in Tontitown are Construction & Extraction (160 | 5.4%), and Installation, Maintenance & Repair (85 | 2.9%).
Natural Resources, Construction and Maintenance Occupations by Sex
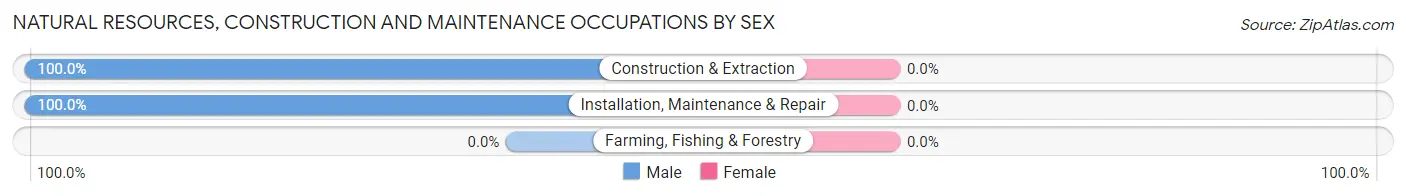
| Occupation | Male | Female |
| Farming, Fishing & Forestry | 0 (0.0%) | 0 (0.0%) |
| Construction & Extraction | 160 (100.0%) | 0 (0.0%) |
| Installation, Maintenance & Repair | 85 (100.0%) | 0 (0.0%) |
| Total (Category) | 245 (100.0%) | 0 (0.0%) |
| Total (Overall) | 1,600 (53.8%) | 1,374 (46.2%) |
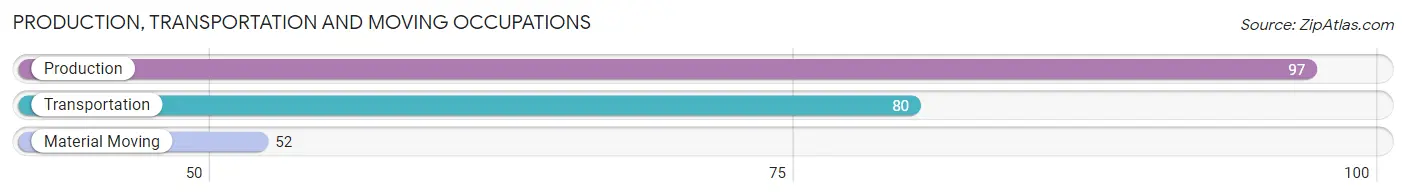
Production, Transportation and Moving Occupations
The most common Production, Transportation and Moving occupations in Tontitown are Production (97 | 3.3%), Transportation (80 | 2.7%), and Material Moving (52 | 1.8%).
Production, Transportation and Moving Occupations by Sex
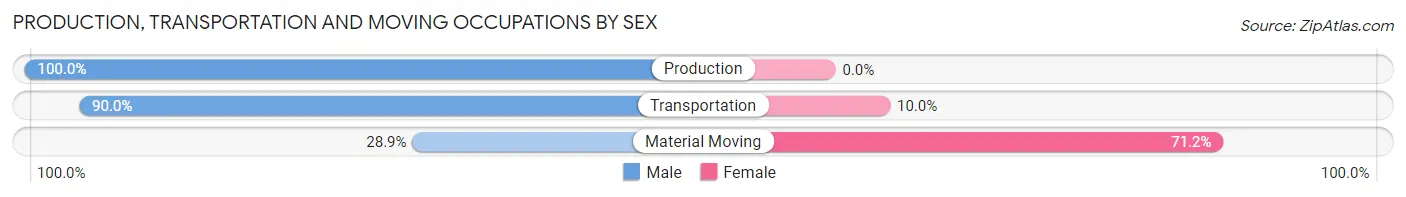
| Occupation | Male | Female |
| Production | 97 (100.0%) | 0 (0.0%) |
| Transportation | 72 (90.0%) | 8 (10.0%) |
| Material Moving | 15 (28.8%) | 37 (71.2%) |
| Total (Category) | 184 (80.3%) | 45 (19.7%) |
| Total (Overall) | 1,600 (53.8%) | 1,374 (46.2%) |
Employment Industries by Sex in Tontitown
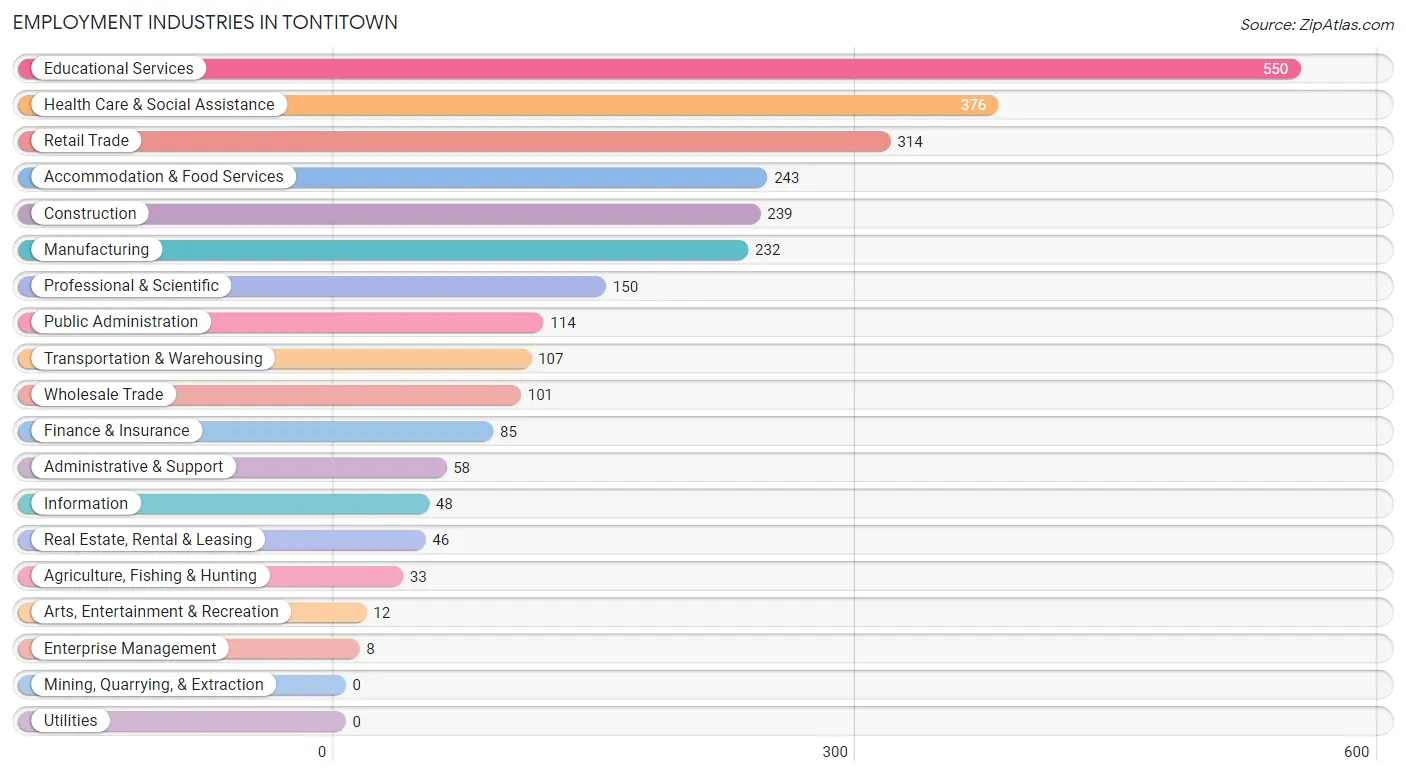
Employment Industries in Tontitown
The major employment industries in Tontitown include Educational Services (550 | 18.5%), Health Care & Social Assistance (376 | 12.6%), Retail Trade (314 | 10.6%), Accommodation & Food Services (243 | 8.2%), and Construction (239 | 8.0%).
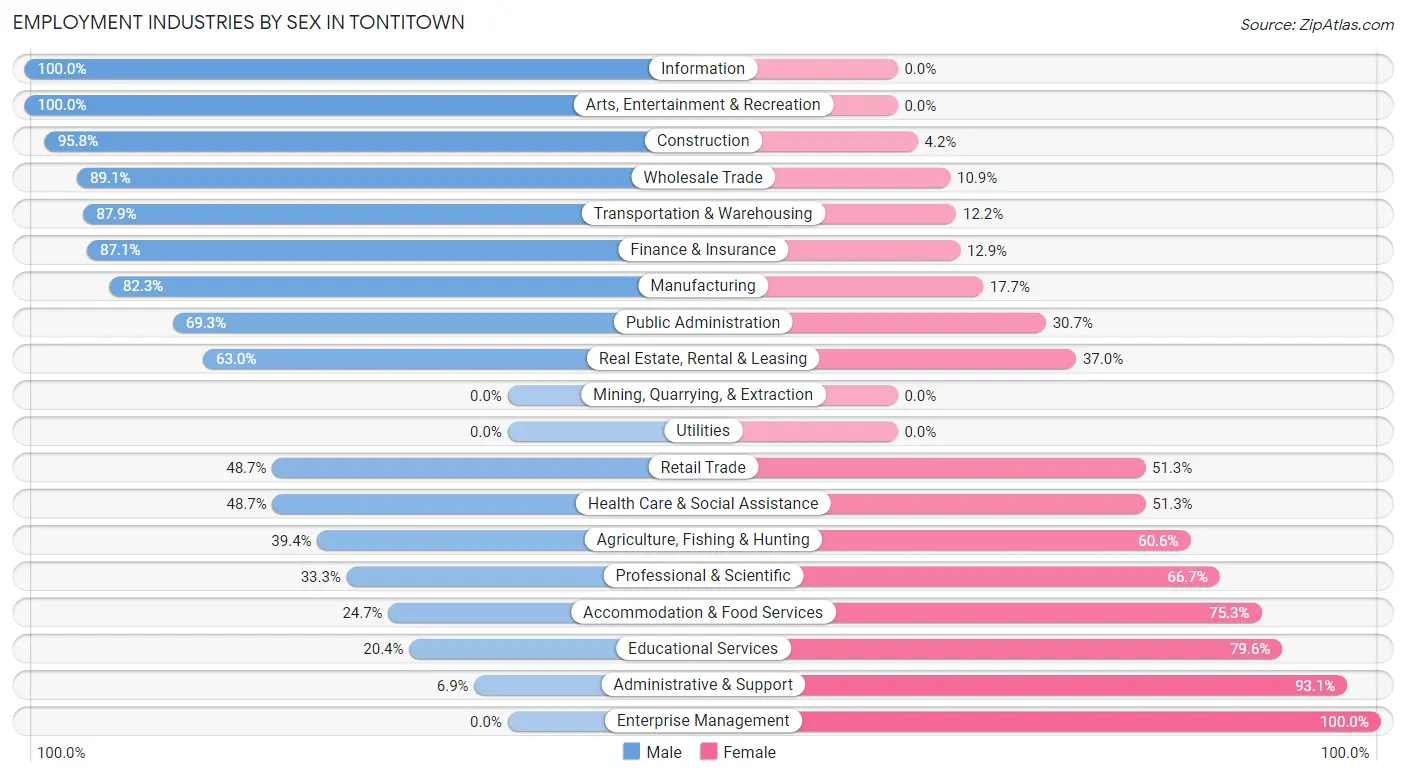
Employment Industries by Sex in Tontitown
The Tontitown industries that see more men than women are Information (100.0%), Arts, Entertainment & Recreation (100.0%), and Construction (95.8%), whereas the industries that tend to have a higher number of women are Enterprise Management (100.0%), Administrative & Support (93.1%), and Educational Services (79.6%).
| Industry | Male | Female |
| Agriculture, Fishing & Hunting | 13 (39.4%) | 20 (60.6%) |
| Mining, Quarrying, & Extraction | 0 (0.0%) | 0 (0.0%) |
| Construction | 229 (95.8%) | 10 (4.2%) |
| Manufacturing | 191 (82.3%) | 41 (17.7%) |
| Wholesale Trade | 90 (89.1%) | 11 (10.9%) |
| Retail Trade | 153 (48.7%) | 161 (51.3%) |
| Transportation & Warehousing | 94 (87.8%) | 13 (12.1%) |
| Utilities | 0 (0.0%) | 0 (0.0%) |
| Information | 48 (100.0%) | 0 (0.0%) |
| Finance & Insurance | 74 (87.1%) | 11 (12.9%) |
| Real Estate, Rental & Leasing | 29 (63.0%) | 17 (37.0%) |
| Professional & Scientific | 50 (33.3%) | 100 (66.7%) |
| Enterprise Management | 0 (0.0%) | 8 (100.0%) |
| Administrative & Support | 4 (6.9%) | 54 (93.1%) |
| Educational Services | 112 (20.4%) | 438 (79.6%) |
| Health Care & Social Assistance | 183 (48.7%) | 193 (51.3%) |
| Arts, Entertainment & Recreation | 12 (100.0%) | 0 (0.0%) |
| Accommodation & Food Services | 60 (24.7%) | 183 (75.3%) |
| Public Administration | 79 (69.3%) | 35 (30.7%) |
| Total | 1,600 (53.8%) | 1,374 (46.2%) |
Education in Tontitown
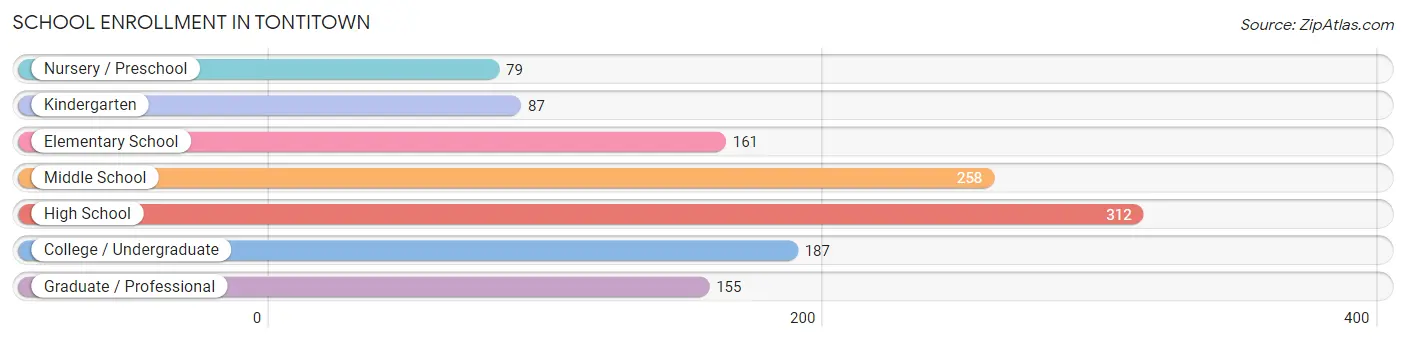
School Enrollment in Tontitown
The most common levels of schooling among the 1,239 students in Tontitown are high school (312 | 25.2%), middle school (258 | 20.8%), and college / undergraduate (187 | 15.1%).
| School Level | # Students | % Students |
| Nursery / Preschool | 79 | 6.4% |
| Kindergarten | 87 | 7.0% |
| Elementary School | 161 | 13.0% |
| Middle School | 258 | 20.8% |
| High School | 312 | 25.2% |
| College / Undergraduate | 187 | 15.1% |
| Graduate / Professional | 155 | 12.5% |
| Total | 1,239 | 100.0% |
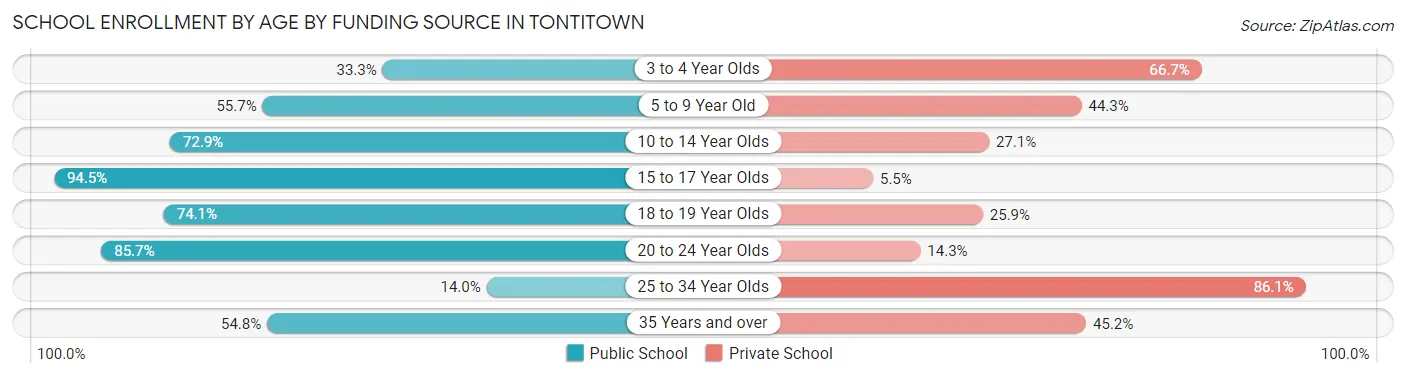
School Enrollment by Age by Funding Source in Tontitown
Out of a total of 1,239 students who are enrolled in schools in Tontitown, 344 (27.8%) attend a private institution, while the remaining 895 (72.2%) are enrolled in public schools. The age group of 25 to 34 year olds has the highest likelihood of being enrolled in private schools, with 37 (86.1% in the age bracket) enrolled. Conversely, the age group of 15 to 17 year olds has the lowest likelihood of being enrolled in a private school, with 259 (94.5% in the age bracket) attending a public institution.
| Age Bracket | Public School | Private School |
| 3 to 4 Year Olds | 15 (33.3%) | 30 (66.7%) |
| 5 to 9 Year Old | 137 (55.7%) | 109 (44.3%) |
| 10 to 14 Year Olds | 237 (72.9%) | 88 (27.1%) |
| 15 to 17 Year Olds | 259 (94.5%) | 15 (5.5%) |
| 18 to 19 Year Olds | 20 (74.1%) | 7 (25.9%) |
| 20 to 24 Year Olds | 186 (85.7%) | 31 (14.3%) |
| 25 to 34 Year Olds | 6 (14.0%) | 37 (86.1%) |
| 35 Years and over | 34 (54.8%) | 28 (45.2%) |
| Total | 895 (72.2%) | 344 (27.8%) |
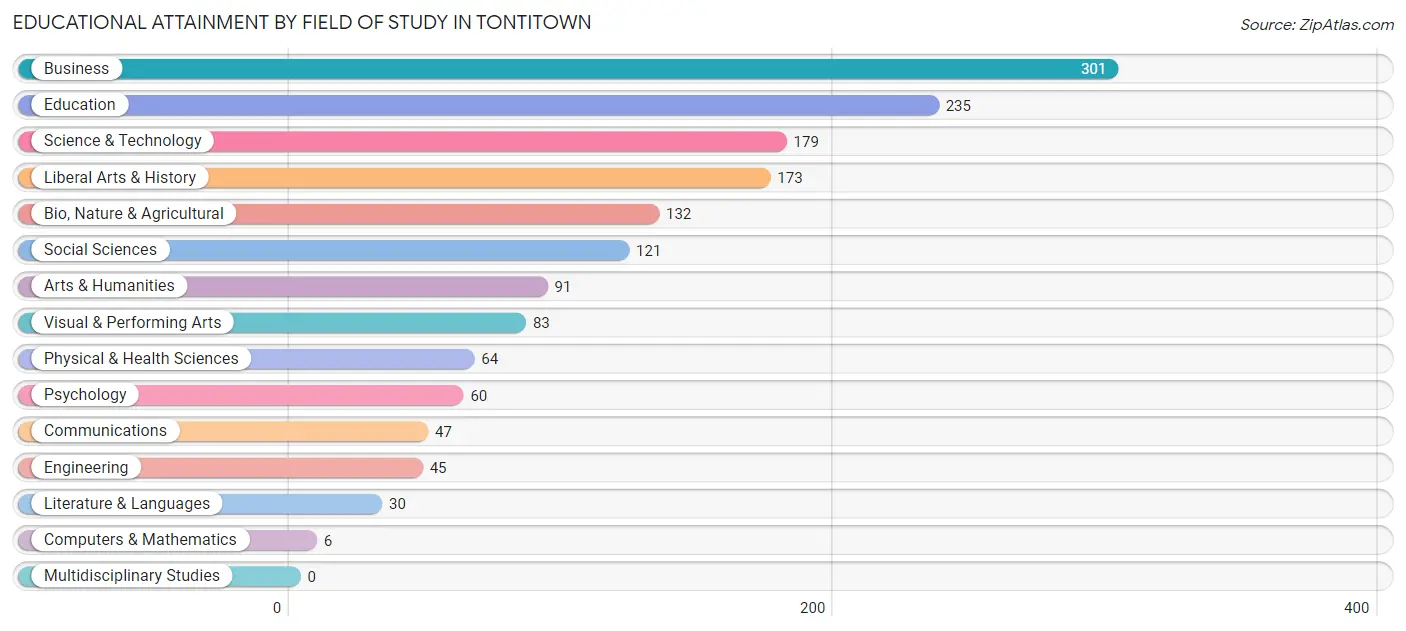
Educational Attainment by Field of Study in Tontitown
Business (301 | 19.2%), education (235 | 15.0%), science & technology (179 | 11.4%), liberal arts & history (173 | 11.0%), and bio, nature & agricultural (132 | 8.4%) are the most common fields of study among 1,567 individuals in Tontitown who have obtained a bachelor's degree or higher.
| Field of Study | # Graduates | % Graduates |
| Computers & Mathematics | 6 | 0.4% |
| Bio, Nature & Agricultural | 132 | 8.4% |
| Physical & Health Sciences | 64 | 4.1% |
| Psychology | 60 | 3.8% |
| Social Sciences | 121 | 7.7% |
| Engineering | 45 | 2.9% |
| Multidisciplinary Studies | 0 | 0.0% |
| Science & Technology | 179 | 11.4% |
| Business | 301 | 19.2% |
| Education | 235 | 15.0% |
| Literature & Languages | 30 | 1.9% |
| Liberal Arts & History | 173 | 11.0% |
| Visual & Performing Arts | 83 | 5.3% |
| Communications | 47 | 3.0% |
| Arts & Humanities | 91 | 5.8% |
| Total | 1,567 | 100.0% |
Transportation & Commute in Tontitown
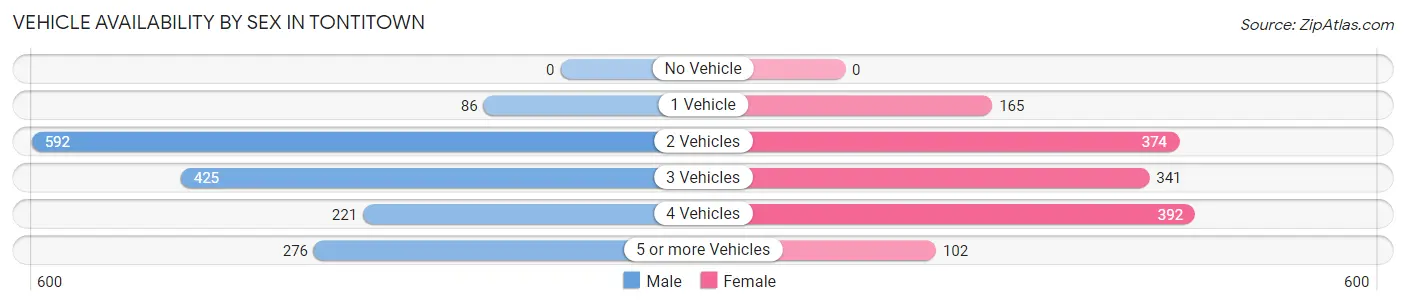
Vehicle Availability by Sex in Tontitown
The most prevalent vehicle ownership categories in Tontitown are males with 2 vehicles (592, accounting for 37.0%) and females with 2 vehicles (374, making up 43.1%).
| Vehicles Available | Male | Female |
| No Vehicle | 0 (0.0%) | 0 (0.0%) |
| 1 Vehicle | 86 (5.4%) | 165 (12.0%) |
| 2 Vehicles | 592 (37.0%) | 374 (27.2%) |
| 3 Vehicles | 425 (26.6%) | 341 (24.8%) |
| 4 Vehicles | 221 (13.8%) | 392 (28.5%) |
| 5 or more Vehicles | 276 (17.2%) | 102 (7.4%) |
| Total | 1,600 (100.0%) | 1,374 (100.0%) |
Commute Time in Tontitown
The most frequently occuring commute durations in Tontitown are 15 to 19 minutes (650 commuters, 25.2%), 10 to 14 minutes (438 commuters, 17.0%), and 20 to 24 minutes (370 commuters, 14.3%).
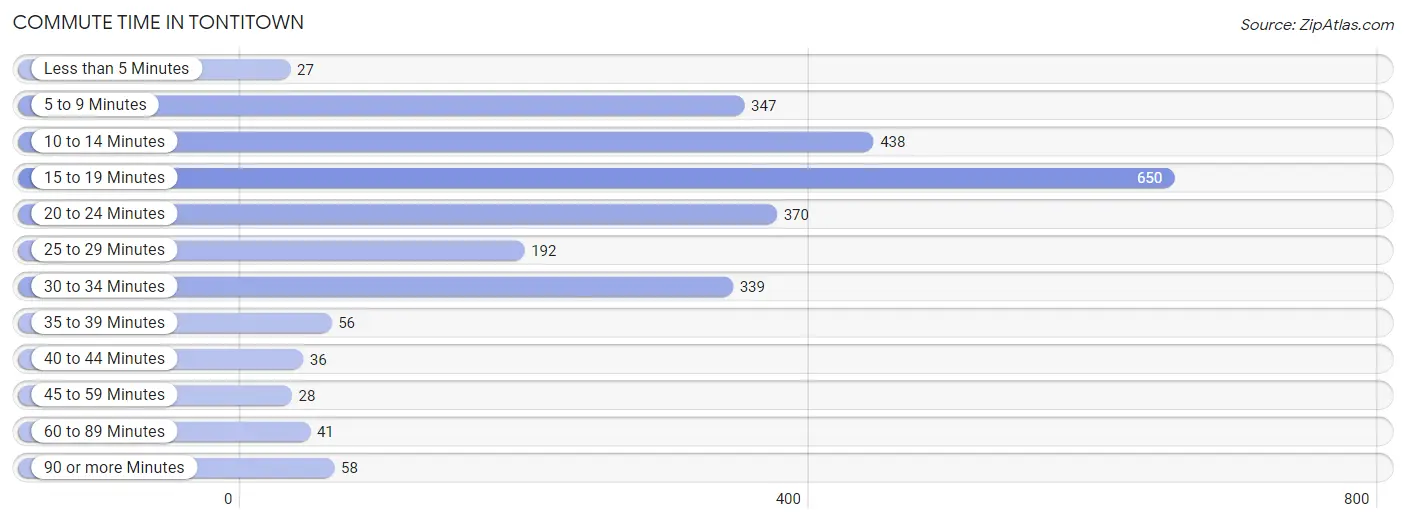
| Commute Time | # Commuters | % Commuters |
| Less than 5 Minutes | 27 | 1.1% |
| 5 to 9 Minutes | 347 | 13.4% |
| 10 to 14 Minutes | 438 | 17.0% |
| 15 to 19 Minutes | 650 | 25.2% |
| 20 to 24 Minutes | 370 | 14.3% |
| 25 to 29 Minutes | 192 | 7.4% |
| 30 to 34 Minutes | 339 | 13.1% |
| 35 to 39 Minutes | 56 | 2.2% |
| 40 to 44 Minutes | 36 | 1.4% |
| 45 to 59 Minutes | 28 | 1.1% |
| 60 to 89 Minutes | 41 | 1.6% |
| 90 or more Minutes | 58 | 2.2% |
Commute Time by Sex in Tontitown
The most common commute times in Tontitown are 15 to 19 minutes (397 commuters, 26.4%) for males and 5 to 9 minutes (304 commuters, 28.2%) for females.
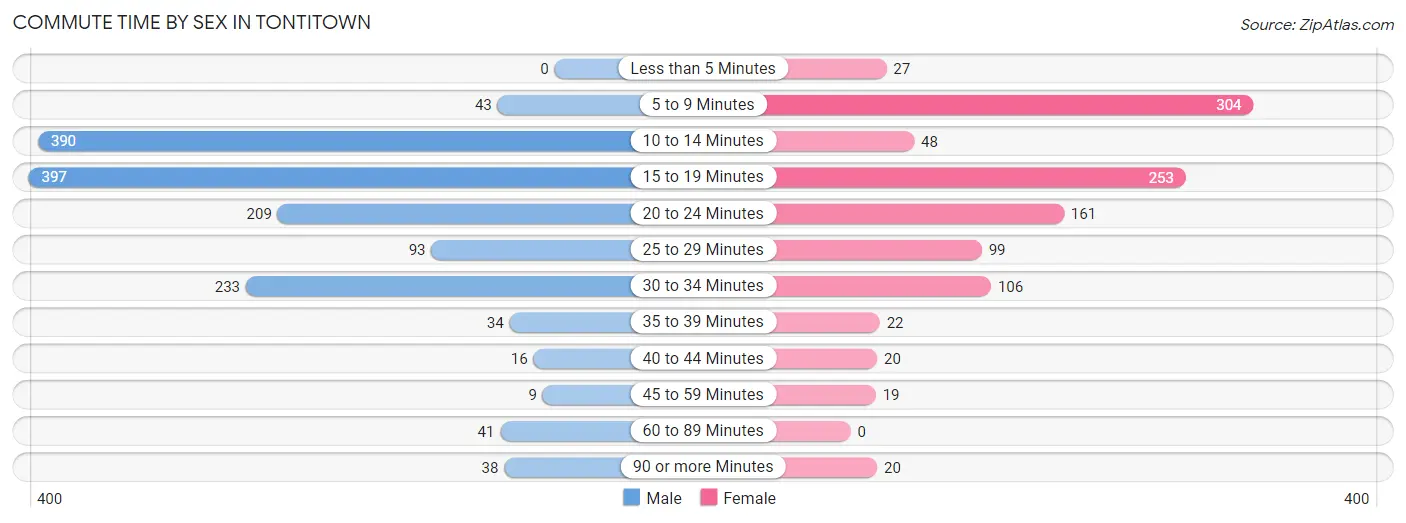
| Commute Time | Male | Female |
| Less than 5 Minutes | 0 (0.0%) | 27 (2.5%) |
| 5 to 9 Minutes | 43 (2.9%) | 304 (28.2%) |
| 10 to 14 Minutes | 390 (26.0%) | 48 (4.4%) |
| 15 to 19 Minutes | 397 (26.4%) | 253 (23.4%) |
| 20 to 24 Minutes | 209 (13.9%) | 161 (14.9%) |
| 25 to 29 Minutes | 93 (6.2%) | 99 (9.2%) |
| 30 to 34 Minutes | 233 (15.5%) | 106 (9.8%) |
| 35 to 39 Minutes | 34 (2.3%) | 22 (2.0%) |
| 40 to 44 Minutes | 16 (1.1%) | 20 (1.8%) |
| 45 to 59 Minutes | 9 (0.6%) | 19 (1.8%) |
| 60 to 89 Minutes | 41 (2.7%) | 0 (0.0%) |
| 90 or more Minutes | 38 (2.5%) | 20 (1.8%) |
Time of Departure to Work by Sex in Tontitown
The most frequent times of departure to work in Tontitown are 7:30 AM to 7:59 AM (414, 27.5%) for males and 7:00 AM to 7:29 AM (323, 29.9%) for females.
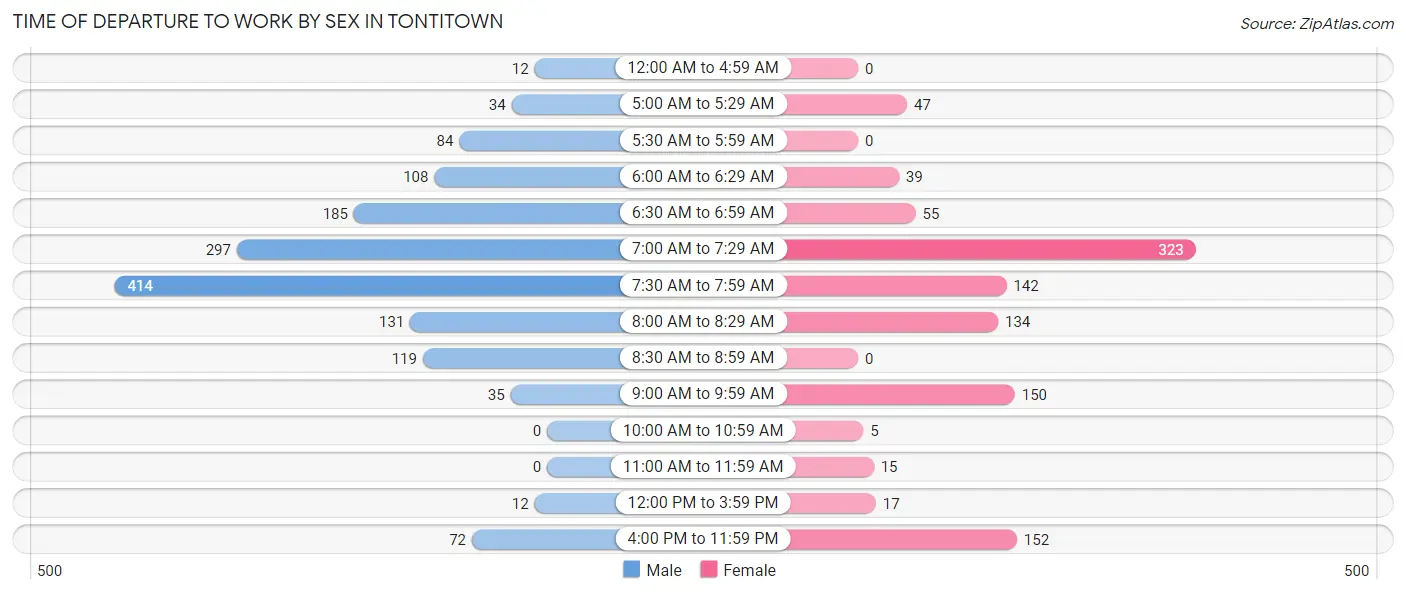
| Time of Departure | Male | Female |
| 12:00 AM to 4:59 AM | 12 (0.8%) | 0 (0.0%) |
| 5:00 AM to 5:29 AM | 34 (2.3%) | 47 (4.4%) |
| 5:30 AM to 5:59 AM | 84 (5.6%) | 0 (0.0%) |
| 6:00 AM to 6:29 AM | 108 (7.2%) | 39 (3.6%) |
| 6:30 AM to 6:59 AM | 185 (12.3%) | 55 (5.1%) |
| 7:00 AM to 7:29 AM | 297 (19.8%) | 323 (29.9%) |
| 7:30 AM to 7:59 AM | 414 (27.5%) | 142 (13.2%) |
| 8:00 AM to 8:29 AM | 131 (8.7%) | 134 (12.4%) |
| 8:30 AM to 8:59 AM | 119 (7.9%) | 0 (0.0%) |
| 9:00 AM to 9:59 AM | 35 (2.3%) | 150 (13.9%) |
| 10:00 AM to 10:59 AM | 0 (0.0%) | 5 (0.5%) |
| 11:00 AM to 11:59 AM | 0 (0.0%) | 15 (1.4%) |
| 12:00 PM to 3:59 PM | 12 (0.8%) | 17 (1.6%) |
| 4:00 PM to 11:59 PM | 72 (4.8%) | 152 (14.1%) |
| Total | 1,503 (100.0%) | 1,079 (100.0%) |
Housing Occupancy in Tontitown
Occupancy by Ownership in Tontitown
Of the total 1,887 dwellings in Tontitown, owner-occupied units account for 1,549 (82.1%), while renter-occupied units make up 338 (17.9%).
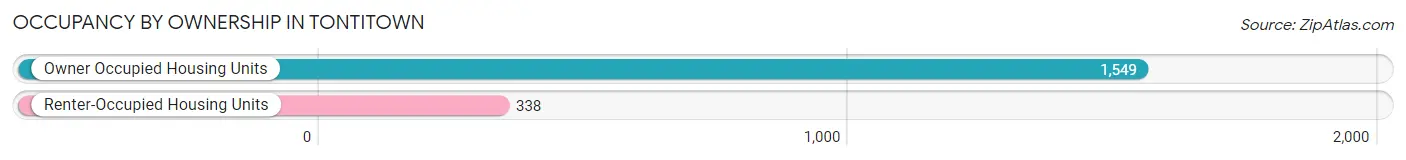
| Occupancy | # Housing Units | % Housing Units |
| Owner Occupied Housing Units | 1,549 | 82.1% |
| Renter-Occupied Housing Units | 338 | 17.9% |
| Total Occupied Housing Units | 1,887 | 100.0% |
Occupancy by Household Size in Tontitown
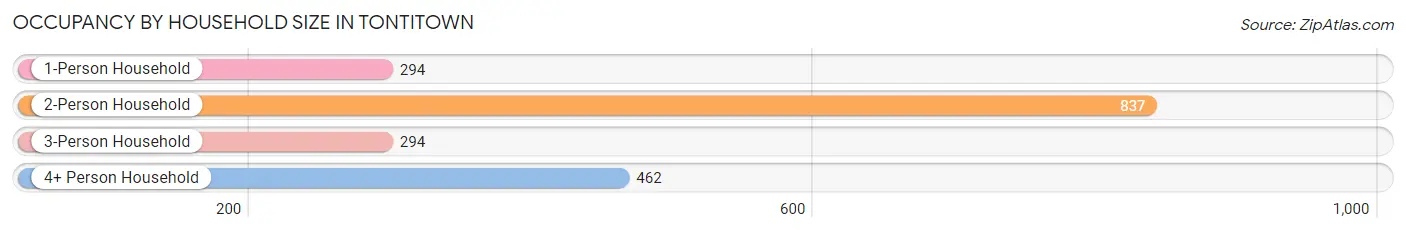
| Household Size | # Housing Units | % Housing Units |
| 1-Person Household | 294 | 15.6% |
| 2-Person Household | 837 | 44.4% |
| 3-Person Household | 294 | 15.6% |
| 4+ Person Household | 462 | 24.5% |
| Total Housing Units | 1,887 | 100.0% |
Occupancy by Ownership by Household Size in Tontitown
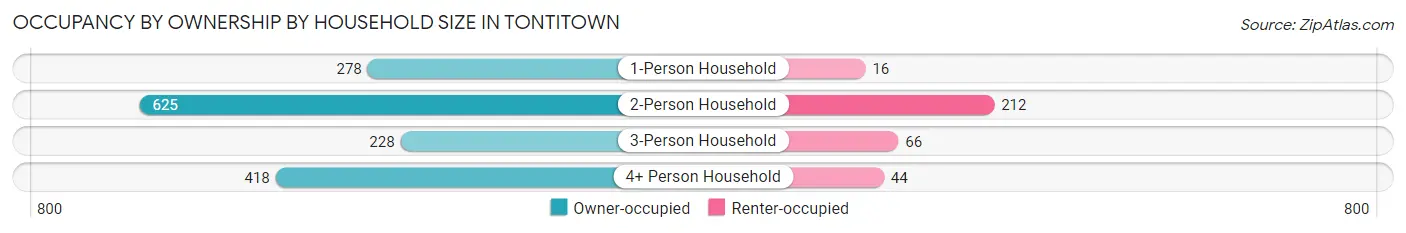
| Household Size | Owner-occupied | Renter-occupied |
| 1-Person Household | 278 (94.6%) | 16 (5.4%) |
| 2-Person Household | 625 (74.7%) | 212 (25.3%) |
| 3-Person Household | 228 (77.5%) | 66 (22.5%) |
| 4+ Person Household | 418 (90.5%) | 44 (9.5%) |
| Total Housing Units | 1,549 (82.1%) | 338 (17.9%) |
Occupancy by Educational Attainment in Tontitown
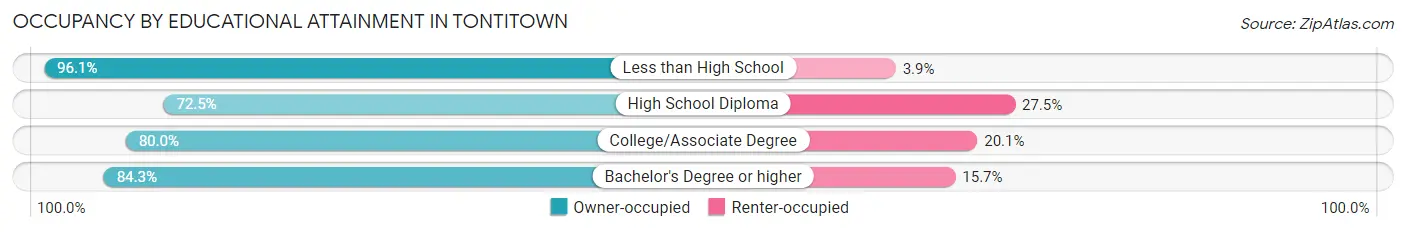
| Household Size | Owner-occupied | Renter-occupied |
| Less than High School | 223 (96.1%) | 9 (3.9%) |
| High School Diploma | 321 (72.5%) | 122 (27.5%) |
| College/Associate Degree | 307 (79.9%) | 77 (20.1%) |
| Bachelor's Degree or higher | 698 (84.3%) | 130 (15.7%) |
Occupancy by Age of Householder in Tontitown
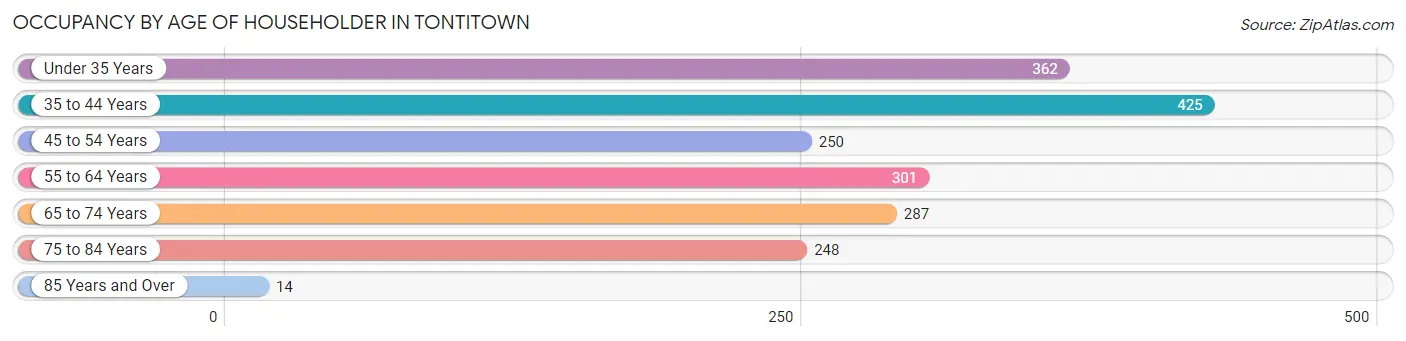
| Age Bracket | # Households | % Households |
| Under 35 Years | 362 | 19.2% |
| 35 to 44 Years | 425 | 22.5% |
| 45 to 54 Years | 250 | 13.3% |
| 55 to 64 Years | 301 | 16.0% |
| 65 to 74 Years | 287 | 15.2% |
| 75 to 84 Years | 248 | 13.1% |
| 85 Years and Over | 14 | 0.7% |
| Total | 1,887 | 100.0% |
Housing Finances in Tontitown
Median Income by Occupancy in Tontitown
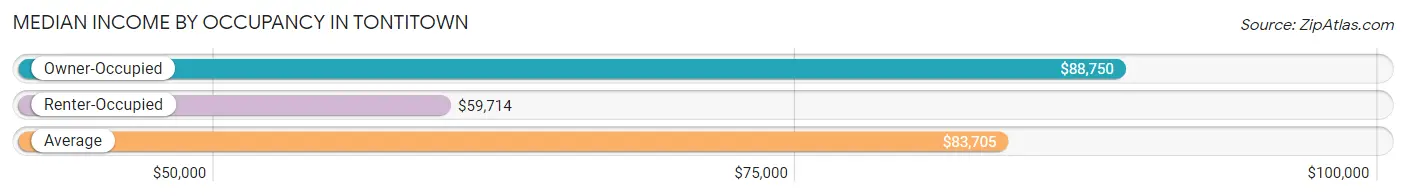
| Occupancy Type | # Households | Median Income |
| Owner-Occupied | 1,549 (82.1%) | $88,750 |
| Renter-Occupied | 338 (17.9%) | $59,714 |
| Average | 1,887 (100.0%) | $83,705 |
Occupancy by Householder Income Bracket in Tontitown
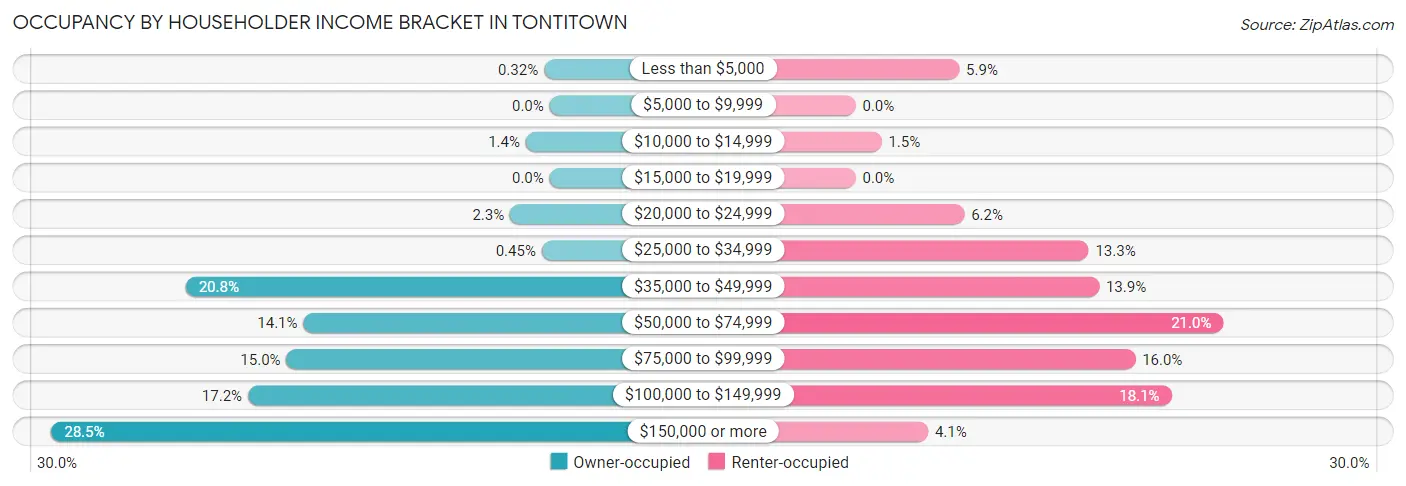
| Income Bracket | Owner-occupied | Renter-occupied |
| Less than $5,000 | 5 (0.3%) | 20 (5.9%) |
| $5,000 to $9,999 | 0 (0.0%) | 0 (0.0%) |
| $10,000 to $14,999 | 21 (1.4%) | 5 (1.5%) |
| $15,000 to $19,999 | 0 (0.0%) | 0 (0.0%) |
| $20,000 to $24,999 | 35 (2.3%) | 21 (6.2%) |
| $25,000 to $34,999 | 7 (0.4%) | 45 (13.3%) |
| $35,000 to $49,999 | 322 (20.8%) | 47 (13.9%) |
| $50,000 to $74,999 | 218 (14.1%) | 71 (21.0%) |
| $75,000 to $99,999 | 233 (15.0%) | 54 (16.0%) |
| $100,000 to $149,999 | 267 (17.2%) | 61 (18.0%) |
| $150,000 or more | 441 (28.5%) | 14 (4.1%) |
| Total | 1,549 (100.0%) | 338 (100.0%) |
Monthly Housing Cost Tiers in Tontitown
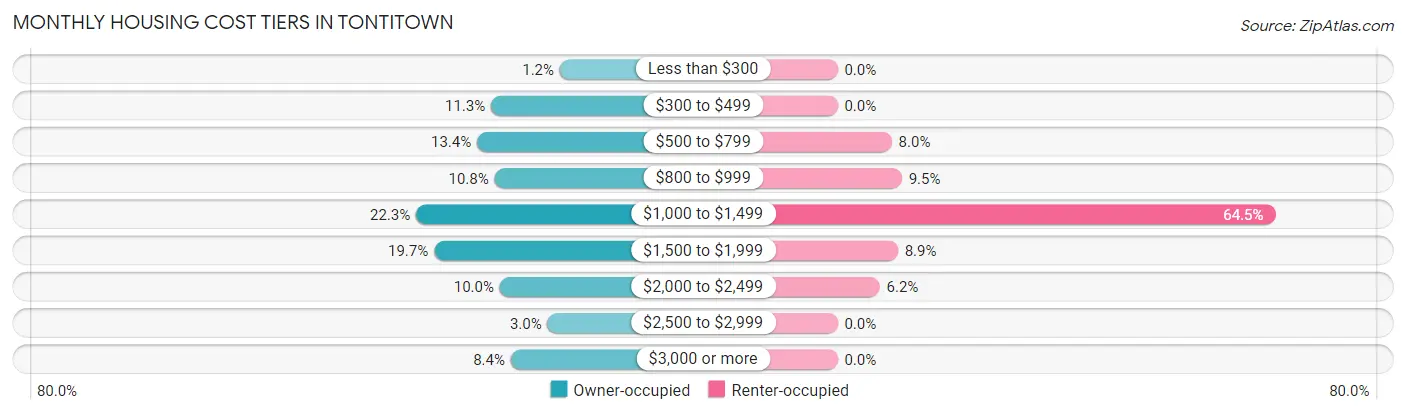
| Monthly Cost | Owner-occupied | Renter-occupied |
| Less than $300 | 18 (1.2%) | 0 (0.0%) |
| $300 to $499 | 175 (11.3%) | 0 (0.0%) |
| $500 to $799 | 207 (13.4%) | 27 (8.0%) |
| $800 to $999 | 167 (10.8%) | 32 (9.5%) |
| $1,000 to $1,499 | 346 (22.3%) | 218 (64.5%) |
| $1,500 to $1,999 | 305 (19.7%) | 30 (8.9%) |
| $2,000 to $2,499 | 155 (10.0%) | 21 (6.2%) |
| $2,500 to $2,999 | 46 (3.0%) | 0 (0.0%) |
| $3,000 or more | 130 (8.4%) | 0 (0.0%) |
| Total | 1,549 (100.0%) | 338 (100.0%) |
Physical Housing Characteristics in Tontitown
Housing Structures in Tontitown
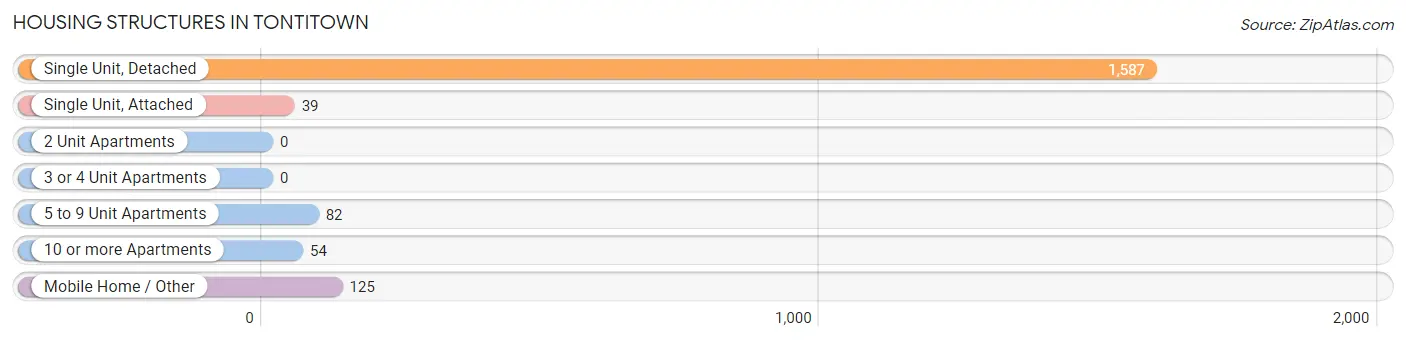
| Structure Type | # Housing Units | % Housing Units |
| Single Unit, Detached | 1,587 | 84.1% |
| Single Unit, Attached | 39 | 2.1% |
| 2 Unit Apartments | 0 | 0.0% |
| 3 or 4 Unit Apartments | 0 | 0.0% |
| 5 to 9 Unit Apartments | 82 | 4.3% |
| 10 or more Apartments | 54 | 2.9% |
| Mobile Home / Other | 125 | 6.6% |
| Total | 1,887 | 100.0% |
Housing Structures by Occupancy in Tontitown
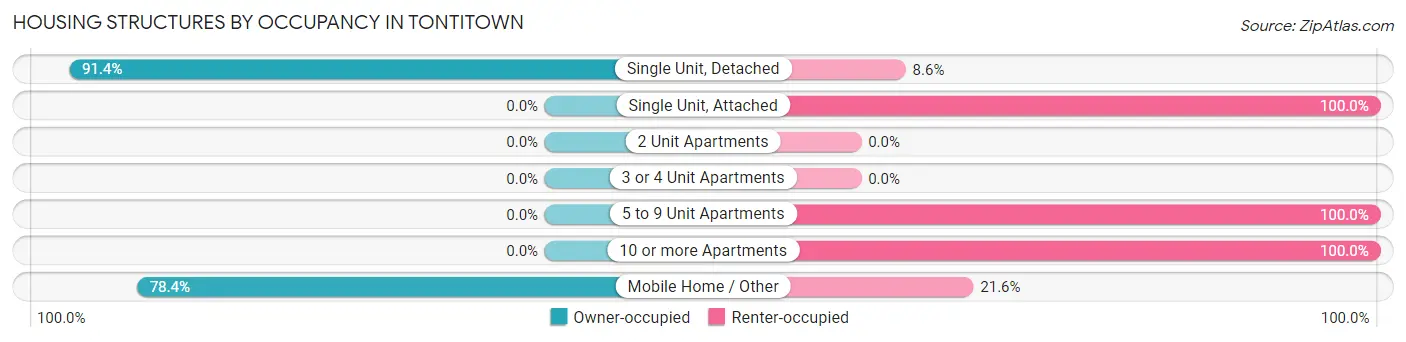
| Structure Type | Owner-occupied | Renter-occupied |
| Single Unit, Detached | 1,451 (91.4%) | 136 (8.6%) |
| Single Unit, Attached | 0 (0.0%) | 39 (100.0%) |
| 2 Unit Apartments | 0 (0.0%) | 0 (0.0%) |
| 3 or 4 Unit Apartments | 0 (0.0%) | 0 (0.0%) |
| 5 to 9 Unit Apartments | 0 (0.0%) | 82 (100.0%) |
| 10 or more Apartments | 0 (0.0%) | 54 (100.0%) |
| Mobile Home / Other | 98 (78.4%) | 27 (21.6%) |
| Total | 1,549 (82.1%) | 338 (17.9%) |
Housing Structures by Number of Rooms in Tontitown
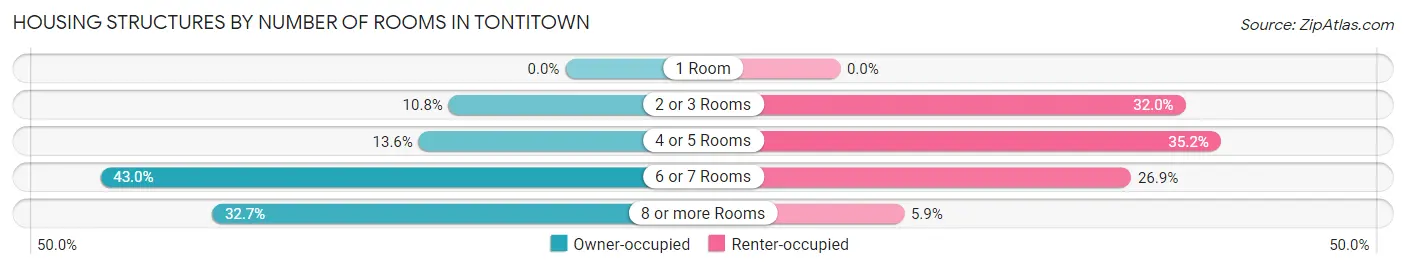
| Number of Rooms | Owner-occupied | Renter-occupied |
| 1 Room | 0 (0.0%) | 0 (0.0%) |
| 2 or 3 Rooms | 167 (10.8%) | 108 (32.0%) |
| 4 or 5 Rooms | 210 (13.6%) | 119 (35.2%) |
| 6 or 7 Rooms | 666 (43.0%) | 91 (26.9%) |
| 8 or more Rooms | 506 (32.7%) | 20 (5.9%) |
| Total | 1,549 (100.0%) | 338 (100.0%) |
Housing Structure by Heating Type in Tontitown
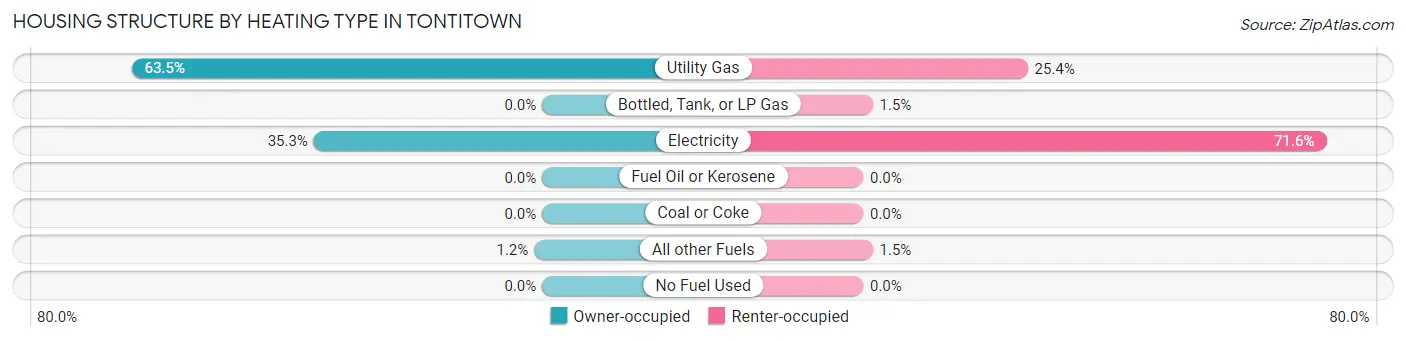
| Heating Type | Owner-occupied | Renter-occupied |
| Utility Gas | 983 (63.5%) | 86 (25.4%) |
| Bottled, Tank, or LP Gas | 0 (0.0%) | 5 (1.5%) |
| Electricity | 547 (35.3%) | 242 (71.6%) |
| Fuel Oil or Kerosene | 0 (0.0%) | 0 (0.0%) |
| Coal or Coke | 0 (0.0%) | 0 (0.0%) |
| All other Fuels | 19 (1.2%) | 5 (1.5%) |
| No Fuel Used | 0 (0.0%) | 0 (0.0%) |
| Total | 1,549 (100.0%) | 338 (100.0%) |
Household Vehicle Usage in Tontitown
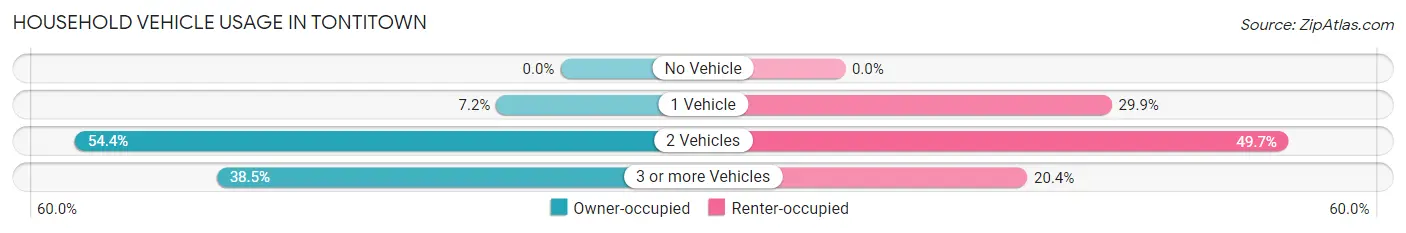
| Vehicles per Household | Owner-occupied | Renter-occupied |
| No Vehicle | 0 (0.0%) | 0 (0.0%) |
| 1 Vehicle | 111 (7.2%) | 101 (29.9%) |
| 2 Vehicles | 842 (54.4%) | 168 (49.7%) |
| 3 or more Vehicles | 596 (38.5%) | 69 (20.4%) |
| Total | 1,549 (100.0%) | 338 (100.0%) |
Real Estate & Mortgages in Tontitown
Real Estate and Mortgage Overview in Tontitown
| Characteristic | Without Mortgage | With Mortgage |
| Housing Units | 580 | 969 |
| Median Property Value | $426,400 | $322,600 |
| Median Household Income | $65,650 | $341 |
| Monthly Housing Costs | $569 | $130 |
| Real Estate Taxes | $2,275 | $0 |
Property Value by Mortgage Status in Tontitown
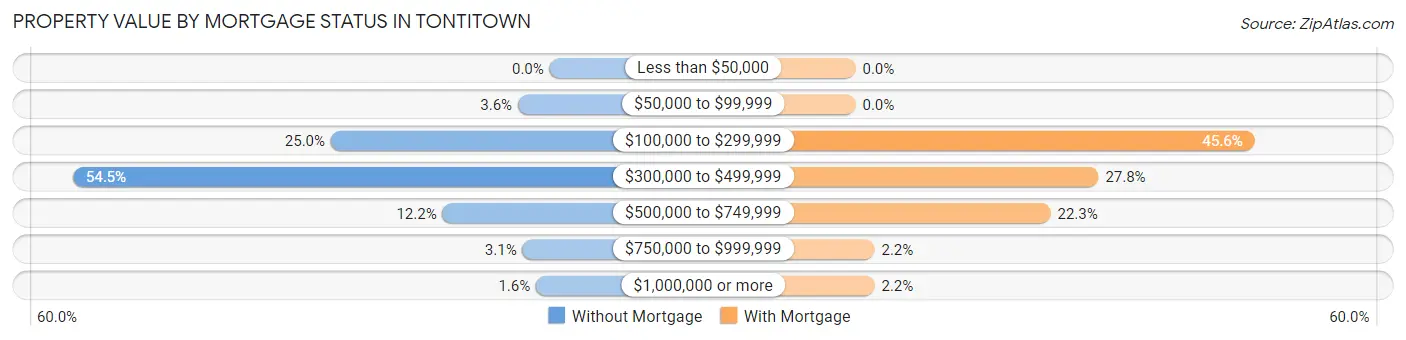
| Property Value | Without Mortgage | With Mortgage |
| Less than $50,000 | 0 (0.0%) | 0 (0.0%) |
| $50,000 to $99,999 | 21 (3.6%) | 0 (0.0%) |
| $100,000 to $299,999 | 145 (25.0%) | 442 (45.6%) |
| $300,000 to $499,999 | 316 (54.5%) | 269 (27.8%) |
| $500,000 to $749,999 | 71 (12.2%) | 216 (22.3%) |
| $750,000 to $999,999 | 18 (3.1%) | 21 (2.2%) |
| $1,000,000 or more | 9 (1.5%) | 21 (2.2%) |
| Total | 580 (100.0%) | 969 (100.0%) |
Household Income by Mortgage Status in Tontitown
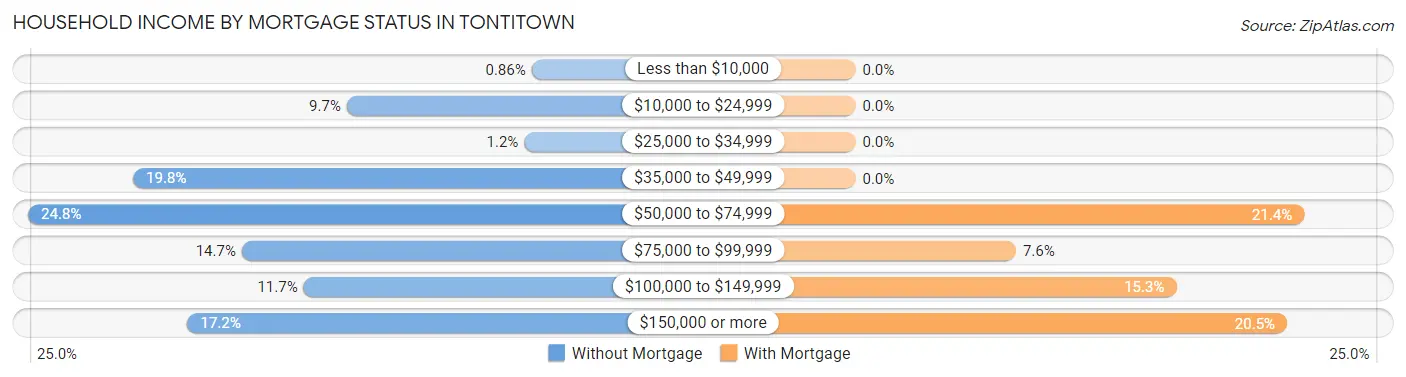
| Household Income | Without Mortgage | With Mortgage |
| Less than $10,000 | 5 (0.9%) | 0 (0.0%) |
| $10,000 to $24,999 | 56 (9.7%) | 0 (0.0%) |
| $25,000 to $34,999 | 7 (1.2%) | 0 (0.0%) |
| $35,000 to $49,999 | 115 (19.8%) | 0 (0.0%) |
| $50,000 to $74,999 | 144 (24.8%) | 207 (21.4%) |
| $75,000 to $99,999 | 85 (14.7%) | 74 (7.6%) |
| $100,000 to $149,999 | 68 (11.7%) | 148 (15.3%) |
| $150,000 or more | 100 (17.2%) | 199 (20.5%) |
| Total | 580 (100.0%) | 969 (100.0%) |
Property Value to Household Income Ratio in Tontitown
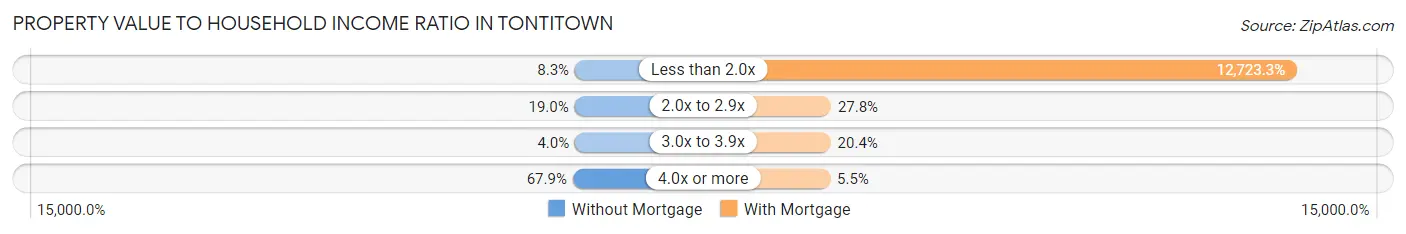
| Value-to-Income Ratio | Without Mortgage | With Mortgage |
| Less than 2.0x | 48 (8.3%) | 123,289 (12,723.3%) |
| 2.0x to 2.9x | 110 (19.0%) | 269 (27.8%) |
| 3.0x to 3.9x | 23 (4.0%) | 198 (20.4%) |
| 4.0x or more | 394 (67.9%) | 53 (5.5%) |
| Total | 580 (100.0%) | 969 (100.0%) |
Real Estate Taxes by Mortgage Status in Tontitown
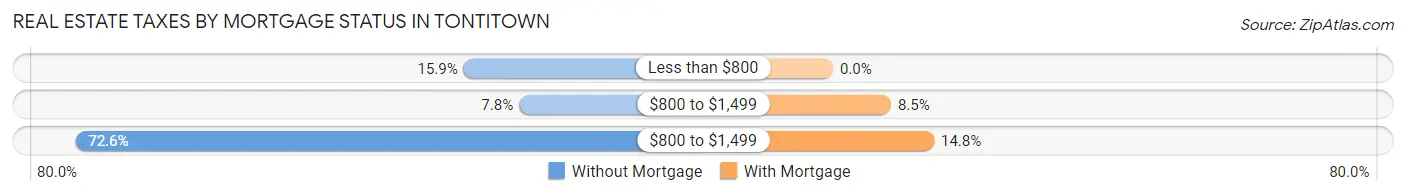
| Property Taxes | Without Mortgage | With Mortgage |
| Less than $800 | 92 (15.9%) | 0 (0.0%) |
| $800 to $1,499 | 45 (7.8%) | 82 (8.5%) |
| $800 to $1,499 | 421 (72.6%) | 143 (14.8%) |
| Total | 580 (100.0%) | 969 (100.0%) |
Health & Disability in Tontitown
Health Insurance Coverage by Age in Tontitown
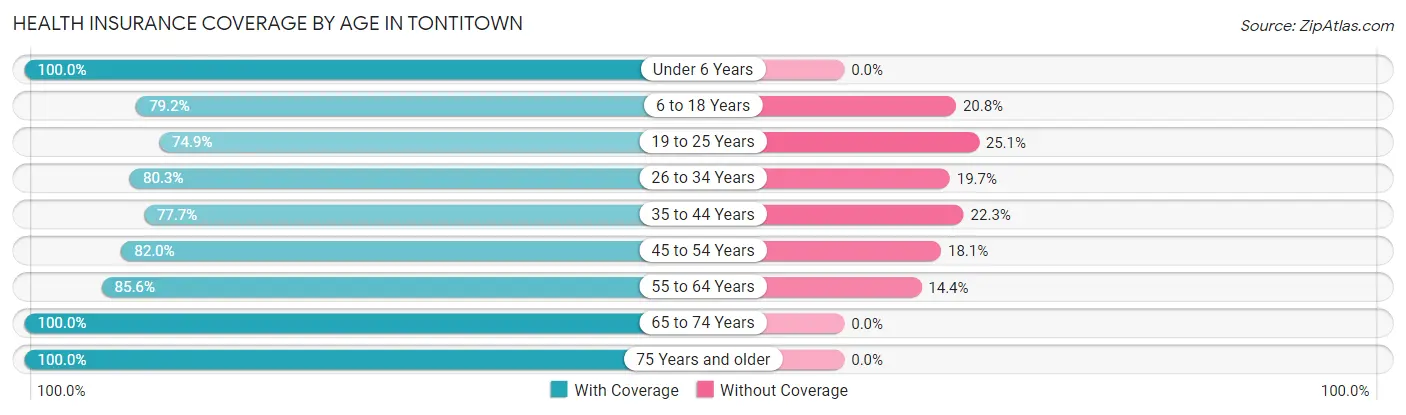
| Age Bracket | With Coverage | Without Coverage |
| Under 6 Years | 314 (100.0%) | 0 (0.0%) |
| 6 to 18 Years | 711 (79.2%) | 187 (20.8%) |
| 19 to 25 Years | 448 (74.9%) | 150 (25.1%) |
| 26 to 34 Years | 347 (80.3%) | 85 (19.7%) |
| 35 to 44 Years | 618 (77.7%) | 177 (22.3%) |
| 45 to 54 Years | 454 (82.0%) | 100 (18.0%) |
| 55 to 64 Years | 435 (85.6%) | 73 (14.4%) |
| 65 to 74 Years | 510 (100.0%) | 0 (0.0%) |
| 75 Years and older | 505 (100.0%) | 0 (0.0%) |
| Total | 4,342 (84.9%) | 772 (15.1%) |
Health Insurance Coverage by Citizenship Status in Tontitown
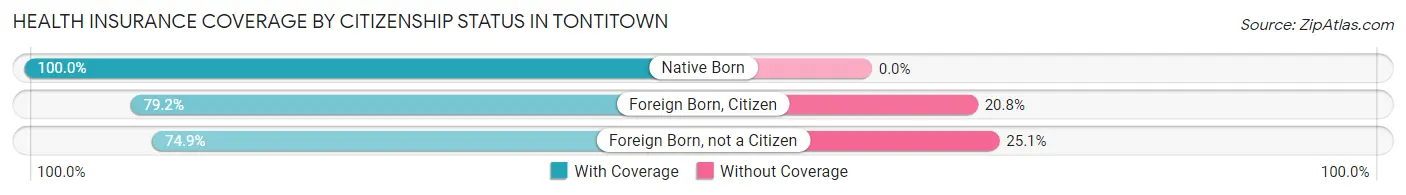
| Citizenship Status | With Coverage | Without Coverage |
| Native Born | 314 (100.0%) | 0 (0.0%) |
| Foreign Born, Citizen | 711 (79.2%) | 187 (20.8%) |
| Foreign Born, not a Citizen | 448 (74.9%) | 150 (25.1%) |
Health Insurance Coverage by Household Income in Tontitown
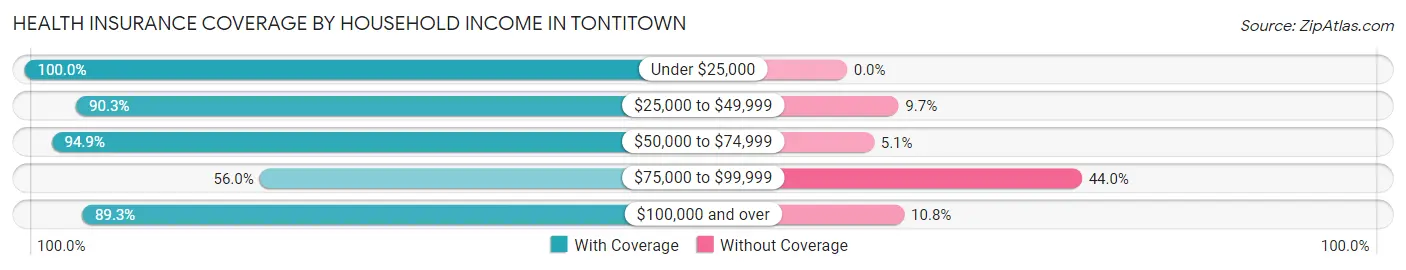
| Household Income | With Coverage | Without Coverage |
| Under $25,000 | 184 (100.0%) | 0 (0.0%) |
| $25,000 to $49,999 | 710 (90.3%) | 76 (9.7%) |
| $50,000 to $74,999 | 638 (94.9%) | 34 (5.1%) |
| $75,000 to $99,999 | 486 (56.0%) | 382 (44.0%) |
| $100,000 and over | 2,324 (89.2%) | 280 (10.7%) |
Public vs Private Health Insurance Coverage by Age in Tontitown
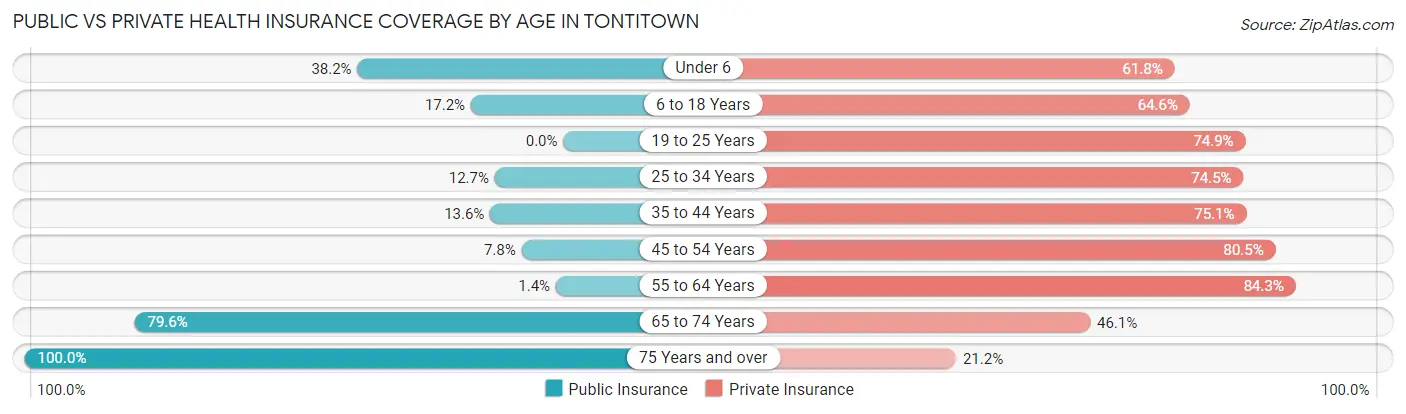
| Age Bracket | Public Insurance | Private Insurance |
| Under 6 | 120 (38.2%) | 194 (61.8%) |
| 6 to 18 Years | 154 (17.2%) | 580 (64.6%) |
| 19 to 25 Years | 0 (0.0%) | 448 (74.9%) |
| 25 to 34 Years | 55 (12.7%) | 322 (74.5%) |
| 35 to 44 Years | 108 (13.6%) | 597 (75.1%) |
| 45 to 54 Years | 43 (7.8%) | 446 (80.5%) |
| 55 to 64 Years | 7 (1.4%) | 428 (84.3%) |
| 65 to 74 Years | 406 (79.6%) | 235 (46.1%) |
| 75 Years and over | 505 (100.0%) | 107 (21.2%) |
| Total | 1,398 (27.3%) | 3,357 (65.6%) |
Disability Status by Sex by Age in Tontitown
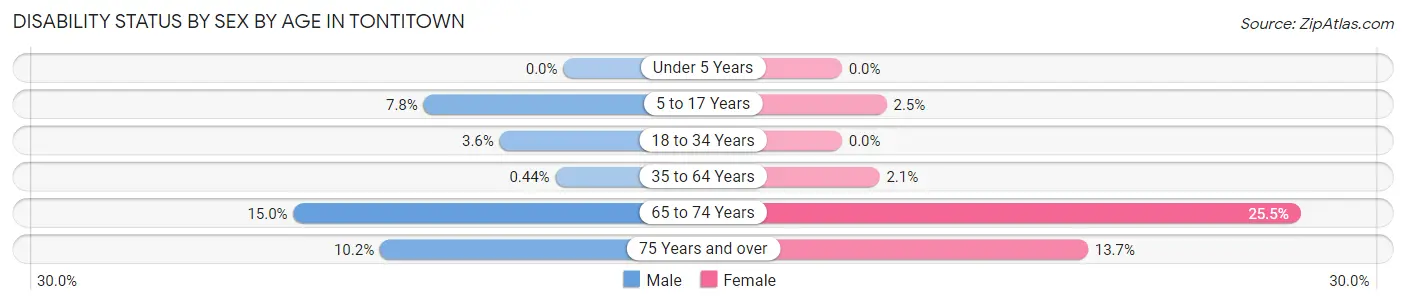
| Age Bracket | Male | Female |
| Under 5 Years | 0 (0.0%) | 0 (0.0%) |
| 5 to 17 Years | 26 (7.8%) | 14 (2.5%) |
| 18 to 34 Years | 21 (3.5%) | 0 (0.0%) |
| 35 to 64 Years | 4 (0.4%) | 20 (2.1%) |
| 65 to 74 Years | 49 (15.0%) | 47 (25.5%) |
| 75 Years and over | 24 (10.2%) | 37 (13.7%) |
Disability Class by Sex by Age in Tontitown
Disability Class: Hearing Difficulty
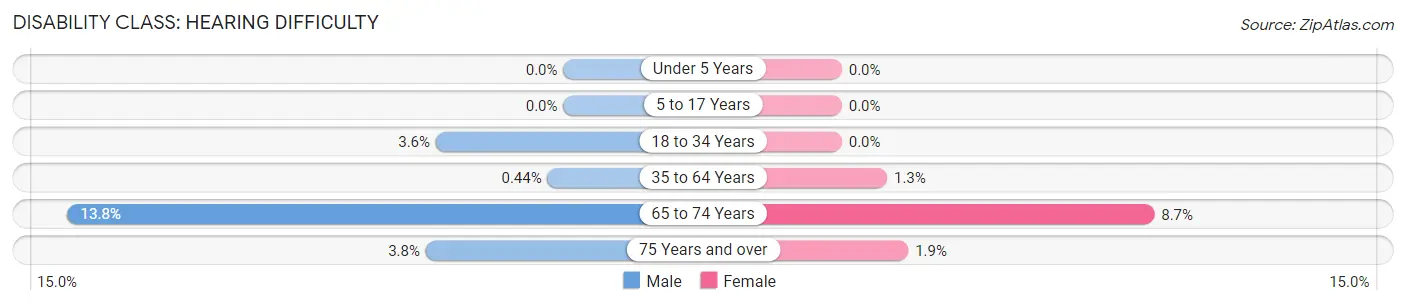
| Age Bracket | Male | Female |
| Under 5 Years | 0 (0.0%) | 0 (0.0%) |
| 5 to 17 Years | 0 (0.0%) | 0 (0.0%) |
| 18 to 34 Years | 21 (3.5%) | 0 (0.0%) |
| 35 to 64 Years | 4 (0.4%) | 12 (1.3%) |
| 65 to 74 Years | 45 (13.8%) | 16 (8.7%) |
| 75 Years and over | 9 (3.8%) | 5 (1.8%) |
Disability Class: Vision Difficulty
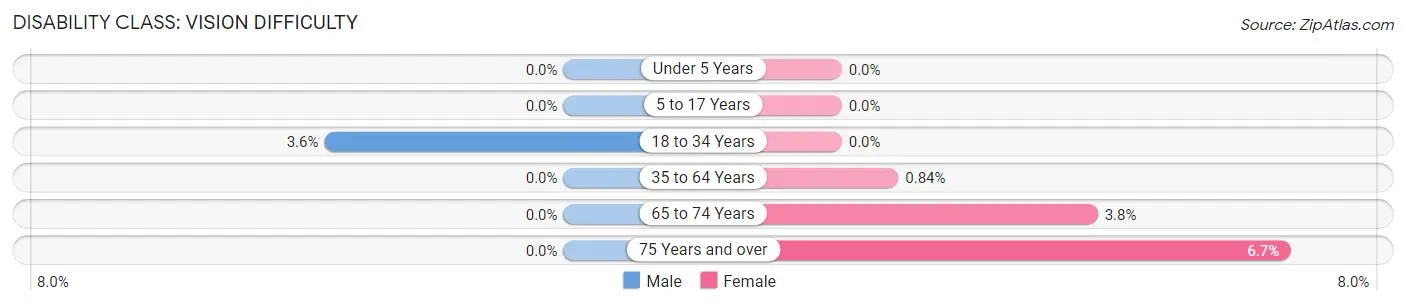
| Age Bracket | Male | Female |
| Under 5 Years | 0 (0.0%) | 0 (0.0%) |
| 5 to 17 Years | 0 (0.0%) | 0 (0.0%) |
| 18 to 34 Years | 21 (3.5%) | 0 (0.0%) |
| 35 to 64 Years | 0 (0.0%) | 8 (0.8%) |
| 65 to 74 Years | 0 (0.0%) | 7 (3.8%) |
| 75 Years and over | 0 (0.0%) | 18 (6.7%) |
Disability Class: Cognitive Difficulty
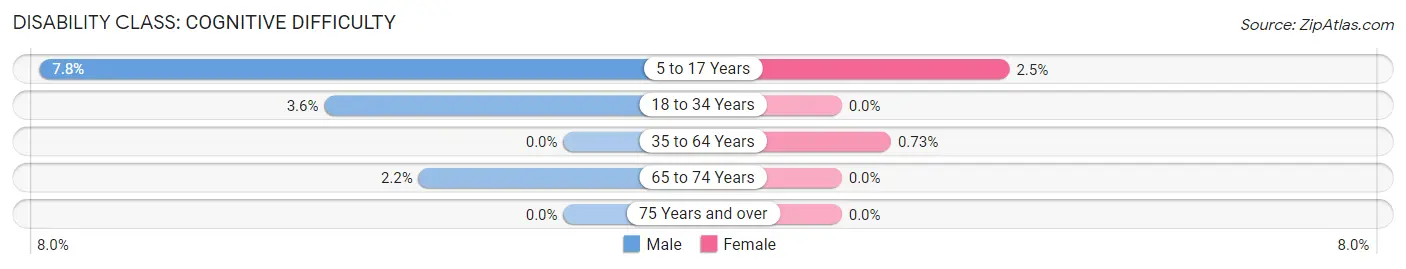
| Age Bracket | Male | Female |
| 5 to 17 Years | 26 (7.8%) | 14 (2.5%) |
| 18 to 34 Years | 21 (3.5%) | 0 (0.0%) |
| 35 to 64 Years | 0 (0.0%) | 7 (0.7%) |
| 65 to 74 Years | 7 (2.1%) | 0 (0.0%) |
| 75 Years and over | 0 (0.0%) | 0 (0.0%) |
Disability Class: Ambulatory Difficulty
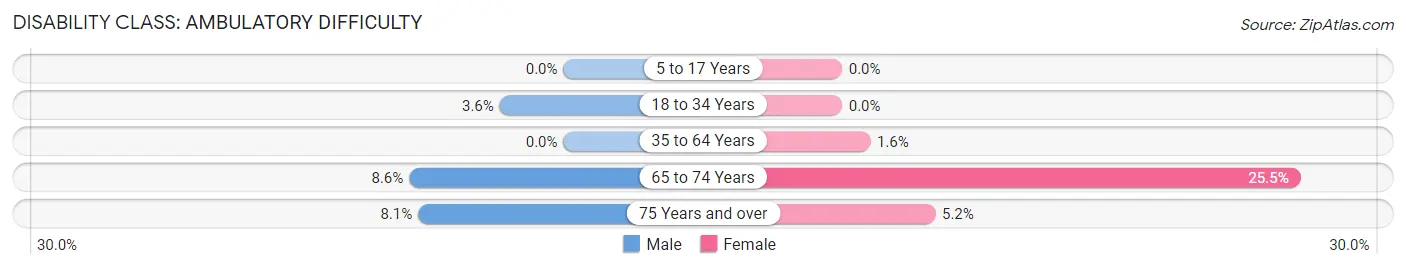
| Age Bracket | Male | Female |
| 5 to 17 Years | 0 (0.0%) | 0 (0.0%) |
| 18 to 34 Years | 21 (3.5%) | 0 (0.0%) |
| 35 to 64 Years | 0 (0.0%) | 15 (1.6%) |
| 65 to 74 Years | 28 (8.6%) | 47 (25.5%) |
| 75 Years and over | 19 (8.1%) | 14 (5.2%) |
Disability Class: Self-Care Difficulty
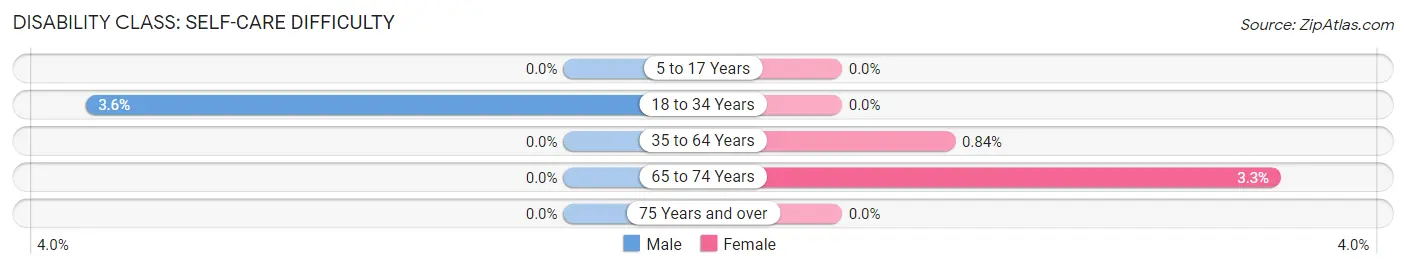
| Age Bracket | Male | Female |
| 5 to 17 Years | 0 (0.0%) | 0 (0.0%) |
| 18 to 34 Years | 21 (3.5%) | 0 (0.0%) |
| 35 to 64 Years | 0 (0.0%) | 8 (0.8%) |
| 65 to 74 Years | 0 (0.0%) | 6 (3.3%) |
| 75 Years and over | 0 (0.0%) | 0 (0.0%) |
Technology Access in Tontitown
Computing Device Access in Tontitown
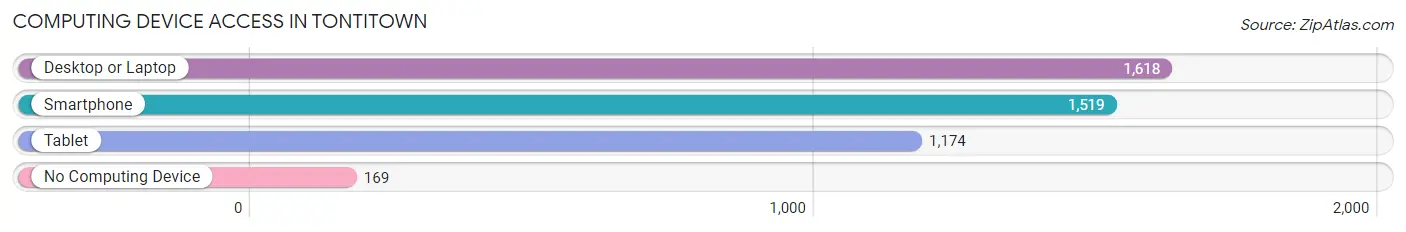
| Device Type | # Households | % Households |
| Desktop or Laptop | 1,618 | 85.7% |
| Smartphone | 1,519 | 80.5% |
| Tablet | 1,174 | 62.2% |
| No Computing Device | 169 | 9.0% |
| Total | 1,887 | 100.0% |
Internet Access in Tontitown
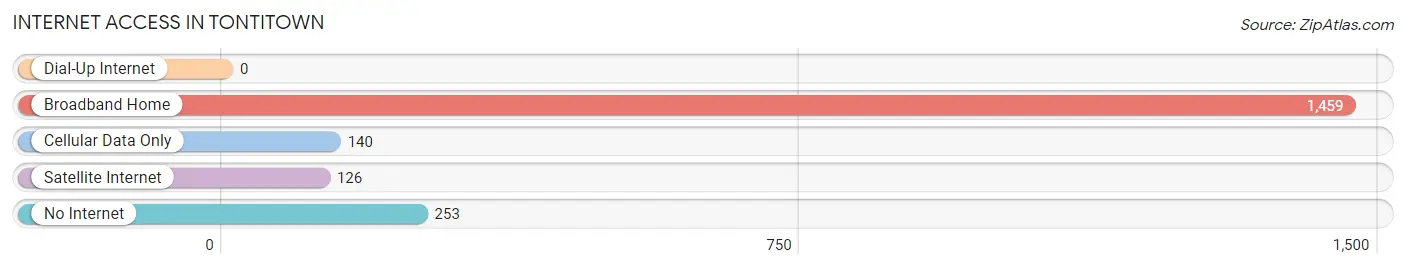
| Internet Type | # Households | % Households |
| Dial-Up Internet | 0 | 0.0% |
| Broadband Home | 1,459 | 77.3% |
| Cellular Data Only | 140 | 7.4% |
| Satellite Internet | 126 | 6.7% |
| No Internet | 253 | 13.4% |
| Total | 1,887 | 100.0% |
Tontitown Summary
Tontitown is a small city located in Washington County, Arkansas, United States. It is part of the Fayetteville–Springdale–Rogers Metropolitan Statistical Area. The population was 1,168 at the 2010 census.
History
Tontitown was founded in 1898 by Italian immigrants who had been recruited by the Frisco Railroad to work in the area. The town was named after Father Pietro Bandini, who was known as "Tonti" to the locals. The immigrants were mostly from the northern Italian region of Friuli-Venezia Giulia. They established a Catholic church, St. Joseph's, and a school, St. Joseph's Academy.
The town was incorporated in 1906 and has remained largely unchanged since then. The town is known for its annual Grape Festival, which is held in August and celebrates the town's Italian heritage.
Geography
Tontitown is located at (36.1899, -94.1745). According to the United States Census Bureau, the city has a total area of 0.9 square miles (2.3 km2), all land.
Economy
Tontitown's economy is largely based on agriculture. The town is home to several wineries and vineyards, as well as a number of small businesses. The town is also home to a number of Italian restaurants, which serve traditional Italian dishes.
Demographics
As of the census of 2000, there were 1,093 people, 393 households, and 305 families residing in the city. The population density was 1,179.3 people per square mile (456.2/km2). There were 412 housing units at an average density of 446.2 per square mile (172.3/km2). The racial makeup of the city was 97.17% White, 0.18% African American, 0.09% Native American, 0.09% Asian, 0.09% Pacific Islander, 0.73% from other races, and 1.73% from two or more races. Hispanic or Latino of any race were 1.37% of the population.
There were 393 households, out of which 37.2% had children under the age of 18 living with them, 63.2% were married couples living together, 8.2% had a female householder with no husband present, and 24.4% were non-families. 21.2% of all households were made up of individuals, and 9.3% had someone living alone who was 65 years of age or older. The average household size was 2.78 and the average family size was 3.25.
In the city, the population was spread out, with 28.7% under the age of 18, 8.2% from 18 to 24, 28.7% from 25 to 44, 22.2% from 45 to 64, and 12.2% who were 65 years of age or older. The median age was 36 years. For every 100 females, there were 97.2 males. For every 100 females age 18 and over, there were 94.2 males.
The median income for a household in the city was $37,500, and the median income for a family was $41,250. Males had a median income of $30,000 versus $21,250 for females. The per capita income for the city was $15,945. About 6.2% of families and 8.2% of the population were below the poverty line, including 10.2% of those under age 18 and 8.2% of those age 65 or over.
Common Questions
What is the Total Population of Tontitown?
Total Population of Tontitown is 5,114.
What is the Total Male Population of Tontitown?
Total Male Population of Tontitown is 2,487.
What is the Total Female Population of Tontitown?
Total Female Population of Tontitown is 2,627.
What is the Ratio of Males per 100 Females in Tontitown?
There are 94.67 Males per 100 Females in Tontitown.
What is the Ratio of Females per 100 Males in Tontitown?
There are 105.63 Females per 100 Males in Tontitown.
What is the Median Population Age in Tontitown?
Median Population Age in Tontitown is 38.8 Years.
What is the Average Family Size in Tontitown
Average Family Size in Tontitown is 3.0 People.
What is the Average Household Size in Tontitown
Average Household Size in Tontitown is 2.7 People.
What is Per Capita Income in Tontitown?
Per Capita income in Tontitown is $45,000.
What is the Median Family Income in Tontitown?
Median Family Income in Tontitown is $100,455.
What is the Median Household income in Tontitown?
Median Household Income in Tontitown is $83,705.
What is Income or Wage Gap in Tontitown?
Income or Wage Gap in Tontitown is 22.4%.
Women in Tontitown earn 77.6 cents for every dollar earned by a man.
What is Inequality or Gini Index in Tontitown?
Inequality or Gini Index in Tontitown is 0.45.
How Large is the Labor Force in Tontitown?
There are 3,049 People in the Labor Forcein in Tontitown.
What is the Percentage of People in the Labor Force in Tontitown?
70.7% of People are in the Labor Force in Tontitown.
What is the Unemployment Rate in Tontitown?
Unemployment Rate in Tontitown is 2.5%.