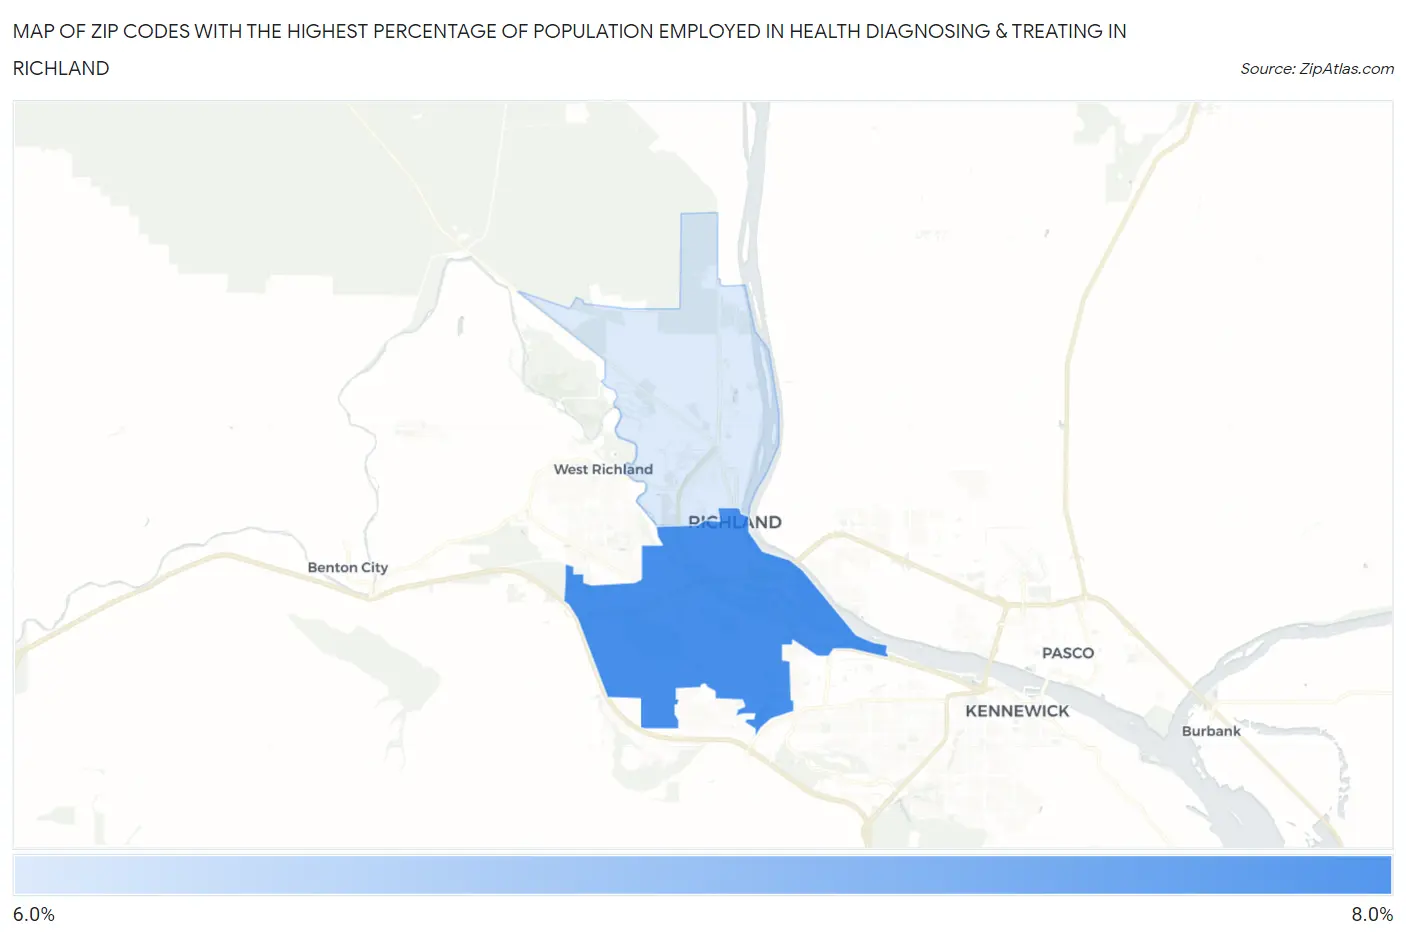
Zip Codes with the Highest Percentage of Population Employed in Health Diagnosing & Treating in Richland, WA
RELATED REPORTS & OPTIONS
Health Diagnosing & Treating
Richland
Compare Zip Codes
Map of Zip Codes with the Highest Percentage of Population Employed in Health Diagnosing & Treating in Richland
0.0%
8.0%
Zip Codes with the Highest Percentage of Population Employed in Health Diagnosing & Treating in Richland, WA
| Zip Code | % Employed | vs State | vs National | |
| 1. | 99352 | 7.6% | 5.6%(+2.09)#85 | 6.2%(+1.40)#8,395 |
| 2. | 99354 | 6.1% | 5.6%(+0.587)#166 | 6.2%(-0.104)#13,365 |
1
Common Questions
What are the Top Zip Codes with the Highest Percentage of Population Employed in Health Diagnosing & Treating in Richland, WA?
Top Zip Codes with the Highest Percentage of Population Employed in Health Diagnosing & Treating in Richland, WA are:
What zip code has the Highest Percentage of Population Employed in Health Diagnosing & Treating in Richland, WA?
99352 has the Highest Percentage of Population Employed in Health Diagnosing & Treating in Richland, WA with 7.6%.
What is the Percentage of Population Employed in Health Diagnosing & Treating in Richland, WA?
Percentage of Population Employed in Health Diagnosing & Treating in Richland is 7.1%.
What is the Percentage of Population Employed in Health Diagnosing & Treating in Washington?
Percentage of Population Employed in Health Diagnosing & Treating in Washington is 5.6%.
What is the Percentage of Population Employed in Health Diagnosing & Treating in the United States?
Percentage of Population Employed in Health Diagnosing & Treating in the United States is 6.2%.