Zip Codes with the Highest Percentage of Population Employed in Food Preparation & Serving in Renton, WA
RELATED REPORTS & OPTIONS
Food Preparation & Serving
Renton
Compare Zip Codes
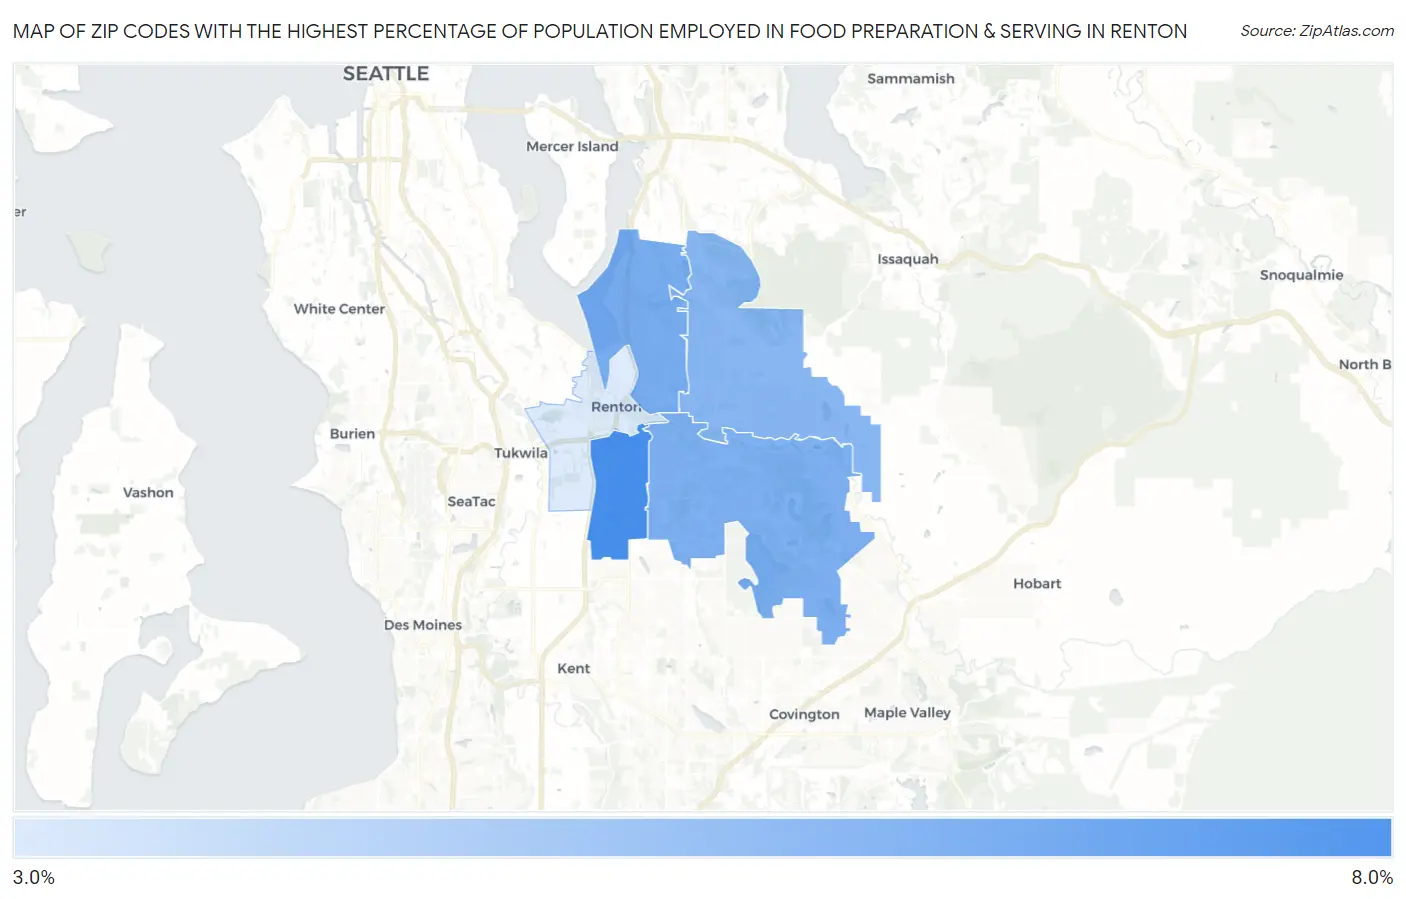
Map of Zip Codes with the Highest Percentage of Population Employed in Food Preparation & Serving in Renton
0.0%
8.0%
Zip Codes with the Highest Percentage of Population Employed in Food Preparation & Serving in Renton, WA
| Zip Code | % Employed | vs State | vs National | |
| 1. | 98055 | 7.4% | 5.1%(+2.23)#99 | 5.3%(+2.09)#5,791 |
| 2. | 98056 | 6.3% | 5.1%(+1.14)#146 | 5.3%(+0.993)#8,491 |
| 3. | 98058 | 6.1% | 5.1%(+0.958)#159 | 5.3%(+0.815)#9,023 |
| 4. | 98059 | 5.9% | 5.1%(+0.772)#166 | 5.3%(+0.629)#9,623 |
| 5. | 98057 | 4.0% | 5.1%(-1.17)#321 | 5.3%(-1.31)#17,228 |
1
Common Questions
What are the Top 3 Zip Codes with the Highest Percentage of Population Employed in Food Preparation & Serving in Renton, WA?
Top 3 Zip Codes with the Highest Percentage of Population Employed in Food Preparation & Serving in Renton, WA are:
What zip code has the Highest Percentage of Population Employed in Food Preparation & Serving in Renton, WA?
98055 has the Highest Percentage of Population Employed in Food Preparation & Serving in Renton, WA with 7.4%.
What is the Percentage of Population Employed in Food Preparation & Serving in Renton, WA?
Percentage of Population Employed in Food Preparation & Serving in Renton is 7.1%.
What is the Percentage of Population Employed in Food Preparation & Serving in Washington?
Percentage of Population Employed in Food Preparation & Serving in Washington is 5.1%.
What is the Percentage of Population Employed in Food Preparation & Serving in the United States?
Percentage of Population Employed in Food Preparation & Serving in the United States is 5.3%.