Zip Codes with the Highest Percentage of Population Employed in Professional & Scientific Services in Renton, WA
RELATED REPORTS & OPTIONS
Professional & Scientific Services
Renton
Compare Zip Codes
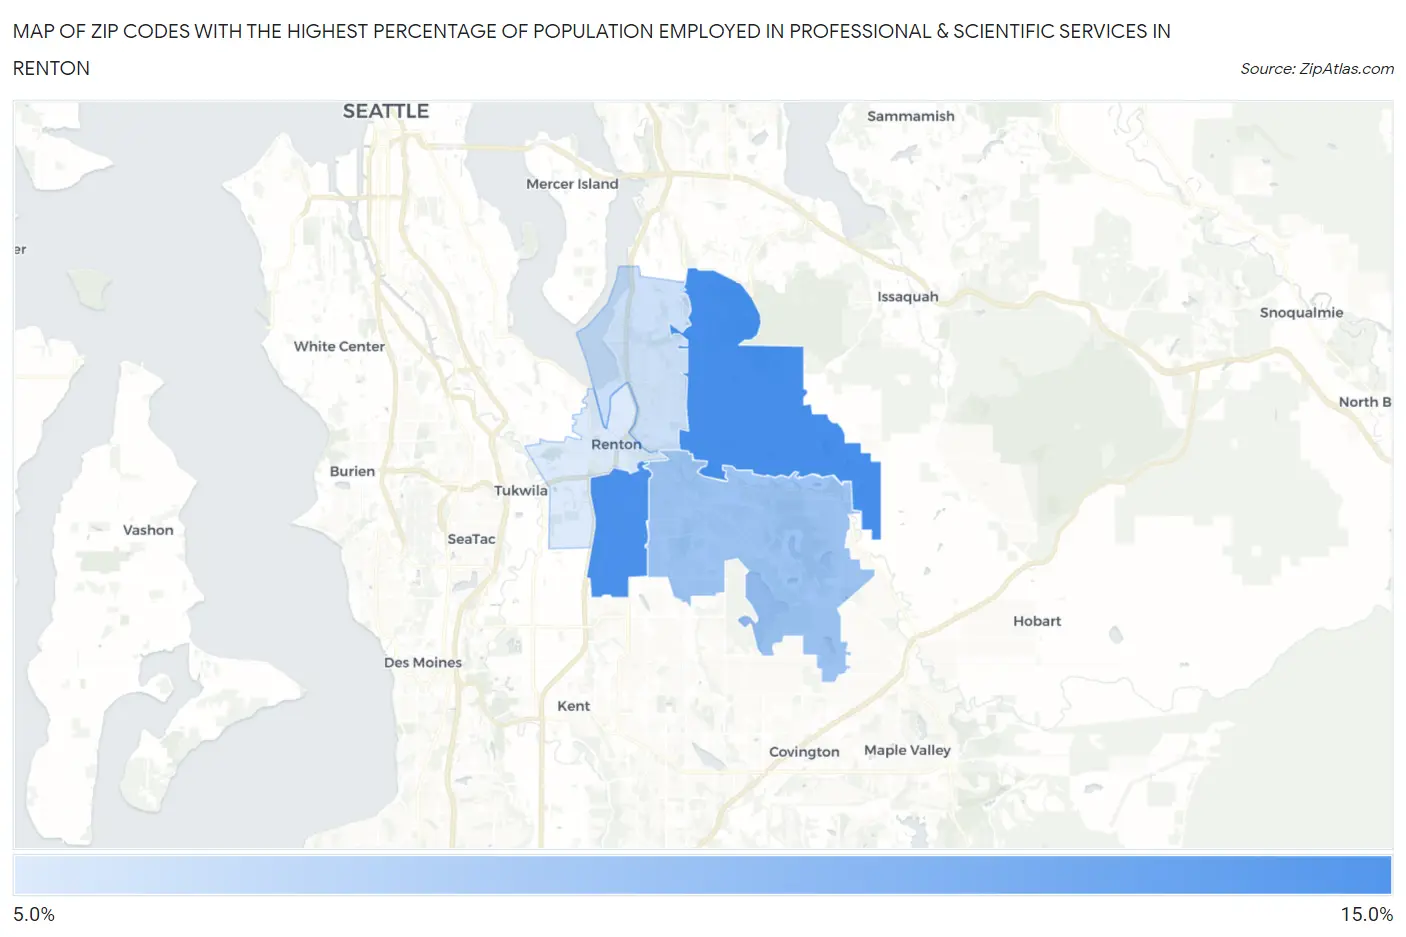
Map of Zip Codes with the Highest Percentage of Population Employed in Professional & Scientific Services in Renton
0.0%
15.0%
Zip Codes with the Highest Percentage of Population Employed in Professional & Scientific Services in Renton, WA
| Zip Code | % Employed | vs State | vs National | |
| 1. | 98059 | 12.9% | 10.3%(+2.54)#73 | 7.8%(+5.02)#2,765 |
| 2. | 98055 | 12.7% | 10.3%(+2.42)#75 | 7.8%(+4.90)#2,812 |
| 3. | 98058 | 10.3% | 10.3%(-0.053)#106 | 7.8%(+2.43)#4,361 |
| 4. | 98056 | 8.9% | 10.3%(-1.41)#136 | 7.8%(+1.07)#5,599 |
| 5. | 98057 | 8.4% | 10.3%(-1.89)#146 | 7.8%(+0.593)#6,087 |
1
Common Questions
What are the Top 3 Zip Codes with the Highest Percentage of Population Employed in Professional & Scientific Services in Renton, WA?
Top 3 Zip Codes with the Highest Percentage of Population Employed in Professional & Scientific Services in Renton, WA are:
What zip code has the Highest Percentage of Population Employed in Professional & Scientific Services in Renton, WA?
98059 has the Highest Percentage of Population Employed in Professional & Scientific Services in Renton, WA with 12.9%.
What is the Percentage of Population Employed in Professional & Scientific Services in Renton, WA?
Percentage of Population Employed in Professional & Scientific Services in Renton is 10.0%.
What is the Percentage of Population Employed in Professional & Scientific Services in Washington?
Percentage of Population Employed in Professional & Scientific Services in Washington is 10.3%.
What is the Percentage of Population Employed in Professional & Scientific Services in the United States?
Percentage of Population Employed in Professional & Scientific Services in the United States is 7.8%.