Zip Codes with the Highest Percentage of Population Employed in Food Preparation & Serving in Redmond, WA
RELATED REPORTS & OPTIONS
Food Preparation & Serving
Redmond
Compare Zip Codes
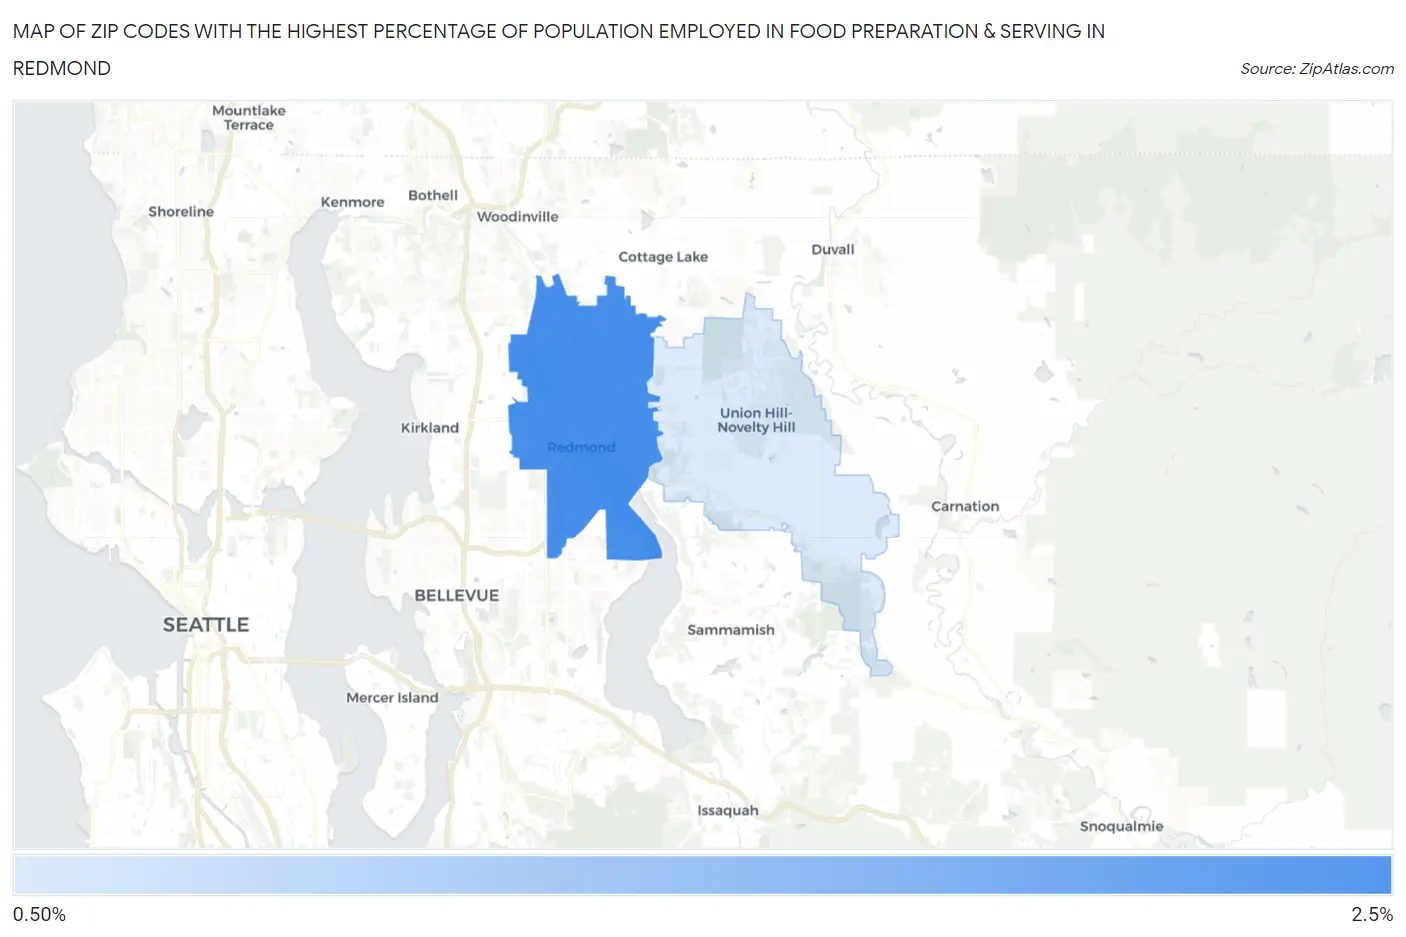
Map of Zip Codes with the Highest Percentage of Population Employed in Food Preparation & Serving in Redmond
0.0%
2.5%
Zip Codes with the Highest Percentage of Population Employed in Food Preparation & Serving in Redmond, WA
| Zip Code | % Employed | vs State | vs National | |
| 1. | 98052 | 2.3% | 5.1%(-2.85)#439 | 5.3%(-3.00)#23,811 |
| 2. | 98053 | 0.94% | 5.1%(-4.21)#492 | 5.3%(-4.35)#27,083 |
1
Common Questions
What are the Top Zip Codes with the Highest Percentage of Population Employed in Food Preparation & Serving in Redmond, WA?
Top Zip Codes with the Highest Percentage of Population Employed in Food Preparation & Serving in Redmond, WA are:
What zip code has the Highest Percentage of Population Employed in Food Preparation & Serving in Redmond, WA?
98052 has the Highest Percentage of Population Employed in Food Preparation & Serving in Redmond, WA with 2.3%.
What is the Percentage of Population Employed in Food Preparation & Serving in Redmond, WA?
Percentage of Population Employed in Food Preparation & Serving in Redmond is 2.4%.
What is the Percentage of Population Employed in Food Preparation & Serving in Washington?
Percentage of Population Employed in Food Preparation & Serving in Washington is 5.1%.
What is the Percentage of Population Employed in Food Preparation & Serving in the United States?
Percentage of Population Employed in Food Preparation & Serving in the United States is 5.3%.