Zip Codes with the Highest Percentage of Population Employed in Food Preparation & Serving in Mount Vernon, WA
RELATED REPORTS & OPTIONS
Food Preparation & Serving
Mount Vernon
Compare Zip Codes
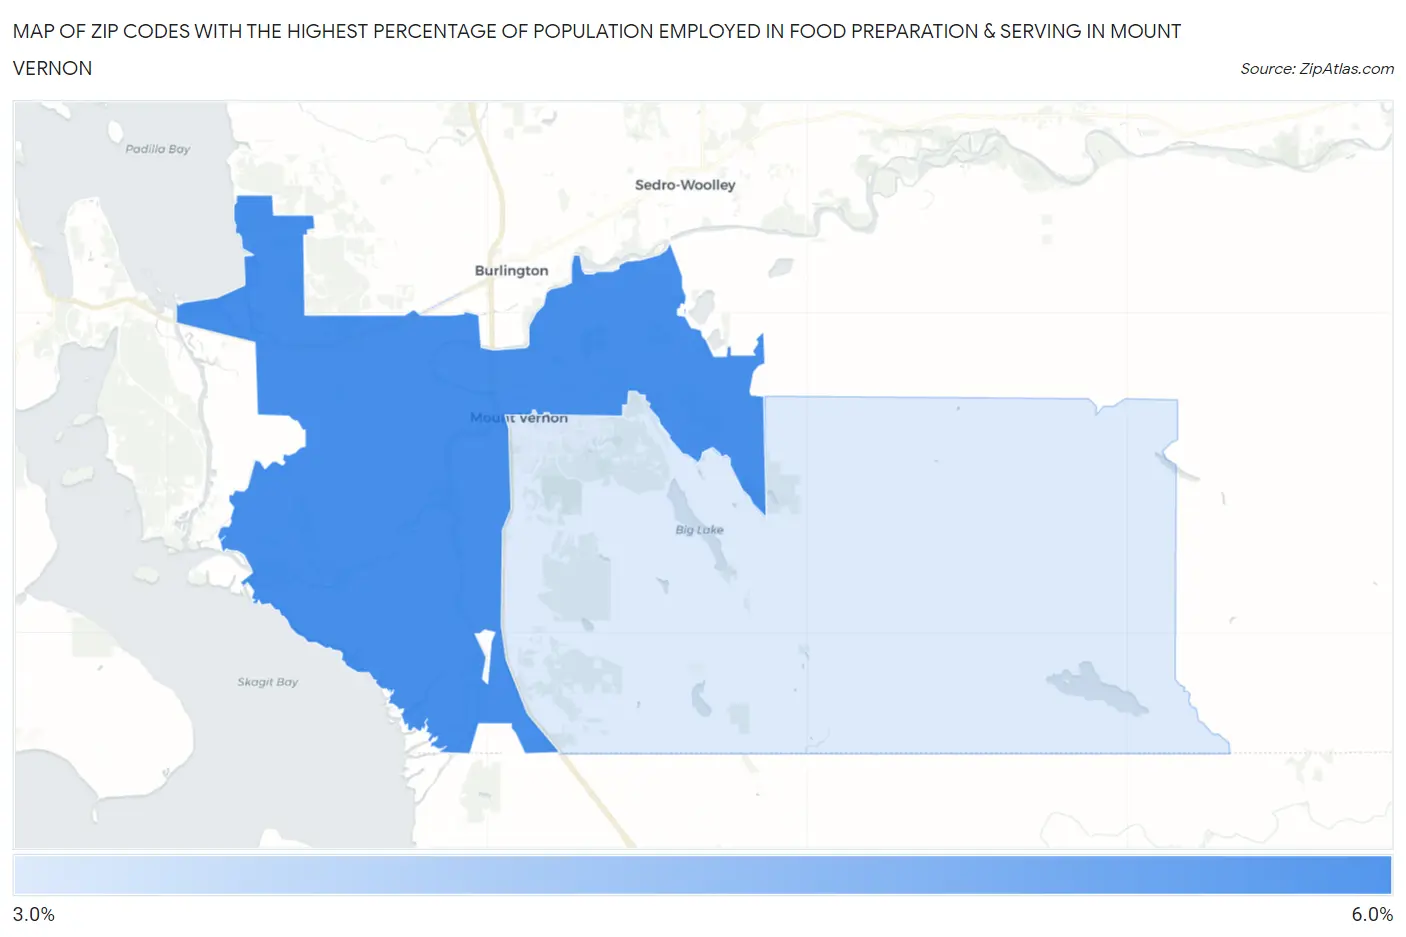
Map of Zip Codes with the Highest Percentage of Population Employed in Food Preparation & Serving in Mount Vernon
0.0%
6.0%
Zip Codes with the Highest Percentage of Population Employed in Food Preparation & Serving in Mount Vernon, WA
| Zip Code | % Employed | vs State | vs National | |
| 1. | 98273 | 5.4% | 5.1%(+0.252)#204 | 5.3%(+0.109)#11,423 |
| 2. | 98274 | 3.8% | 5.1%(-1.35)#333 | 5.3%(-1.49)#17,965 |
1
Common Questions
What are the Top Zip Codes with the Highest Percentage of Population Employed in Food Preparation & Serving in Mount Vernon, WA?
Top Zip Codes with the Highest Percentage of Population Employed in Food Preparation & Serving in Mount Vernon, WA are:
What zip code has the Highest Percentage of Population Employed in Food Preparation & Serving in Mount Vernon, WA?
98273 has the Highest Percentage of Population Employed in Food Preparation & Serving in Mount Vernon, WA with 5.4%.
What is the Percentage of Population Employed in Food Preparation & Serving in Mount Vernon, WA?
Percentage of Population Employed in Food Preparation & Serving in Mount Vernon is 5.1%.
What is the Percentage of Population Employed in Food Preparation & Serving in Washington?
Percentage of Population Employed in Food Preparation & Serving in Washington is 5.1%.
What is the Percentage of Population Employed in Food Preparation & Serving in the United States?
Percentage of Population Employed in Food Preparation & Serving in the United States is 5.3%.