Zip Codes with the Highest Percentage of Population Employed in Installation, Maintenance & Repair in Redmond, WA
RELATED REPORTS & OPTIONS
Installation, Maintenance & Repair
Redmond
Compare Zip Codes
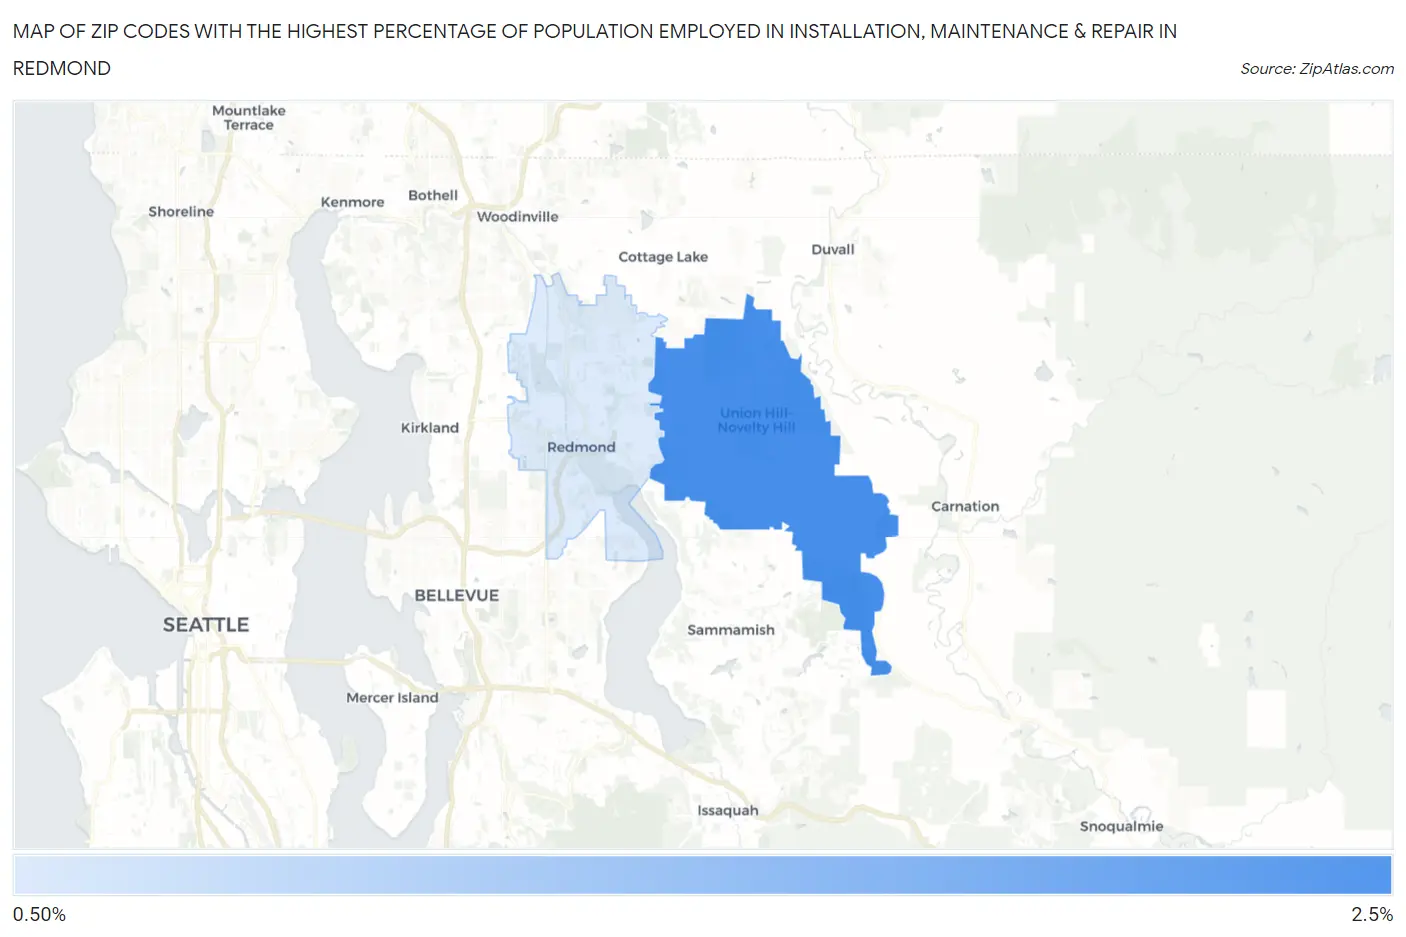
Map of Zip Codes with the Highest Percentage of Population Employed in Installation, Maintenance & Repair in Redmond
0.0%
2.5%
Zip Codes with the Highest Percentage of Population Employed in Installation, Maintenance & Repair in Redmond, WA
| Zip Code | % Employed | vs State | vs National | |
| 1. | 98053 | 2.0% | 2.9%(-0.922)#373 | 3.1%(-1.06)#21,983 |
| 2. | 98052 | 1.0% | 2.9%(-1.93)#453 | 3.1%(-2.07)#25,926 |
1
Common Questions
What are the Top Zip Codes with the Highest Percentage of Population Employed in Installation, Maintenance & Repair in Redmond, WA?
Top Zip Codes with the Highest Percentage of Population Employed in Installation, Maintenance & Repair in Redmond, WA are:
What zip code has the Highest Percentage of Population Employed in Installation, Maintenance & Repair in Redmond, WA?
98053 has the Highest Percentage of Population Employed in Installation, Maintenance & Repair in Redmond, WA with 2.0%.
What is the Percentage of Population Employed in Installation, Maintenance & Repair in Redmond, WA?
Percentage of Population Employed in Installation, Maintenance & Repair in Redmond is 1.0%.
What is the Percentage of Population Employed in Installation, Maintenance & Repair in Washington?
Percentage of Population Employed in Installation, Maintenance & Repair in Washington is 2.9%.
What is the Percentage of Population Employed in Installation, Maintenance & Repair in the United States?
Percentage of Population Employed in Installation, Maintenance & Repair in the United States is 3.1%.