Zip Codes with the Highest Percentage of Population Employed in Installation, Maintenance & Repair in Bellevue, WA
RELATED REPORTS & OPTIONS
Installation, Maintenance & Repair
Bellevue
Compare Zip Codes
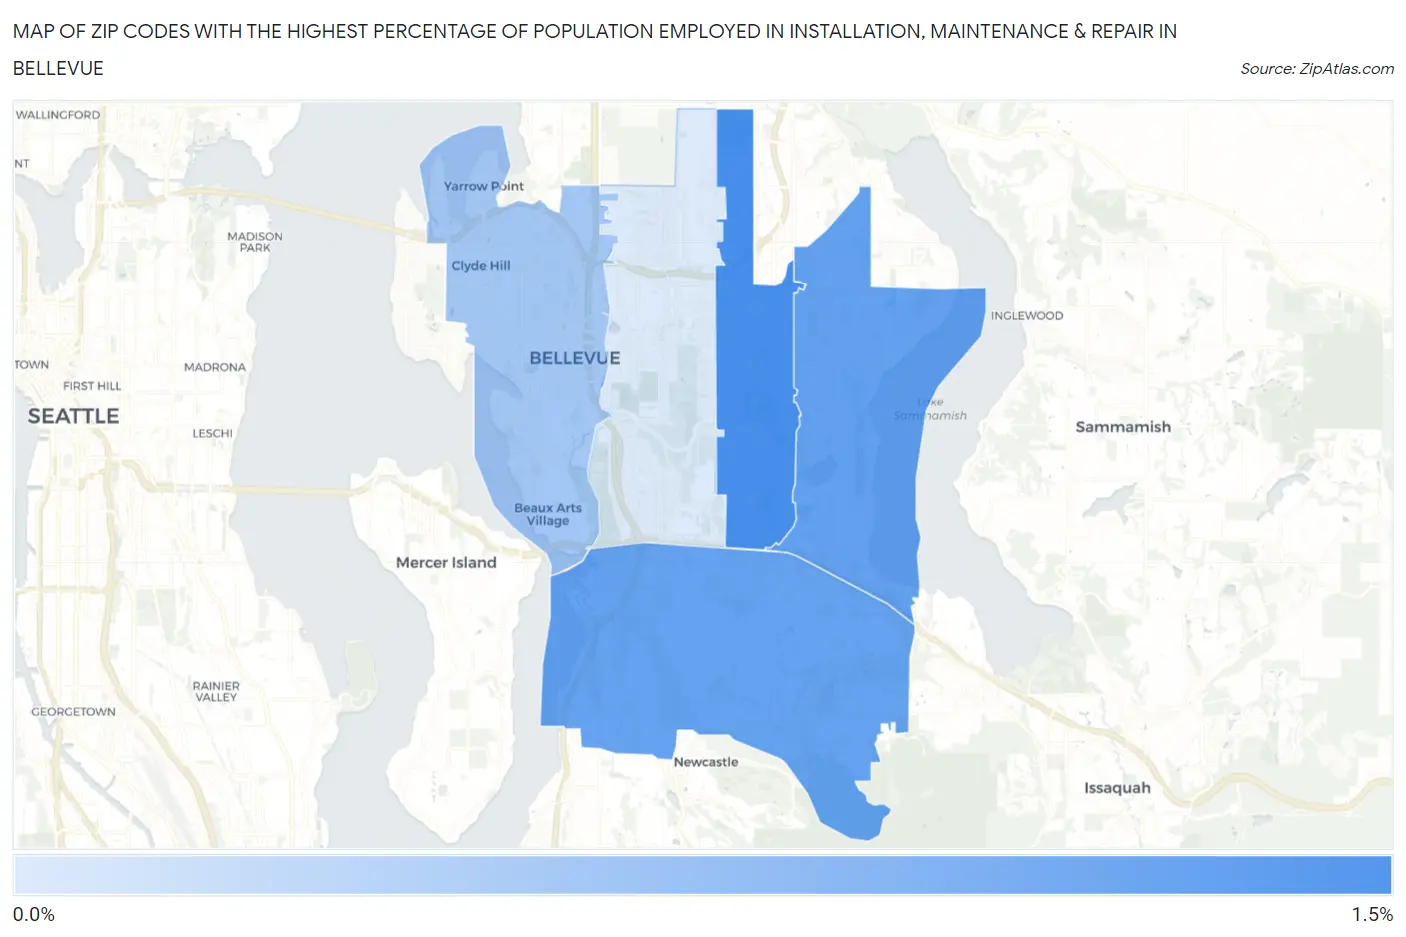
Map of Zip Codes with the Highest Percentage of Population Employed in Installation, Maintenance & Repair in Bellevue
0.0%
1.5%
Zip Codes with the Highest Percentage of Population Employed in Installation, Maintenance & Repair in Bellevue, WA
| Zip Code | % Employed | vs State | vs National | |
| 1. | 98007 | 1.1% | 2.9%(-1.78)#441 | 3.1%(-1.92)#25,449 |
| 2. | 98008 | 0.94% | 2.9%(-1.99)#458 | 3.1%(-2.13)#26,078 |
| 3. | 98006 | 0.93% | 2.9%(-1.99)#460 | 3.1%(-2.13)#26,099 |
| 4. | 98004 | 0.48% | 2.9%(-2.45)#481 | 3.1%(-2.59)#27,257 |
| 5. | 98005 | 0.078% | 2.9%(-2.85)#492 | 3.1%(-2.99)#27,785 |
1
Common Questions
What are the Top 3 Zip Codes with the Highest Percentage of Population Employed in Installation, Maintenance & Repair in Bellevue, WA?
Top 3 Zip Codes with the Highest Percentage of Population Employed in Installation, Maintenance & Repair in Bellevue, WA are:
What zip code has the Highest Percentage of Population Employed in Installation, Maintenance & Repair in Bellevue, WA?
98007 has the Highest Percentage of Population Employed in Installation, Maintenance & Repair in Bellevue, WA with 1.1%.
What is the Percentage of Population Employed in Installation, Maintenance & Repair in Bellevue, WA?
Percentage of Population Employed in Installation, Maintenance & Repair in Bellevue is 0.73%.
What is the Percentage of Population Employed in Installation, Maintenance & Repair in Washington?
Percentage of Population Employed in Installation, Maintenance & Repair in Washington is 2.9%.
What is the Percentage of Population Employed in Installation, Maintenance & Repair in the United States?
Percentage of Population Employed in Installation, Maintenance & Repair in the United States is 3.1%.