Pueblo vs Immigrants from Latin America 2 or more Vehicles in Household

COMPARE

Pueblo
Race
Ancestry
AfghanAfricanAlaska NativeAlaskan AthabascanAlbanianAleutAlsatianAmericanApacheArabArapahoArgentineanArmenianAssyrian/Chaldean/SyriacAustralianAustrianBahamianBangladeshiBarbadianBasqueBelgianBelizeanBermudanBhutaneseBlackfeetBolivianBrazilianBritishBritish West IndianBulgarianBurmeseCajunCambodianCanadianCape VerdeanCarpatho RusynCelticCentral AmericanCentral American IndianCherokeeCheyenneChickasawChileanChineseChippewaChoctawColombianColvilleComancheCosta RicanCreeCreekCroatianCrowCubanCypriotCzechCzechoslovakianDanishDelawareDominicanDutchDutch West IndianEastern EuropeanEcuadorianEgyptianEnglishEstonianEthiopianEuropeanFijianFilipinoFinnishFrenchFrench American IndianFrench CanadianGermanGerman RussianGhanaianGreekGuamanian/ChamorroGuatemalanGuyaneseHaitianHmongHonduranHopiHoumaHungarianIcelanderIndian (Asian)IndonesianInupiatIranianIraqiIrishIroquoisIsraeliItalianJamaicanJapaneseJordanianKenyanKiowaKoreanLaotianLatvianLebaneseLiberianLithuanianLumbeeLuxembourgerMacedonianMalaysianMalteseMarshalleseMenomineeMexicanMexican American IndianMongolianMoroccanNative HawaiianNavajoNepaleseNew ZealanderNicaraguanNigerianNorthern EuropeanNorwegianOkinawanOsageOttawaPaiutePakistaniPalestinianPanamanianParaguayanPennsylvania GermanPeruvianPimaPolishPortuguesePotawatomiPuebloPuerto RicanPuget Sound SalishRomanianRussianSalvadoranSamoanScandinavianScotch-IrishScottishSeminoleSenegaleseSerbianShoshoneSierra LeoneanSiouxSlavicSlovakSloveneSomaliSouth AfricanSouth AmericanSouth American IndianSoviet UnionSpaniardSpanishSpanish AmericanSpanish American IndianSri LankanSubsaharan AfricanSudaneseSwedishSwissSyrianTaiwaneseThaiTlingit-HaidaTohono O'OdhamTonganTrinidadian and TobagonianTsimshianTurkishU.S. Virgin IslanderUgandanUkrainianUruguayanUteVenezuelanVietnameseWelshWest IndianYakamaYaquiYugoslavianYumanYup'ikZimbabwean
Immigration
NonimmigrantsImmigrantsAfghanistanAfricaAlbaniaArgentinaArmeniaAsiaAustraliaAustriaBahamasBangladeshBarbadosBelarusBelgiumBelizeBoliviaBosnia and HerzegovinaBrazilBulgariaBurma/MyanmarCabo VerdeCambodiaCameroonCanadaCaribbeanCentral AmericaChileChinaColombiaCongoCosta RicaCroatiaCubaCzechoslovakiaDenmarkDominicaDominican RepublicEastern AfricaEastern AsiaEastern EuropeEcuadorEgyptEl SalvadorEnglandEritreaEthiopiaEuropeFijiFranceGermanyGhanaGreeceGrenadaGuatemalaGuyanaHaitiHondurasHong KongHungaryIndiaIndonesiaIranIraqIrelandIsraelItalyJamaicaJapanJordanKazakhstanKenyaKoreaKuwaitLaosLatviaLebanonLiberiaLithuaniaMalaysiaMexicoMicronesiaMiddle AfricaMoldovaMoroccoNepalNetherlandsNicaraguaNigeriaNorth AmericaNorth MacedoniaNorthern AfricaNorthern EuropeNorwayOceaniaPakistanPanamaPeruPhilippinesPolandPortugalRomaniaRussiaSaudi ArabiaScotlandSenegalSerbiaSierra LeoneSingaporeSomaliaSouth AfricaSouth AmericaSouth Central AsiaSouth Eastern AsiaSouthern EuropeSpainSri LankaSt. Vincent and the GrenadinesSudanSwedenSwitzerlandSyriaTaiwanThailandTrinidad and TobagoTurkeyUgandaUkraineUruguayUzbekistanVenezuelaVietnamWest IndiesWestern AfricaWestern AsiaWestern EuropeYemenZaireZimbabweAzores
Immigrants from Latin America
Race
Ancestry
AfghanAfricanAlaska NativeAlaskan AthabascanAlbanianAleutAlsatianAmericanApacheArabArapahoArgentineanArmenianAssyrian/Chaldean/SyriacAustralianAustrianBahamianBangladeshiBarbadianBasqueBelgianBelizeanBermudanBhutaneseBlackfeetBolivianBrazilianBritishBritish West IndianBulgarianBurmeseCajunCambodianCanadianCape VerdeanCarpatho RusynCelticCentral AmericanCentral American IndianCherokeeCheyenneChickasawChileanChineseChippewaChoctawColombianColvilleComancheCosta RicanCreeCreekCroatianCrowCubanCypriotCzechCzechoslovakianDanishDelawareDominicanDutchDutch West IndianEastern EuropeanEcuadorianEgyptianEnglishEstonianEthiopianEuropeanFijianFilipinoFinnishFrenchFrench American IndianFrench CanadianGermanGerman RussianGhanaianGreekGuamanian/ChamorroGuatemalanGuyaneseHaitianHmongHonduranHopiHoumaHungarianIcelanderIndian (Asian)IndonesianInupiatIranianIraqiIrishIroquoisIsraeliItalianJamaicanJapaneseJordanianKenyanKiowaKoreanLaotianLatvianLebaneseLiberianLithuanianLumbeeLuxembourgerMacedonianMalaysianMalteseMarshalleseMenomineeMexicanMexican American IndianMongolianMoroccanNative HawaiianNavajoNepaleseNew ZealanderNicaraguanNigerianNorthern EuropeanNorwegianOkinawanOsageOttawaPaiutePakistaniPalestinianPanamanianParaguayanPennsylvania GermanPeruvianPimaPolishPortuguesePotawatomiPuerto RicanPuget Sound SalishRomanianRussianSalvadoranSamoanScandinavianScotch-IrishScottishSeminoleSenegaleseSerbianShoshoneSierra LeoneanSiouxSlavicSlovakSloveneSomaliSouth AfricanSouth AmericanSouth American IndianSoviet UnionSpaniardSpanishSpanish AmericanSpanish American IndianSri LankanSubsaharan AfricanSudaneseSwedishSwissSyrianTaiwaneseThaiTlingit-HaidaTohono O'OdhamTonganTrinidadian and TobagonianTsimshianTurkishU.S. Virgin IslanderUgandanUkrainianUruguayanUteVenezuelanVietnameseWelshWest IndianYakamaYaquiYugoslavianYumanYup'ikZimbabwean
Immigration
NonimmigrantsImmigrantsAfghanistanAfricaAlbaniaArgentinaArmeniaAsiaAustraliaAustriaBahamasBangladeshBarbadosBelarusBelgiumBelizeBoliviaBosnia and HerzegovinaBrazilBulgariaBurma/MyanmarCabo VerdeCambodiaCameroonCanadaCaribbeanCentral AmericaChileChinaColombiaCongoCosta RicaCroatiaCubaCzechoslovakiaDenmarkDominicaDominican RepublicEastern AfricaEastern AsiaEastern EuropeEcuadorEgyptEl SalvadorEnglandEritreaEthiopiaEuropeFijiFranceGermanyGhanaGreeceGrenadaGuatemalaGuyanaHaitiHondurasHong KongHungaryIndiaIndonesiaIranIraqIrelandIsraelItalyJamaicaJapanJordanKazakhstanKenyaKoreaKuwaitLaosLatin AmericaLatviaLebanonLiberiaLithuaniaMalaysiaMexicoMicronesiaMiddle AfricaMoldovaMoroccoNepalNetherlandsNicaraguaNigeriaNorth AmericaNorth MacedoniaNorthern AfricaNorthern EuropeNorwayOceaniaPakistanPanamaPeruPhilippinesPolandPortugalRomaniaRussiaSaudi ArabiaScotlandSenegalSerbiaSierra LeoneSingaporeSomaliaSouth AfricaSouth AmericaSouth Central AsiaSouth Eastern AsiaSouthern EuropeSpainSri LankaSt. Vincent and the GrenadinesSudanSwedenSwitzerlandSyriaTaiwanThailandTrinidad and TobagoTurkeyUgandaUkraineUruguayUzbekistanVenezuelaVietnamWest IndiesWestern AfricaWestern AsiaWestern EuropeYemenZaireZimbabweAzores
2 or more Vehicles in Household
Income
Poverty
Unemployment
Labor Participation
Family Structure
Vehicle Availability
Education Level
Disability

2 or more Vehicles in Household Comparison

Pueblo

Immigrants from Latin America

Exceptional
Poor
57.5%
2 OR MORE VEHICLES IN HOUSEHOLD
98.0/ 100
METRIC RATING
112th/ 347
METRIC RANK
54.3%
2 OR MORE VEHICLES IN HOUSEHOLD
13.1/ 100
METRIC RATING
206th/ 347
METRIC RANK

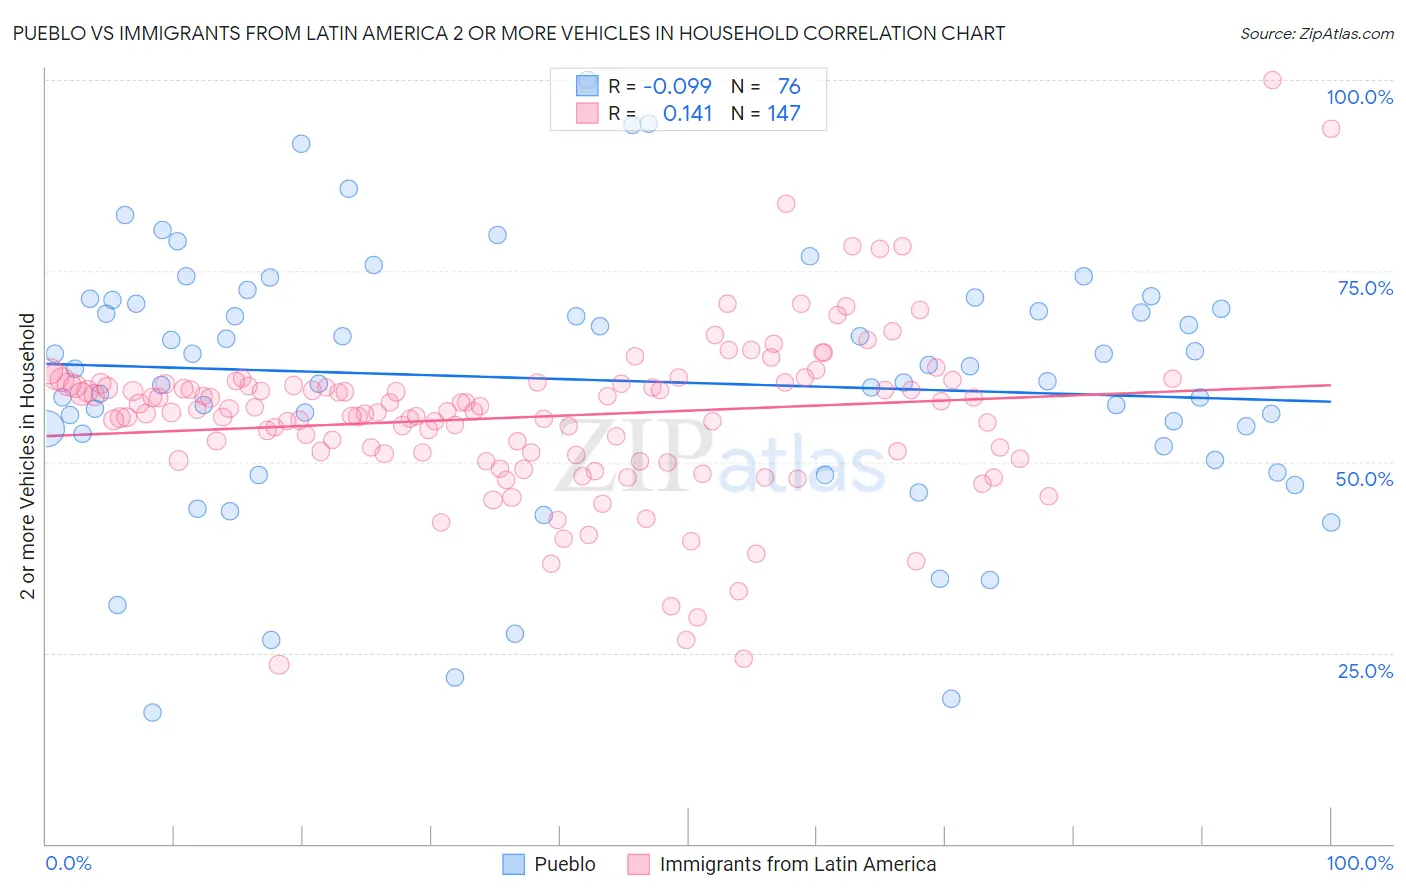
Pueblo vs Immigrants from Latin America 2 or more Vehicles in Household Correlation Chart

The statistical analysis conducted on geographies consisting of 120,072,908 people shows a slight negative correlation between the proportion of Pueblo and percentage of households with 2 or more vehicles available in the United States with a correlation coefficient (R) of -0.099 and weighted average of 57.5%. Similarly, the statistical analysis conducted on geographies consisting of 558,094,451 people shows a poor positive correlation between the proportion of Immigrants from Latin America and percentage of households with 2 or more vehicles available in the United States with a correlation coefficient (R) of 0.141 and weighted average of 54.3%, a difference of 5.8%.
Pueblo vs Immigrants from Latin America 2 or more Vehicles in Household

2 or more Vehicles in Household Correlation Summary

MeasurementPuebloImmigrants from Latin America
Minimum17.1%23.4%
Maximum100.0%100.0%
Range82.9%76.6%
Mean60.7%55.9%
Median62.3%56.7%
Interquartile 25% (IQ1)52.9%51.1%
Interquartile 75% (IQ3)70.9%60.2%
Interquartile Range (IQR)18.0%9.1%
Standard Deviation (Sample)17.0%10.8%
Standard Deviation (Population)16.9%10.7%

Similar Demographics by 2 or more Vehicles in Household

Demographics Similar to Pueblo by 2 or more Vehicles in Household

In terms of 2 or more vehicles in household, the demographic groups most similar to Pueblo are Greek (57.5%, a difference of 0.0%), Japanese (57.5%, a difference of 0.040%), Immigrants from North America (57.5%, a difference of 0.050%), Immigrants from Canada (57.5%, a difference of 0.090%), and Immigrants from Netherlands (57.5%, a difference of 0.10%).
DemographicsRating | Rank2 or more Vehicles in Household
Immigrants | Korea
98.2
/100
|
#105
Exceptional
57.6%
Immigrants | Oceania
98.2
/100
|
#106
Exceptional
57.5%
Immigrants | Netherlands
98.2
/100
|
#107
Exceptional
57.5%
Immigrants | Canada
98.1
/100
|
#108
Exceptional
57.5%
Immigrants | North America
98.1
/100
|
#109
Exceptional
57.5%
Japanese
98.0
/100
|
#110
Exceptional
57.5%
Greeks
98.0
/100
|
#111
Exceptional
57.5%
Pueblo
98.0
/100
|
#112
Exceptional
57.5%
Zimbabweans
96.9
/100
|
#113
Exceptional
57.2%
Immigrants | Lebanon
96.8
/100
|
#114
Exceptional
57.2%
Chippewa
96.6
/100
|
#115
Exceptional
57.2%
Immigrants | Jordan
96.6
/100
|
#116
Exceptional
57.2%
Iraqis
95.8
/100
|
#117
Exceptional
57.1%
Asians
95.1
/100
|
#118
Exceptional
57.0%
Natives/Alaskans
95.0
/100
|
#119
Exceptional
57.0%

Demographics Similar to Immigrants from Latin America by 2 or more Vehicles in Household

In terms of 2 or more vehicles in household, the demographic groups most similar to Immigrants from Latin America are Turkish (54.3%, a difference of 0.010%), Cheyenne (54.3%, a difference of 0.050%), Immigrants from Belgium (54.3%, a difference of 0.060%), Egyptian (54.3%, a difference of 0.10%), and Immigrants from Bulgaria (54.3%, a difference of 0.10%).
DemographicsRating | Rank2 or more Vehicles in Household
Immigrants | Norway
15.9
/100
|
#199
Poor
54.4%
Houma
15.8
/100
|
#200
Poor
54.4%
Immigrants | Italy
15.5
/100
|
#201
Poor
54.4%
Immigrants | North Macedonia
14.9
/100
|
#202
Poor
54.4%
Immigrants | Peru
14.3
/100
|
#203
Poor
54.4%
Immigrants | Belgium
13.7
/100
|
#204
Poor
54.3%
Cheyenne
13.6
/100
|
#205
Poor
54.3%
Immigrants | Latin America
13.1
/100
|
#206
Poor
54.3%
Turks
13.0
/100
|
#207
Poor
54.3%
Egyptians
12.0
/100
|
#208
Poor
54.3%
Immigrants | Bulgaria
12.0
/100
|
#209
Poor
54.3%
Immigrants | Saudi Arabia
11.3
/100
|
#210
Poor
54.2%
Immigrants | Hungary
11.3
/100
|
#211
Poor
54.2%
Immigrants | Chile
11.1
/100
|
#212
Poor
54.2%
Guatemalans
9.6
/100
|
#213
Tragic
54.1%