Pakistani vs Immigrants from Hungary 3 or more Vehicles in Household

COMPARE

Pakistani
Race
Ancestry
AfghanAfricanAlaska NativeAlaskan AthabascanAlbanianAleutAlsatianAmericanApacheArabArapahoArgentineanArmenianAssyrian/Chaldean/SyriacAustralianAustrianBahamianBangladeshiBarbadianBasqueBelgianBelizeanBermudanBhutaneseBlackfeetBolivianBrazilianBritishBritish West IndianBulgarianBurmeseCajunCambodianCanadianCape VerdeanCarpatho RusynCelticCentral AmericanCentral American IndianCherokeeCheyenneChickasawChileanChineseChippewaChoctawColombianColvilleComancheCosta RicanCreeCreekCroatianCrowCubanCypriotCzechCzechoslovakianDanishDelawareDominicanDutchDutch West IndianEastern EuropeanEcuadorianEgyptianEnglishEstonianEthiopianEuropeanFijianFilipinoFinnishFrenchFrench American IndianFrench CanadianGermanGerman RussianGhanaianGreekGuamanian/ChamorroGuatemalanGuyaneseHaitianHmongHonduranHopiHoumaHungarianIcelanderIndian (Asian)IndonesianInupiatIranianIraqiIrishIroquoisIsraeliItalianJamaicanJapaneseJordanianKenyanKiowaKoreanLaotianLatvianLebaneseLiberianLithuanianLumbeeLuxembourgerMacedonianMalaysianMalteseMarshalleseMenomineeMexicanMexican American IndianMongolianMoroccanNative HawaiianNavajoNepaleseNew ZealanderNicaraguanNigerianNorthern EuropeanNorwegianOkinawanOsageOttawaPaiutePakistaniPalestinianPanamanianParaguayanPennsylvania GermanPeruvianPimaPolishPortuguesePotawatomiPuebloPuerto RicanPuget Sound SalishRomanianRussianSalvadoranSamoanScandinavianScotch-IrishScottishSeminoleSenegaleseSerbianShoshoneSierra LeoneanSiouxSlavicSlovakSloveneSomaliSouth AfricanSouth AmericanSouth American IndianSoviet UnionSpaniardSpanishSpanish AmericanSpanish American IndianSri LankanSubsaharan AfricanSudaneseSwedishSwissSyrianTaiwaneseThaiTlingit-HaidaTohono O'OdhamTonganTrinidadian and TobagonianTsimshianTurkishU.S. Virgin IslanderUgandanUkrainianUruguayanUteVenezuelanVietnameseWelshWest IndianYakamaYaquiYugoslavianYumanYup'ikZimbabwean
Immigration
NonimmigrantsImmigrantsAfghanistanAfricaAlbaniaArgentinaArmeniaAsiaAustraliaAustriaBahamasBangladeshBarbadosBelarusBelgiumBelizeBoliviaBosnia and HerzegovinaBrazilBulgariaBurma/MyanmarCabo VerdeCambodiaCameroonCanadaCaribbeanCentral AmericaChileChinaColombiaCongoCosta RicaCroatiaCubaCzechoslovakiaDenmarkDominicaDominican RepublicEastern AfricaEastern AsiaEastern EuropeEcuadorEgyptEl SalvadorEnglandEritreaEthiopiaEuropeFijiFranceGermanyGhanaGreeceGrenadaGuatemalaGuyanaHaitiHondurasHong KongIndiaIndonesiaIranIraqIrelandIsraelItalyJamaicaJapanJordanKazakhstanKenyaKoreaKuwaitLaosLatin AmericaLatviaLebanonLiberiaLithuaniaMalaysiaMexicoMicronesiaMiddle AfricaMoldovaMoroccoNepalNetherlandsNicaraguaNigeriaNorth AmericaNorth MacedoniaNorthern AfricaNorthern EuropeNorwayOceaniaPakistanPanamaPeruPhilippinesPolandPortugalRomaniaRussiaSaudi ArabiaScotlandSenegalSerbiaSierra LeoneSingaporeSomaliaSouth AfricaSouth AmericaSouth Central AsiaSouth Eastern AsiaSouthern EuropeSpainSri LankaSt. Vincent and the GrenadinesSudanSwedenSwitzerlandSyriaTaiwanThailandTrinidad and TobagoTurkeyUgandaUkraineUruguayUzbekistanVenezuelaVietnamWest IndiesWestern AfricaWestern AsiaWestern EuropeYemenZaireZimbabweAzores
Immigrants from Hungary
Race
Ancestry
AfghanAfricanAlaska NativeAlaskan AthabascanAlbanianAleutAlsatianAmericanApacheArabArapahoArgentineanArmenianAssyrian/Chaldean/SyriacAustralianAustrianBahamianBangladeshiBarbadianBasqueBelgianBelizeanBermudanBhutaneseBlackfeetBolivianBrazilianBritishBritish West IndianBulgarianBurmeseCajunCambodianCanadianCape VerdeanCarpatho RusynCelticCentral AmericanCentral American IndianCherokeeCheyenneChickasawChileanChineseChippewaChoctawColombianColvilleComancheCosta RicanCreeCreekCroatianCrowCubanCypriotCzechCzechoslovakianDanishDelawareDominicanDutchDutch West IndianEastern EuropeanEcuadorianEgyptianEnglishEstonianEthiopianEuropeanFijianFilipinoFinnishFrenchFrench American IndianFrench CanadianGermanGerman RussianGhanaianGreekGuamanian/ChamorroGuatemalanGuyaneseHaitianHmongHonduranHopiHoumaHungarianIcelanderIndian (Asian)IndonesianInupiatIranianIraqiIrishIroquoisIsraeliItalianJamaicanJapaneseJordanianKenyanKiowaKoreanLaotianLatvianLebaneseLiberianLithuanianLumbeeLuxembourgerMacedonianMalaysianMalteseMarshalleseMenomineeMexicanMexican American IndianMongolianMoroccanNative HawaiianNavajoNepaleseNew ZealanderNicaraguanNigerianNorthern EuropeanNorwegianOkinawanOsageOttawaPaiutePalestinianPanamanianParaguayanPennsylvania GermanPeruvianPimaPolishPortuguesePotawatomiPuebloPuerto RicanPuget Sound SalishRomanianRussianSalvadoranSamoanScandinavianScotch-IrishScottishSeminoleSenegaleseSerbianShoshoneSierra LeoneanSiouxSlavicSlovakSloveneSomaliSouth AfricanSouth AmericanSouth American IndianSoviet UnionSpaniardSpanishSpanish AmericanSpanish American IndianSri LankanSubsaharan AfricanSudaneseSwedishSwissSyrianTaiwaneseThaiTlingit-HaidaTohono O'OdhamTonganTrinidadian and TobagonianTsimshianTurkishU.S. Virgin IslanderUgandanUkrainianUruguayanUteVenezuelanVietnameseWelshWest IndianYakamaYaquiYugoslavianYumanYup'ikZimbabwean
Immigration
NonimmigrantsImmigrantsAfghanistanAfricaAlbaniaArgentinaArmeniaAsiaAustraliaAustriaBahamasBangladeshBarbadosBelarusBelgiumBelizeBoliviaBosnia and HerzegovinaBrazilBulgariaBurma/MyanmarCabo VerdeCambodiaCameroonCanadaCaribbeanCentral AmericaChileChinaColombiaCongoCosta RicaCroatiaCubaCzechoslovakiaDenmarkDominicaDominican RepublicEastern AfricaEastern AsiaEastern EuropeEcuadorEgyptEl SalvadorEnglandEritreaEthiopiaEuropeFijiFranceGermanyGhanaGreeceGrenadaGuatemalaGuyanaHaitiHondurasHong KongHungaryIndiaIndonesiaIranIraqIrelandIsraelItalyJamaicaJapanJordanKazakhstanKenyaKoreaKuwaitLaosLatin AmericaLatviaLebanonLiberiaLithuaniaMalaysiaMexicoMicronesiaMiddle AfricaMoldovaMoroccoNepalNetherlandsNicaraguaNigeriaNorth AmericaNorth MacedoniaNorthern AfricaNorthern EuropeNorwayOceaniaPakistanPanamaPeruPhilippinesPolandPortugalRomaniaRussiaSaudi ArabiaScotlandSenegalSerbiaSierra LeoneSingaporeSomaliaSouth AfricaSouth AmericaSouth Central AsiaSouth Eastern AsiaSouthern EuropeSpainSri LankaSt. Vincent and the GrenadinesSudanSwedenSwitzerlandSyriaTaiwanThailandTrinidad and TobagoTurkeyUgandaUkraineUruguayUzbekistanVenezuelaVietnamWest IndiesWestern AfricaWestern AsiaWestern EuropeYemenZaireZimbabweAzores
3 or more Vehicles in Household
Income
Poverty
Unemployment
Labor Participation
Family Structure
Vehicle Availability
Education Level
Disability

3 or more Vehicles in Household Comparison

Pakistanis

Immigrants from Hungary

Exceptional
Tragic
21.0%
3 OR MORE VEHICLES IN HOUSEHOLD
98.5/ 100
METRIC RATING
95th/ 347
METRIC RANK
18.5%
3 OR MORE VEHICLES IN HOUSEHOLD
5.5/ 100
METRIC RATING
226th/ 347
METRIC RANK

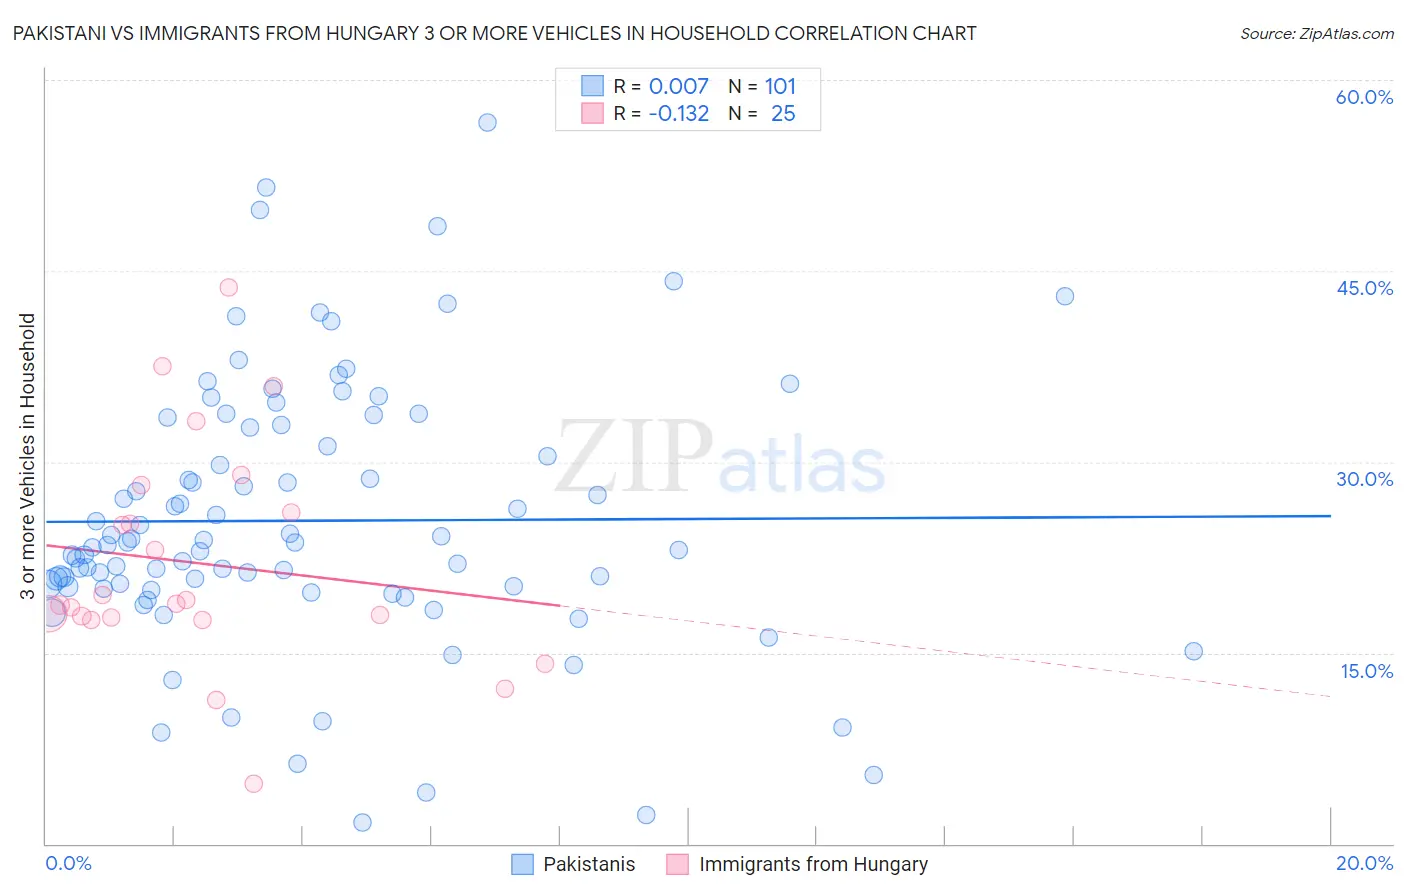
Pakistani vs Immigrants from Hungary 3 or more Vehicles in Household Correlation Chart

The statistical analysis conducted on geographies consisting of 335,121,243 people shows no correlation between the proportion of Pakistanis and percentage of households with 3 or more vehicles available in the United States with a correlation coefficient (R) of 0.007 and weighted average of 21.0%. Similarly, the statistical analysis conducted on geographies consisting of 195,641,507 people shows a poor negative correlation between the proportion of Immigrants from Hungary and percentage of households with 3 or more vehicles available in the United States with a correlation coefficient (R) of -0.132 and weighted average of 18.5%, a difference of 14.0%.
Pakistani vs Immigrants from Hungary 3 or more Vehicles in Household

3 or more Vehicles in Household Correlation Summary

MeasurementPakistaniImmigrants from Hungary
Minimum1.7%4.8%
Maximum56.7%43.7%
Range55.0%39.0%
Mean25.4%22.0%
Median23.5%18.9%
Interquartile 25% (IQ1)20.1%17.7%
Interquartile 75% (IQ3)32.8%27.1%
Interquartile Range (IQR)12.7%9.4%
Standard Deviation (Sample)10.5%8.8%
Standard Deviation (Population)10.4%8.7%

Similar Demographics by 3 or more Vehicles in Household

Demographics Similar to Pakistanis by 3 or more Vehicles in Household

In terms of 3 or more vehicles in household, the demographic groups most similar to Pakistanis are Cree (21.0%, a difference of 0.090%), Immigrants from Cambodia (21.1%, a difference of 0.14%), Canadian (21.0%, a difference of 0.20%), Hmong (21.0%, a difference of 0.26%), and Alaska Native (21.0%, a difference of 0.26%).
DemographicsRating | Rank3 or more Vehicles in Household
French
99.4
/100
|
#88
Exceptional
21.4%
Marshallese
99.2
/100
|
#89
Exceptional
21.3%
Immigrants | Afghanistan
99.1
/100
|
#90
Exceptional
21.2%
Belgians
98.9
/100
|
#91
Exceptional
21.2%
Apache
98.9
/100
|
#92
Exceptional
21.2%
Immigrants | Indonesia
98.8
/100
|
#93
Exceptional
21.1%
Immigrants | Cambodia
98.6
/100
|
#94
Exceptional
21.1%
Pakistanis
98.5
/100
|
#95
Exceptional
21.0%
Cree
98.4
/100
|
#96
Exceptional
21.0%
Canadians
98.3
/100
|
#97
Exceptional
21.0%
Hmong
98.2
/100
|
#98
Exceptional
21.0%
Alaska Natives
98.2
/100
|
#99
Exceptional
21.0%
Comanche
98.2
/100
|
#100
Exceptional
21.0%
Blackfeet
97.9
/100
|
#101
Exceptional
20.9%
Seminole
97.8
/100
|
#102
Exceptional
20.9%

Demographics Similar to Immigrants from Hungary by 3 or more Vehicles in Household

In terms of 3 or more vehicles in household, the demographic groups most similar to Immigrants from Hungary are Immigrants from Lithuania (18.5%, a difference of 0.030%), Immigrants from Singapore (18.4%, a difference of 0.030%), Immigrants from Argentina (18.5%, a difference of 0.040%), Turkish (18.4%, a difference of 0.050%), and Immigrants from Czechoslovakia (18.5%, a difference of 0.15%).
DemographicsRating | Rank3 or more Vehicles in Household
Immigrants | Armenia
8.6
/100
|
#219
Tragic
18.6%
Nigerians
7.9
/100
|
#220
Tragic
18.6%
Immigrants | Poland
7.5
/100
|
#221
Tragic
18.6%
Belizeans
7.3
/100
|
#222
Tragic
18.6%
Immigrants | Czechoslovakia
5.9
/100
|
#223
Tragic
18.5%
Immigrants | Argentina
5.6
/100
|
#224
Tragic
18.5%
Immigrants | Lithuania
5.6
/100
|
#225
Tragic
18.5%
Immigrants | Hungary
5.5
/100
|
#226
Tragic
18.5%
Immigrants | Singapore
5.4
/100
|
#227
Tragic
18.4%
Turks
5.4
/100
|
#228
Tragic
18.4%
Immigrants | Switzerland
5.0
/100
|
#229
Tragic
18.4%
Immigrants | Western Asia
4.8
/100
|
#230
Tragic
18.4%
Immigrants | Belgium
4.8
/100
|
#231
Tragic
18.4%
Immigrants | Uganda
4.6
/100
|
#232
Tragic
18.4%
Hondurans
4.6
/100
|
#233
Tragic
18.4%