Immigrants from Zaire vs Afghan 4 or more Vehicles in Household
COMPARE
Immigrants from Zaire
Afghan
4 or more Vehicles in Household
4 or more Vehicles in Household Comparison
Immigrants from Zaire
Afghans
5.1%
4 OR MORE VEHICLES IN HOUSEHOLD
0.0/ 100
METRIC RATING
301st/ 347
METRIC RANK
7.3%
4 OR MORE VEHICLES IN HOUSEHOLD
99.7/ 100
METRIC RATING
84th/ 347
METRIC RANK
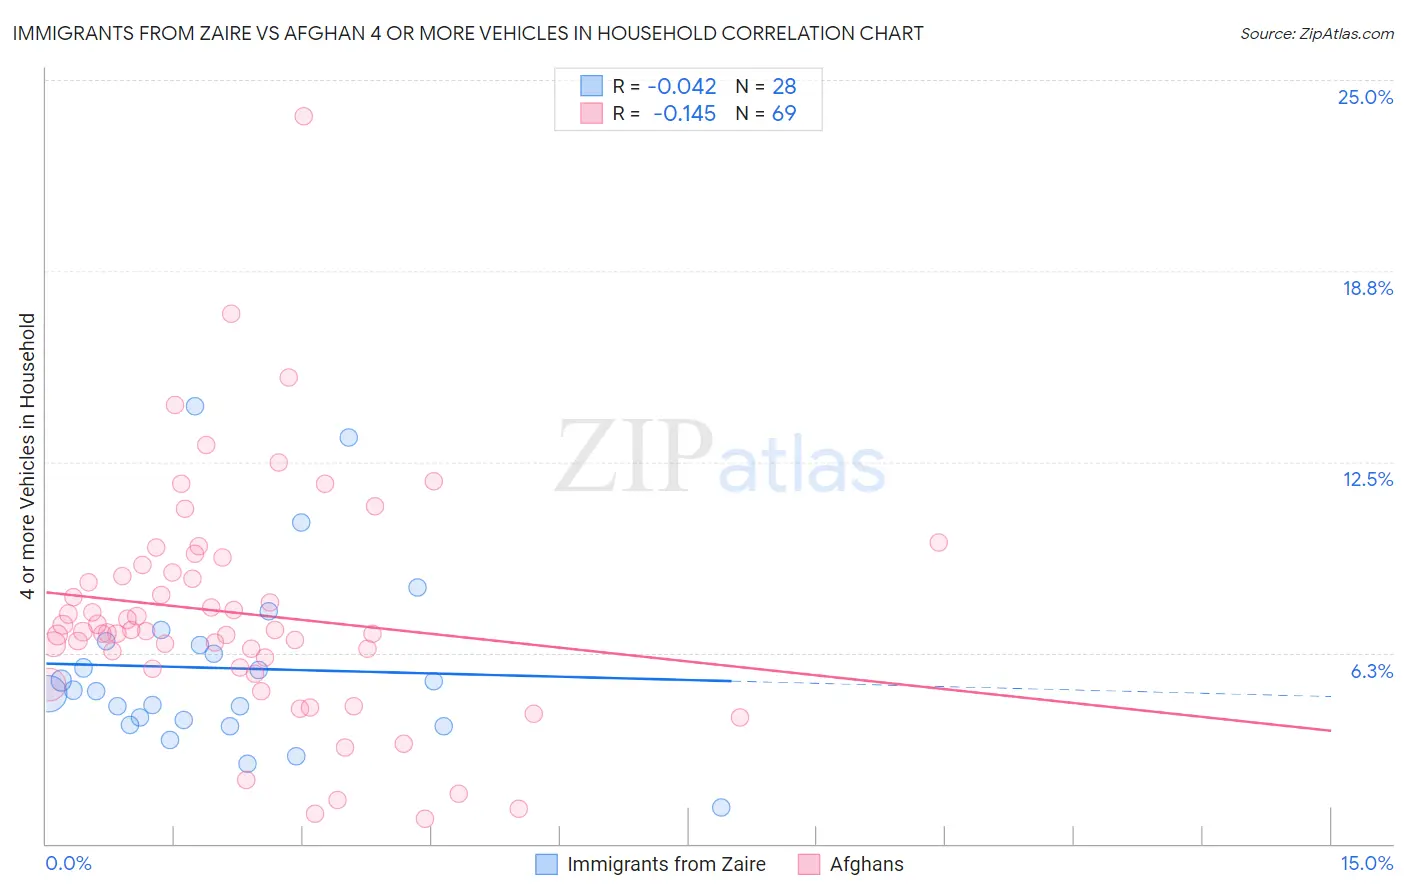
Immigrants from Zaire vs Afghan 4 or more Vehicles in Household Correlation Chart
The statistical analysis conducted on geographies consisting of 106,897,629 people shows no correlation between the proportion of Immigrants from Zaire and percentage of households with 4 or more vehicles available in the United States with a correlation coefficient (R) of -0.042 and weighted average of 5.1%. Similarly, the statistical analysis conducted on geographies consisting of 148,454,289 people shows a poor negative correlation between the proportion of Afghans and percentage of households with 4 or more vehicles available in the United States with a correlation coefficient (R) of -0.145 and weighted average of 7.3%, a difference of 42.4%.
4 or more Vehicles in Household Correlation Summary
| Measurement | Immigrants from Zaire | Afghan |
| Minimum | 1.2% | 0.82% |
| Maximum | 14.3% | 23.8% |
| Range | 13.2% | 23.0% |
| Mean | 5.7% | 7.5% |
| Median | 5.0% | 7.0% |
| Interquartile 25% (IQ1) | 4.0% | 5.8% |
| Interquartile 75% (IQ3) | 6.6% | 9.0% |
| Interquartile Range (IQR) | 2.6% | 3.2% |
| Standard Deviation (Sample) | 2.9% | 3.8% |
| Standard Deviation (Population) | 2.9% | 3.8% |
Similar Demographics by 4 or more Vehicles in Household
Demographics Similar to Immigrants from Zaire by 4 or more Vehicles in Household
In terms of 4 or more vehicles in household, the demographic groups most similar to Immigrants from Zaire are Immigrants from Morocco (5.1%, a difference of 0.080%), Bahamian (5.1%, a difference of 0.31%), Immigrants from Greece (5.1%, a difference of 0.77%), Cypriot (5.0%, a difference of 1.3%), and Somali (5.0%, a difference of 1.3%).
| Demographics | Rating | Rank | 4 or more Vehicles in Household |
| Ghanaians | 0.1 /100 | #294 | Tragic 5.2% |
| Immigrants | Brazil | 0.1 /100 | #295 | Tragic 5.2% |
| Israelis | 0.1 /100 | #296 | Tragic 5.2% |
| Immigrants | Venezuela | 0.1 /100 | #297 | Tragic 5.2% |
| Immigrants | South America | 0.1 /100 | #298 | Tragic 5.2% |
| Immigrants | Ghana | 0.1 /100 | #299 | Tragic 5.2% |
| Immigrants | Morocco | 0.0 /100 | #300 | Tragic 5.1% |
| Immigrants | Zaire | 0.0 /100 | #301 | Tragic 5.1% |
| Bahamians | 0.0 /100 | #302 | Tragic 5.1% |
| Immigrants | Greece | 0.0 /100 | #303 | Tragic 5.1% |
| Cypriots | 0.0 /100 | #304 | Tragic 5.0% |
| Somalis | 0.0 /100 | #305 | Tragic 5.0% |
| Immigrants | Serbia | 0.0 /100 | #306 | Tragic 5.0% |
| Menominee | 0.0 /100 | #307 | Tragic 5.0% |
| Paraguayans | 0.0 /100 | #308 | Tragic 4.9% |
Demographics Similar to Afghans by 4 or more Vehicles in Household
In terms of 4 or more vehicles in household, the demographic groups most similar to Afghans are Cree (7.2%, a difference of 0.17%), Potawatomi (7.3%, a difference of 0.33%), Immigrants from Indonesia (7.2%, a difference of 0.35%), Delaware (7.2%, a difference of 0.41%), and Nonimmigrants (7.2%, a difference of 0.43%).
| Demographics | Rating | Rank | 4 or more Vehicles in Household |
| Apache | 99.9 /100 | #77 | Exceptional 7.4% |
| Whites/Caucasians | 99.8 /100 | #78 | Exceptional 7.4% |
| Czechs | 99.8 /100 | #79 | Exceptional 7.4% |
| Alaska Natives | 99.8 /100 | #80 | Exceptional 7.3% |
| Finns | 99.8 /100 | #81 | Exceptional 7.3% |
| Northern Europeans | 99.8 /100 | #82 | Exceptional 7.3% |
| Potawatomi | 99.7 /100 | #83 | Exceptional 7.3% |
| Afghans | 99.7 /100 | #84 | Exceptional 7.3% |
| Cree | 99.7 /100 | #85 | Exceptional 7.2% |
| Immigrants | Indonesia | 99.6 /100 | #86 | Exceptional 7.2% |
| Delaware | 99.6 /100 | #87 | Exceptional 7.2% |
| Immigrants | Nonimmigrants | 99.6 /100 | #88 | Exceptional 7.2% |
| British | 99.6 /100 | #89 | Exceptional 7.2% |
| Creek | 99.6 /100 | #90 | Exceptional 7.2% |
| Assyrians/Chaldeans/Syriacs | 99.4 /100 | #91 | Exceptional 7.2% |