Immigrants from Lebanon vs Immigrants from Egypt 1 or more Vehicles in Household

COMPARE

Immigrants from Lebanon
Race
Ancestry
AfghanAfricanAlaska NativeAlaskan AthabascanAlbanianAleutAlsatianAmericanApacheArabArapahoArgentineanArmenianAssyrian/Chaldean/SyriacAustralianAustrianBahamianBangladeshiBarbadianBasqueBelgianBelizeanBermudanBhutaneseBlackfeetBolivianBrazilianBritishBritish West IndianBulgarianBurmeseCajunCambodianCanadianCape VerdeanCarpatho RusynCelticCentral AmericanCentral American IndianCherokeeCheyenneChickasawChileanChineseChippewaChoctawColombianColvilleComancheCosta RicanCreeCreekCroatianCrowCubanCypriotCzechCzechoslovakianDanishDelawareDominicanDutchDutch West IndianEastern EuropeanEcuadorianEgyptianEnglishEstonianEthiopianEuropeanFijianFilipinoFinnishFrenchFrench American IndianFrench CanadianGermanGerman RussianGhanaianGreekGuamanian/ChamorroGuatemalanGuyaneseHaitianHmongHonduranHopiHoumaHungarianIcelanderIndian (Asian)IndonesianInupiatIranianIraqiIrishIroquoisIsraeliItalianJamaicanJapaneseJordanianKenyanKiowaKoreanLaotianLatvianLebaneseLiberianLithuanianLumbeeLuxembourgerMacedonianMalaysianMalteseMarshalleseMenomineeMexicanMexican American IndianMongolianMoroccanNative HawaiianNavajoNepaleseNew ZealanderNicaraguanNigerianNorthern EuropeanNorwegianOkinawanOsageOttawaPaiutePakistaniPalestinianPanamanianParaguayanPennsylvania GermanPeruvianPimaPolishPortuguesePotawatomiPuebloPuerto RicanPuget Sound SalishRomanianRussianSalvadoranSamoanScandinavianScotch-IrishScottishSeminoleSenegaleseSerbianShoshoneSierra LeoneanSiouxSlavicSlovakSloveneSomaliSouth AfricanSouth AmericanSouth American IndianSoviet UnionSpaniardSpanishSpanish AmericanSpanish American IndianSri LankanSubsaharan AfricanSudaneseSwedishSwissSyrianTaiwaneseThaiTlingit-HaidaTohono O'OdhamTonganTrinidadian and TobagonianTsimshianTurkishU.S. Virgin IslanderUgandanUkrainianUruguayanUteVenezuelanVietnameseWelshWest IndianYakamaYaquiYugoslavianYumanYup'ikZimbabwean
Immigration
NonimmigrantsImmigrantsAfghanistanAfricaAlbaniaArgentinaArmeniaAsiaAustraliaAustriaBahamasBangladeshBarbadosBelarusBelgiumBelizeBoliviaBosnia and HerzegovinaBrazilBulgariaBurma/MyanmarCabo VerdeCambodiaCameroonCanadaCaribbeanCentral AmericaChileChinaColombiaCongoCosta RicaCroatiaCubaCzechoslovakiaDenmarkDominicaDominican RepublicEastern AfricaEastern AsiaEastern EuropeEcuadorEl SalvadorEnglandEritreaEthiopiaEuropeFijiFranceGermanyGhanaGreeceGrenadaGuatemalaGuyanaHaitiHondurasHong KongHungaryIndiaIndonesiaIranIraqIrelandIsraelItalyJamaicaJapanJordanKazakhstanKenyaKoreaKuwaitLaosLatin AmericaLatviaLebanonLiberiaLithuaniaMalaysiaMexicoMicronesiaMiddle AfricaMoldovaMoroccoNepalNetherlandsNicaraguaNigeriaNorth AmericaNorth MacedoniaNorthern AfricaNorthern EuropeNorwayOceaniaPakistanPanamaPeruPhilippinesPolandPortugalRomaniaRussiaSaudi ArabiaScotlandSenegalSerbiaSierra LeoneSingaporeSomaliaSouth AfricaSouth AmericaSouth Central AsiaSouth Eastern AsiaSouthern EuropeSpainSri LankaSt. Vincent and the GrenadinesSudanSwedenSwitzerlandSyriaTaiwanThailandTrinidad and TobagoTurkeyUgandaUkraineUruguayUzbekistanVenezuelaVietnamWest IndiesWestern AfricaWestern AsiaWestern EuropeYemenZaireZimbabweAzores
Immigrants from Egypt
Race
Ancestry
AfghanAfricanAlaska NativeAlaskan AthabascanAlbanianAleutAlsatianAmericanApacheArabArapahoArgentineanArmenianAssyrian/Chaldean/SyriacAustralianAustrianBahamianBangladeshiBarbadianBasqueBelgianBelizeanBermudanBhutaneseBlackfeetBolivianBrazilianBritishBritish West IndianBulgarianBurmeseCajunCambodianCanadianCape VerdeanCarpatho RusynCelticCentral AmericanCentral American IndianCherokeeCheyenneChickasawChileanChineseChippewaChoctawColombianColvilleComancheCosta RicanCreeCreekCroatianCrowCubanCypriotCzechCzechoslovakianDanishDelawareDominicanDutchDutch West IndianEastern EuropeanEcuadorianEgyptianEnglishEstonianEthiopianEuropeanFijianFilipinoFinnishFrenchFrench American IndianFrench CanadianGermanGerman RussianGhanaianGreekGuamanian/ChamorroGuatemalanGuyaneseHaitianHmongHonduranHopiHoumaHungarianIcelanderIndian (Asian)IndonesianInupiatIranianIraqiIrishIroquoisIsraeliItalianJamaicanJapaneseJordanianKenyanKiowaKoreanLaotianLatvianLebaneseLiberianLithuanianLumbeeLuxembourgerMacedonianMalaysianMalteseMarshalleseMenomineeMexicanMexican American IndianMongolianMoroccanNative HawaiianNavajoNepaleseNew ZealanderNicaraguanNigerianNorthern EuropeanNorwegianOkinawanOsageOttawaPaiutePakistaniPalestinianPanamanianParaguayanPennsylvania GermanPeruvianPimaPolishPortuguesePotawatomiPuebloPuerto RicanPuget Sound SalishRomanianRussianSalvadoranSamoanScandinavianScotch-IrishScottishSeminoleSenegaleseSerbianShoshoneSierra LeoneanSiouxSlavicSlovakSloveneSomaliSouth AfricanSouth AmericanSouth American IndianSoviet UnionSpaniardSpanishSpanish AmericanSpanish American IndianSri LankanSubsaharan AfricanSudaneseSwedishSwissSyrianTaiwaneseThaiTlingit-HaidaTohono O'OdhamTonganTrinidadian and TobagonianTsimshianTurkishU.S. Virgin IslanderUgandanUkrainianUruguayanUteVenezuelanVietnameseWelshWest IndianYakamaYaquiYugoslavianYumanYup'ikZimbabwean
Immigration
NonimmigrantsImmigrantsAfghanistanAfricaAlbaniaArgentinaArmeniaAsiaAustraliaAustriaBahamasBangladeshBarbadosBelarusBelgiumBelizeBoliviaBosnia and HerzegovinaBrazilBulgariaBurma/MyanmarCabo VerdeCambodiaCameroonCanadaCaribbeanCentral AmericaChileChinaColombiaCongoCosta RicaCroatiaCubaCzechoslovakiaDenmarkDominicaDominican RepublicEastern AfricaEastern AsiaEastern EuropeEcuadorEgyptEl SalvadorEnglandEritreaEthiopiaEuropeFijiFranceGermanyGhanaGreeceGrenadaGuatemalaGuyanaHaitiHondurasHong KongHungaryIndiaIndonesiaIranIraqIrelandIsraelItalyJamaicaJapanJordanKazakhstanKenyaKoreaKuwaitLaosLatin AmericaLatviaLiberiaLithuaniaMalaysiaMexicoMicronesiaMiddle AfricaMoldovaMoroccoNepalNetherlandsNicaraguaNigeriaNorth AmericaNorth MacedoniaNorthern AfricaNorthern EuropeNorwayOceaniaPakistanPanamaPeruPhilippinesPolandPortugalRomaniaRussiaSaudi ArabiaScotlandSenegalSerbiaSierra LeoneSingaporeSomaliaSouth AfricaSouth AmericaSouth Central AsiaSouth Eastern AsiaSouthern EuropeSpainSri LankaSt. Vincent and the GrenadinesSudanSwedenSwitzerlandSyriaTaiwanThailandTrinidad and TobagoTurkeyUgandaUkraineUruguayUzbekistanVenezuelaVietnamWest IndiesWestern AfricaWestern AsiaWestern EuropeYemenZaireZimbabweAzores
1 or more Vehicles in Household
Income
Poverty
Unemployment
Labor Participation
Family Structure
Vehicle Availability
Education Level
Disability

1 or more Vehicles in Household Comparison

Immigrants from Lebanon

Immigrants from Egypt

Exceptional
Tragic
91.6%
1 OR MORE VEHICLES IN HOUSEHOLD
99.6/ 100
METRIC RATING
74th/ 347
METRIC RANK
87.8%
1 OR MORE VEHICLES IN HOUSEHOLD
0.5/ 100
METRIC RATING
263rd/ 347
METRIC RANK

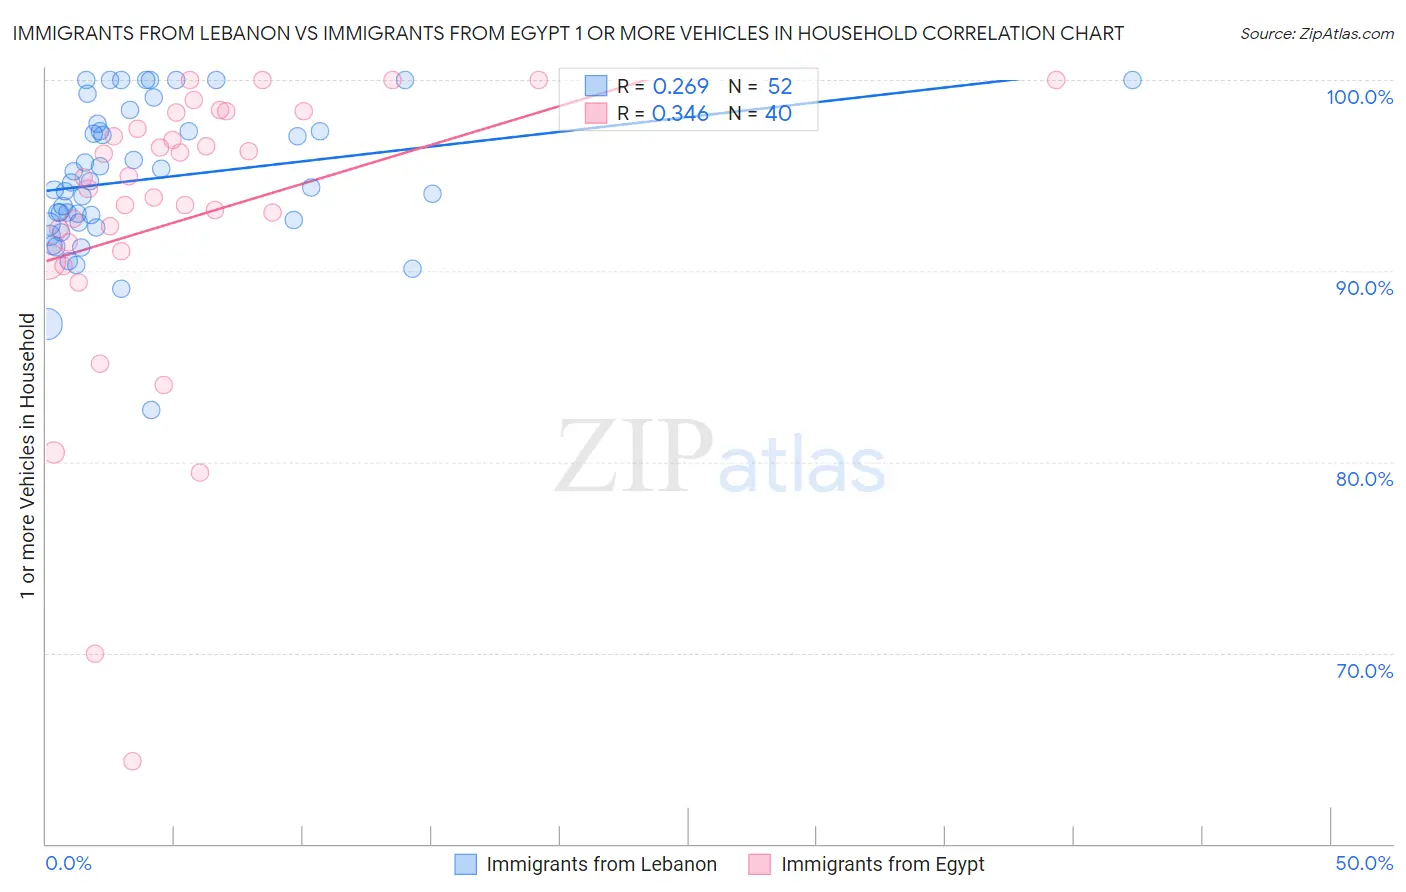
Immigrants from Lebanon vs Immigrants from Egypt 1 or more Vehicles in Household Correlation Chart

The statistical analysis conducted on geographies consisting of 216,991,778 people shows a weak positive correlation between the proportion of Immigrants from Lebanon and percentage of households with 1 or more vehicles available in the United States with a correlation coefficient (R) of 0.269 and weighted average of 91.6%. Similarly, the statistical analysis conducted on geographies consisting of 245,380,882 people shows a mild positive correlation between the proportion of Immigrants from Egypt and percentage of households with 1 or more vehicles available in the United States with a correlation coefficient (R) of 0.346 and weighted average of 87.8%, a difference of 4.4%.
Immigrants from Lebanon vs Immigrants from Egypt 1 or more Vehicles in Household

1 or more Vehicles in Household Correlation Summary

MeasurementImmigrants from LebanonImmigrants from Egypt
Minimum82.7%64.3%
Maximum100.0%100.0%
Range17.3%35.7%
Mean94.8%92.7%
Median94.5%94.6%
Interquartile 25% (IQ1)92.5%91.3%
Interquartile 75% (IQ3)97.5%97.9%
Interquartile Range (IQR)5.0%6.6%
Standard Deviation (Sample)3.8%7.8%
Standard Deviation (Population)3.8%7.7%

Similar Demographics by 1 or more Vehicles in Household

Demographics Similar to Immigrants from Lebanon by 1 or more Vehicles in Household

In terms of 1 or more vehicles in household, the demographic groups most similar to Immigrants from Lebanon are Immigrants from Iran (91.7%, a difference of 0.030%), Polish (91.7%, a difference of 0.050%), Cajun (91.7%, a difference of 0.050%), Lithuanian (91.7%, a difference of 0.070%), and Palestinian (91.7%, a difference of 0.080%).
DemographicsRating | Rank1 or more Vehicles in Household
Spaniards
99.8
/100
|
#67
Exceptional
91.8%
Immigrants | Scotland
99.7
/100
|
#68
Exceptional
91.8%
Palestinians
99.7
/100
|
#69
Exceptional
91.7%
Lithuanians
99.7
/100
|
#70
Exceptional
91.7%
Poles
99.7
/100
|
#71
Exceptional
91.7%
Cajuns
99.7
/100
|
#72
Exceptional
91.7%
Immigrants | Iran
99.7
/100
|
#73
Exceptional
91.7%
Immigrants | Lebanon
99.6
/100
|
#74
Exceptional
91.6%
Portuguese
99.5
/100
|
#75
Exceptional
91.6%
Cubans
99.5
/100
|
#76
Exceptional
91.5%
Immigrants | Philippines
99.4
/100
|
#77
Exceptional
91.5%
Iranians
99.4
/100
|
#78
Exceptional
91.5%
Immigrants | South Central Asia
99.4
/100
|
#79
Exceptional
91.5%
Bolivians
99.4
/100
|
#80
Exceptional
91.5%
Immigrants | South Eastern Asia
99.3
/100
|
#81
Exceptional
91.4%

Demographics Similar to Immigrants from Egypt by 1 or more Vehicles in Household

In terms of 1 or more vehicles in household, the demographic groups most similar to Immigrants from Egypt are Immigrants from Liberia (87.8%, a difference of 0.010%), African (87.8%, a difference of 0.040%), Subsaharan African (87.9%, a difference of 0.070%), Immigrants from Switzerland (87.9%, a difference of 0.10%), and Macedonian (87.9%, a difference of 0.14%).
DemographicsRating | Rank1 or more Vehicles in Household
Colombians
0.9
/100
|
#256
Tragic
88.0%
Liberians
0.9
/100
|
#257
Tragic
88.0%
South American Indians
0.9
/100
|
#258
Tragic
88.0%
Nigerians
0.8
/100
|
#259
Tragic
88.0%
Macedonians
0.6
/100
|
#260
Tragic
87.9%
Immigrants | Switzerland
0.6
/100
|
#261
Tragic
87.9%
Sub-Saharan Africans
0.5
/100
|
#262
Tragic
87.9%
Immigrants | Egypt
0.5
/100
|
#263
Tragic
87.8%
Immigrants | Liberia
0.4
/100
|
#264
Tragic
87.8%
Africans
0.4
/100
|
#265
Tragic
87.8%
Israelis
0.3
/100
|
#266
Tragic
87.7%
Immigrants | Colombia
0.3
/100
|
#267
Tragic
87.6%
Immigrants | Europe
0.2
/100
|
#268
Tragic
87.6%
Immigrants | Africa
0.2
/100
|
#269
Tragic
87.6%
Panamanians
0.2
/100
|
#270
Tragic
87.5%