Immigrants from Ghana vs Immigrants from Sudan 3 or more Vehicles in Household

COMPARE

Immigrants from Ghana
Race
Ancestry
AfghanAfricanAlaska NativeAlaskan AthabascanAlbanianAleutAlsatianAmericanApacheArabArapahoArgentineanArmenianAssyrian/Chaldean/SyriacAustralianAustrianBahamianBangladeshiBarbadianBasqueBelgianBelizeanBermudanBhutaneseBlackfeetBolivianBrazilianBritishBritish West IndianBulgarianBurmeseCajunCambodianCanadianCape VerdeanCarpatho RusynCelticCentral AmericanCentral American IndianCherokeeCheyenneChickasawChileanChineseChippewaChoctawColombianColvilleComancheCosta RicanCreeCreekCroatianCrowCubanCypriotCzechCzechoslovakianDanishDelawareDominicanDutchDutch West IndianEastern EuropeanEcuadorianEgyptianEnglishEstonianEthiopianEuropeanFijianFilipinoFinnishFrenchFrench American IndianFrench CanadianGermanGerman RussianGhanaianGreekGuamanian/ChamorroGuatemalanGuyaneseHaitianHmongHonduranHopiHoumaHungarianIcelanderIndian (Asian)IndonesianInupiatIranianIraqiIrishIroquoisIsraeliItalianJamaicanJapaneseJordanianKenyanKiowaKoreanLaotianLatvianLebaneseLiberianLithuanianLumbeeLuxembourgerMacedonianMalaysianMalteseMarshalleseMenomineeMexicanMexican American IndianMongolianMoroccanNative HawaiianNavajoNepaleseNew ZealanderNicaraguanNigerianNorthern EuropeanNorwegianOkinawanOsageOttawaPaiutePakistaniPalestinianPanamanianParaguayanPennsylvania GermanPeruvianPimaPolishPortuguesePotawatomiPuebloPuerto RicanPuget Sound SalishRomanianRussianSalvadoranSamoanScandinavianScotch-IrishScottishSeminoleSenegaleseSerbianShoshoneSierra LeoneanSiouxSlavicSlovakSloveneSomaliSouth AfricanSouth AmericanSouth American IndianSoviet UnionSpaniardSpanishSpanish AmericanSpanish American IndianSri LankanSubsaharan AfricanSudaneseSwedishSwissSyrianTaiwaneseThaiTlingit-HaidaTohono O'OdhamTonganTrinidadian and TobagonianTsimshianTurkishU.S. Virgin IslanderUgandanUkrainianUruguayanUteVenezuelanVietnameseWelshWest IndianYakamaYaquiYugoslavianYumanYup'ikZimbabwean
Immigration
NonimmigrantsImmigrantsAfghanistanAfricaAlbaniaArgentinaArmeniaAsiaAustraliaAustriaBahamasBangladeshBarbadosBelarusBelgiumBelizeBoliviaBosnia and HerzegovinaBrazilBulgariaBurma/MyanmarCabo VerdeCambodiaCameroonCanadaCaribbeanCentral AmericaChileChinaColombiaCongoCosta RicaCroatiaCubaCzechoslovakiaDenmarkDominicaDominican RepublicEastern AfricaEastern AsiaEastern EuropeEcuadorEgyptEl SalvadorEnglandEritreaEthiopiaEuropeFijiFranceGermanyGhanaGreeceGrenadaGuatemalaGuyanaHaitiHondurasHong KongHungaryIndiaIndonesiaIranIraqIrelandIsraelItalyJamaicaJapanJordanKazakhstanKenyaKoreaKuwaitLaosLatin AmericaLatviaLebanonLiberiaLithuaniaMalaysiaMexicoMicronesiaMiddle AfricaMoldovaMoroccoNepalNetherlandsNicaraguaNigeriaNorth AmericaNorth MacedoniaNorthern AfricaNorthern EuropeNorwayOceaniaPakistanPanamaPeruPhilippinesPolandPortugalRomaniaRussiaSaudi ArabiaScotlandSenegalSerbiaSierra LeoneSingaporeSomaliaSouth AfricaSouth AmericaSouth Central AsiaSouth Eastern AsiaSouthern EuropeSpainSri LankaSt. Vincent and the GrenadinesSwedenSwitzerlandSyriaTaiwanThailandTrinidad and TobagoTurkeyUgandaUkraineUruguayUzbekistanVenezuelaVietnamWest IndiesWestern AfricaWestern AsiaWestern EuropeYemenZaireZimbabweAzores
Immigrants from Sudan
Race
Ancestry
AfghanAfricanAlaska NativeAlaskan AthabascanAlbanianAleutAlsatianAmericanApacheArabArapahoArgentineanArmenianAssyrian/Chaldean/SyriacAustralianAustrianBahamianBangladeshiBarbadianBasqueBelgianBelizeanBermudanBhutaneseBlackfeetBolivianBrazilianBritishBritish West IndianBulgarianBurmeseCajunCambodianCanadianCape VerdeanCarpatho RusynCelticCentral AmericanCentral American IndianCherokeeCheyenneChickasawChileanChineseChippewaChoctawColombianColvilleComancheCosta RicanCreeCreekCroatianCrowCubanCypriotCzechCzechoslovakianDanishDelawareDominicanDutchDutch West IndianEastern EuropeanEcuadorianEgyptianEnglishEstonianEthiopianEuropeanFijianFilipinoFinnishFrenchFrench American IndianFrench CanadianGermanGerman RussianGhanaianGreekGuamanian/ChamorroGuatemalanGuyaneseHaitianHmongHonduranHopiHoumaHungarianIcelanderIndian (Asian)IndonesianInupiatIranianIraqiIrishIroquoisIsraeliItalianJamaicanJapaneseJordanianKenyanKiowaKoreanLaotianLatvianLebaneseLiberianLithuanianLumbeeLuxembourgerMacedonianMalaysianMalteseMarshalleseMenomineeMexicanMexican American IndianMongolianMoroccanNative HawaiianNavajoNepaleseNew ZealanderNicaraguanNigerianNorthern EuropeanNorwegianOkinawanOsageOttawaPaiutePakistaniPalestinianPanamanianParaguayanPennsylvania GermanPeruvianPimaPolishPortuguesePotawatomiPuebloPuerto RicanPuget Sound SalishRomanianRussianSalvadoranSamoanScandinavianScotch-IrishScottishSeminoleSenegaleseSerbianShoshoneSierra LeoneanSiouxSlavicSlovakSloveneSomaliSouth AfricanSouth AmericanSouth American IndianSoviet UnionSpaniardSpanishSpanish AmericanSpanish American IndianSri LankanSubsaharan AfricanSudaneseSwedishSwissSyrianTaiwaneseThaiTlingit-HaidaTohono O'OdhamTonganTrinidadian and TobagonianTsimshianTurkishU.S. Virgin IslanderUgandanUkrainianUruguayanUteVenezuelanVietnameseWelshWest IndianYakamaYaquiYugoslavianYumanYup'ikZimbabwean
Immigration
NonimmigrantsImmigrantsAfghanistanAfricaAlbaniaArgentinaArmeniaAsiaAustraliaAustriaBahamasBangladeshBarbadosBelarusBelgiumBelizeBoliviaBosnia and HerzegovinaBrazilBulgariaBurma/MyanmarCabo VerdeCambodiaCameroonCanadaCaribbeanCentral AmericaChileChinaColombiaCongoCosta RicaCroatiaCubaCzechoslovakiaDenmarkDominicaDominican RepublicEastern AfricaEastern AsiaEastern EuropeEcuadorEgyptEl SalvadorEnglandEritreaEthiopiaEuropeFijiFranceGermanyGreeceGrenadaGuatemalaGuyanaHaitiHondurasHong KongHungaryIndiaIndonesiaIranIraqIrelandIsraelItalyJamaicaJapanJordanKazakhstanKenyaKoreaKuwaitLaosLatin AmericaLatviaLebanonLiberiaLithuaniaMalaysiaMexicoMicronesiaMiddle AfricaMoldovaMoroccoNepalNetherlandsNicaraguaNigeriaNorth AmericaNorth MacedoniaNorthern AfricaNorthern EuropeNorwayOceaniaPakistanPanamaPeruPhilippinesPolandPortugalRomaniaRussiaSaudi ArabiaScotlandSenegalSerbiaSierra LeoneSingaporeSomaliaSouth AfricaSouth AmericaSouth Central AsiaSouth Eastern AsiaSouthern EuropeSpainSri LankaSt. Vincent and the GrenadinesSudanSwedenSwitzerlandSyriaTaiwanThailandTrinidad and TobagoTurkeyUgandaUkraineUruguayUzbekistanVenezuelaVietnamWest IndiesWestern AfricaWestern AsiaWestern EuropeYemenZaireZimbabweAzores
3 or more Vehicles in Household
Income
Poverty
Unemployment
Labor Participation
Family Structure
Vehicle Availability
Education Level
Disability

3 or more Vehicles in Household Comparison

Immigrants from Ghana

Immigrants from Sudan

Tragic
Tragic
16.2%
3 OR MORE VEHICLES IN HOUSEHOLD
0.0/ 100
METRIC RATING
307th/ 347
METRIC RANK
17.6%
3 OR MORE VEHICLES IN HOUSEHOLD
0.5/ 100
METRIC RATING
273rd/ 347
METRIC RANK

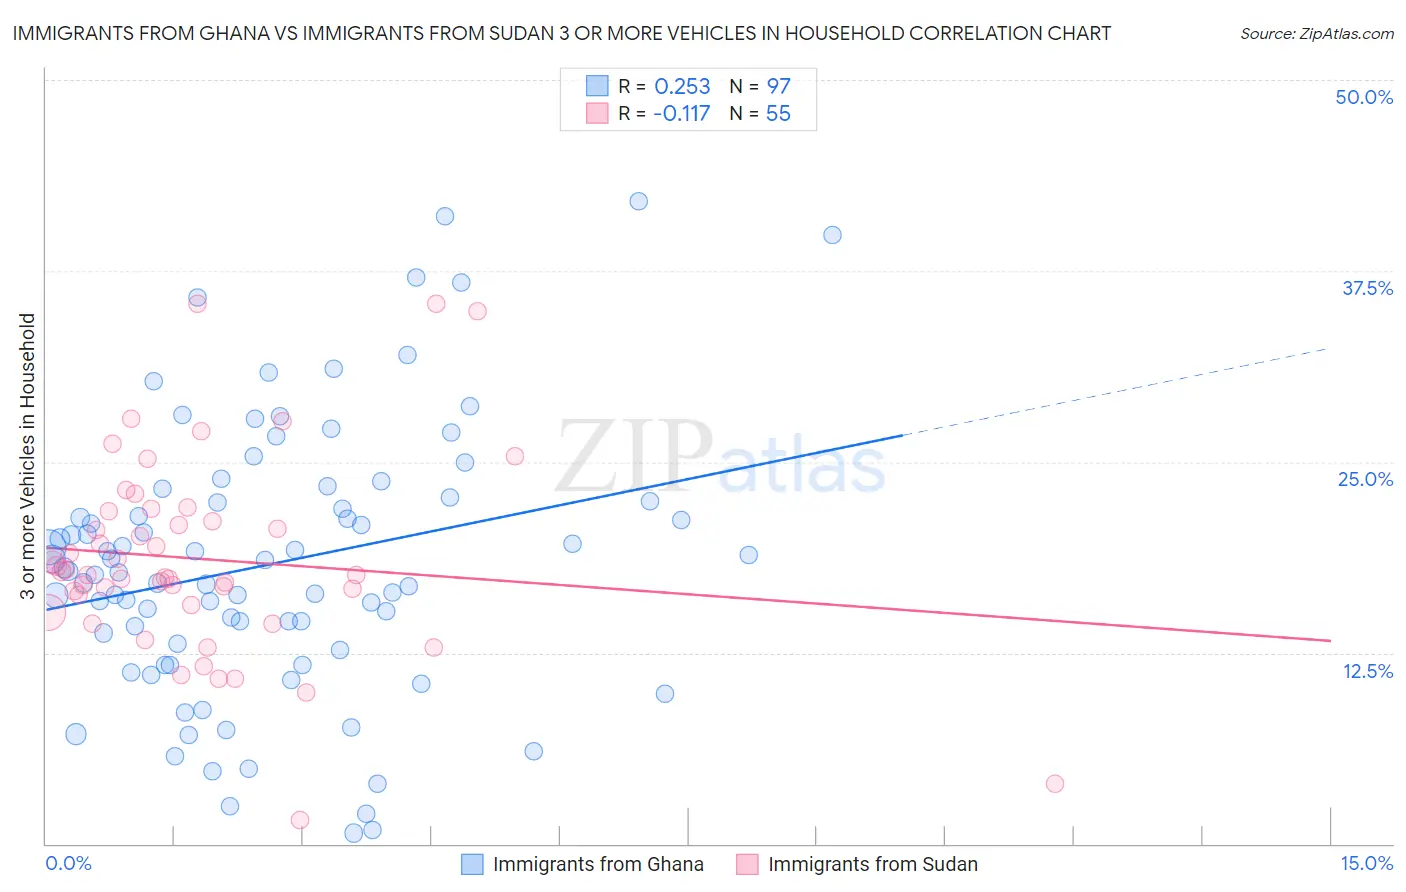
Immigrants from Ghana vs Immigrants from Sudan 3 or more Vehicles in Household Correlation Chart

The statistical analysis conducted on geographies consisting of 199,771,460 people shows a weak positive correlation between the proportion of Immigrants from Ghana and percentage of households with 3 or more vehicles available in the United States with a correlation coefficient (R) of 0.253 and weighted average of 16.2%. Similarly, the statistical analysis conducted on geographies consisting of 118,948,382 people shows a poor negative correlation between the proportion of Immigrants from Sudan and percentage of households with 3 or more vehicles available in the United States with a correlation coefficient (R) of -0.117 and weighted average of 17.6%, a difference of 8.6%.
Immigrants from Ghana vs Immigrants from Sudan 3 or more Vehicles in Household

3 or more Vehicles in Household Correlation Summary

MeasurementImmigrants from GhanaImmigrants from Sudan
Minimum0.70%1.5%
Maximum42.0%35.4%
Range41.3%33.8%
Mean18.3%18.6%
Median17.8%17.6%
Interquartile 25% (IQ1)12.9%15.6%
Interquartile 75% (IQ3)22.6%21.8%
Interquartile Range (IQR)9.7%6.2%
Standard Deviation (Sample)8.8%6.5%
Standard Deviation (Population)8.8%6.5%

Similar Demographics by 3 or more Vehicles in Household

Demographics Similar to Immigrants from Ghana by 3 or more Vehicles in Household

In terms of 3 or more vehicles in household, the demographic groups most similar to Immigrants from Ghana are Somali (16.2%, a difference of 0.15%), Houma (16.1%, a difference of 0.59%), Immigrants from Morocco (16.3%, a difference of 0.96%), Ghanaian (16.4%, a difference of 1.2%), and Immigrants from Somalia (15.9%, a difference of 1.5%).
DemographicsRating | Rank3 or more Vehicles in Household
Cypriots
0.0
/100
|
#300
Tragic
16.6%
Paraguayans
0.0
/100
|
#301
Tragic
16.6%
Immigrants | Greece
0.0
/100
|
#302
Tragic
16.5%
Immigrants | Serbia
0.0
/100
|
#303
Tragic
16.4%
Ghanaians
0.0
/100
|
#304
Tragic
16.4%
Immigrants | Morocco
0.0
/100
|
#305
Tragic
16.3%
Somalis
0.0
/100
|
#306
Tragic
16.2%
Immigrants | Ghana
0.0
/100
|
#307
Tragic
16.2%
Houma
0.0
/100
|
#308
Tragic
16.1%
Immigrants | Somalia
0.0
/100
|
#309
Tragic
15.9%
Moroccans
0.0
/100
|
#310
Tragic
15.9%
Albanians
0.0
/100
|
#311
Tragic
15.8%
Puerto Ricans
0.0
/100
|
#312
Tragic
15.6%
Immigrants | Israel
0.0
/100
|
#313
Tragic
15.6%
Immigrants | Belarus
0.0
/100
|
#314
Tragic
15.5%

Demographics Similar to Immigrants from Sudan by 3 or more Vehicles in Household

In terms of 3 or more vehicles in household, the demographic groups most similar to Immigrants from Sudan are Immigrants from Africa (17.6%, a difference of 0.040%), Immigrants from Bosnia and Herzegovina (17.5%, a difference of 0.15%), Immigrants from Ukraine (17.5%, a difference of 0.44%), Immigrants from Nepal (17.6%, a difference of 0.45%), and South American (17.6%, a difference of 0.45%).
DemographicsRating | Rank3 or more Vehicles in Household
Macedonians
0.8
/100
|
#266
Tragic
17.7%
Immigrants | Venezuela
0.8
/100
|
#267
Tragic
17.7%
Immigrants | Bulgaria
0.8
/100
|
#268
Tragic
17.7%
Immigrants | France
0.6
/100
|
#269
Tragic
17.6%
Immigrants | Nepal
0.6
/100
|
#270
Tragic
17.6%
South Americans
0.6
/100
|
#271
Tragic
17.6%
Immigrants | Africa
0.5
/100
|
#272
Tragic
17.6%
Immigrants | Sudan
0.5
/100
|
#273
Tragic
17.6%
Immigrants | Bosnia and Herzegovina
0.5
/100
|
#274
Tragic
17.5%
Immigrants | Ukraine
0.4
/100
|
#275
Tragic
17.5%
Okinawans
0.4
/100
|
#276
Tragic
17.4%
Brazilians
0.4
/100
|
#277
Tragic
17.4%
Immigrants | Bahamas
0.3
/100
|
#278
Tragic
17.4%
Immigrants | Kazakhstan
0.3
/100
|
#279
Tragic
17.4%
Immigrants | Eastern Europe
0.3
/100
|
#280
Tragic
17.4%