Immigrants from Ecuador vs Immigrants from Northern Africa 2 or more Vehicles in Household

COMPARE

Immigrants from Ecuador
Race
Ancestry
AfghanAfricanAlaska NativeAlaskan AthabascanAlbanianAleutAlsatianAmericanApacheArabArapahoArgentineanArmenianAssyrian/Chaldean/SyriacAustralianAustrianBahamianBangladeshiBarbadianBasqueBelgianBelizeanBermudanBhutaneseBlackfeetBolivianBrazilianBritishBritish West IndianBulgarianBurmeseCajunCambodianCanadianCape VerdeanCarpatho RusynCelticCentral AmericanCentral American IndianCherokeeCheyenneChickasawChileanChineseChippewaChoctawColombianColvilleComancheCosta RicanCreeCreekCroatianCrowCubanCypriotCzechCzechoslovakianDanishDelawareDominicanDutchDutch West IndianEastern EuropeanEcuadorianEgyptianEnglishEstonianEthiopianEuropeanFijianFilipinoFinnishFrenchFrench American IndianFrench CanadianGermanGerman RussianGhanaianGreekGuamanian/ChamorroGuatemalanGuyaneseHaitianHmongHonduranHopiHoumaHungarianIcelanderIndian (Asian)IndonesianInupiatIranianIraqiIrishIroquoisIsraeliItalianJamaicanJapaneseJordanianKenyanKiowaKoreanLaotianLatvianLebaneseLiberianLithuanianLumbeeLuxembourgerMacedonianMalaysianMalteseMarshalleseMenomineeMexicanMexican American IndianMongolianMoroccanNative HawaiianNavajoNepaleseNew ZealanderNicaraguanNigerianNorthern EuropeanNorwegianOkinawanOsageOttawaPaiutePakistaniPalestinianPanamanianParaguayanPennsylvania GermanPeruvianPimaPolishPortuguesePotawatomiPuebloPuerto RicanPuget Sound SalishRomanianRussianSalvadoranSamoanScandinavianScotch-IrishScottishSeminoleSenegaleseSerbianShoshoneSierra LeoneanSiouxSlavicSlovakSloveneSomaliSouth AfricanSouth AmericanSouth American IndianSoviet UnionSpaniardSpanishSpanish AmericanSpanish American IndianSri LankanSubsaharan AfricanSudaneseSwedishSwissSyrianTaiwaneseThaiTlingit-HaidaTohono O'OdhamTonganTrinidadian and TobagonianTsimshianTurkishU.S. Virgin IslanderUgandanUkrainianUruguayanUteVenezuelanVietnameseWelshWest IndianYakamaYaquiYugoslavianYumanYup'ikZimbabwean
Immigration
NonimmigrantsImmigrantsAfghanistanAfricaAlbaniaArgentinaArmeniaAsiaAustraliaAustriaBahamasBangladeshBarbadosBelarusBelgiumBelizeBoliviaBosnia and HerzegovinaBrazilBulgariaBurma/MyanmarCabo VerdeCambodiaCameroonCanadaCaribbeanCentral AmericaChileChinaColombiaCongoCosta RicaCroatiaCubaCzechoslovakiaDenmarkDominicaDominican RepublicEastern AfricaEastern AsiaEastern EuropeEcuadorEgyptEl SalvadorEnglandEritreaEthiopiaEuropeFijiFranceGermanyGhanaGreeceGrenadaGuatemalaGuyanaHaitiHondurasHong KongHungaryIndiaIndonesiaIranIraqIrelandIsraelItalyJamaicaJapanJordanKazakhstanKenyaKoreaKuwaitLaosLatin AmericaLatviaLebanonLiberiaLithuaniaMalaysiaMexicoMicronesiaMiddle AfricaMoldovaMoroccoNepalNetherlandsNicaraguaNigeriaNorth AmericaNorth MacedoniaNorthern EuropeNorwayOceaniaPakistanPanamaPeruPhilippinesPolandPortugalRomaniaRussiaSaudi ArabiaScotlandSenegalSerbiaSierra LeoneSingaporeSomaliaSouth AfricaSouth AmericaSouth Central AsiaSouth Eastern AsiaSouthern EuropeSpainSri LankaSt. Vincent and the GrenadinesSudanSwedenSwitzerlandSyriaTaiwanThailandTrinidad and TobagoTurkeyUgandaUkraineUruguayUzbekistanVenezuelaVietnamWest IndiesWestern AfricaWestern AsiaWestern EuropeYemenZaireZimbabweAzores
Immigrants from Northern Africa
Race
Ancestry
AfghanAfricanAlaska NativeAlaskan AthabascanAlbanianAleutAlsatianAmericanApacheArabArapahoArgentineanArmenianAssyrian/Chaldean/SyriacAustralianAustrianBahamianBangladeshiBarbadianBasqueBelgianBelizeanBermudanBhutaneseBlackfeetBolivianBrazilianBritishBritish West IndianBulgarianBurmeseCajunCambodianCanadianCape VerdeanCarpatho RusynCelticCentral AmericanCentral American IndianCherokeeCheyenneChickasawChileanChineseChippewaChoctawColombianColvilleComancheCosta RicanCreeCreekCroatianCrowCubanCypriotCzechCzechoslovakianDanishDelawareDominicanDutchDutch West IndianEastern EuropeanEcuadorianEgyptianEnglishEstonianEthiopianEuropeanFijianFilipinoFinnishFrenchFrench American IndianFrench CanadianGermanGerman RussianGhanaianGreekGuamanian/ChamorroGuatemalanGuyaneseHaitianHmongHonduranHopiHoumaHungarianIcelanderIndian (Asian)IndonesianInupiatIranianIraqiIrishIroquoisIsraeliItalianJamaicanJapaneseJordanianKenyanKiowaKoreanLaotianLatvianLebaneseLiberianLithuanianLumbeeLuxembourgerMacedonianMalaysianMalteseMarshalleseMenomineeMexicanMexican American IndianMongolianMoroccanNative HawaiianNavajoNepaleseNew ZealanderNicaraguanNigerianNorthern EuropeanNorwegianOkinawanOsageOttawaPaiutePakistaniPalestinianPanamanianParaguayanPennsylvania GermanPeruvianPimaPolishPortuguesePotawatomiPuebloPuerto RicanPuget Sound SalishRomanianRussianSalvadoranSamoanScandinavianScotch-IrishScottishSeminoleSenegaleseSerbianShoshoneSierra LeoneanSiouxSlavicSlovakSloveneSomaliSouth AfricanSouth AmericanSouth American IndianSoviet UnionSpaniardSpanishSpanish AmericanSpanish American IndianSri LankanSubsaharan AfricanSudaneseSwedishSwissSyrianTaiwaneseThaiTlingit-HaidaTohono O'OdhamTonganTrinidadian and TobagonianTsimshianTurkishU.S. Virgin IslanderUgandanUkrainianUruguayanUteVenezuelanVietnameseWelshWest IndianYakamaYaquiYugoslavianYumanYup'ikZimbabwean
Immigration
NonimmigrantsImmigrantsAfghanistanAfricaAlbaniaArgentinaArmeniaAsiaAustraliaAustriaBahamasBangladeshBarbadosBelarusBelgiumBelizeBoliviaBosnia and HerzegovinaBrazilBulgariaBurma/MyanmarCabo VerdeCambodiaCameroonCanadaCaribbeanCentral AmericaChileChinaColombiaCongoCosta RicaCroatiaCubaCzechoslovakiaDenmarkDominicaDominican RepublicEastern AfricaEastern AsiaEastern EuropeEgyptEl SalvadorEnglandEritreaEthiopiaEuropeFijiFranceGermanyGhanaGreeceGrenadaGuatemalaGuyanaHaitiHondurasHong KongHungaryIndiaIndonesiaIranIraqIrelandIsraelItalyJamaicaJapanJordanKazakhstanKenyaKoreaKuwaitLaosLatin AmericaLatviaLebanonLiberiaLithuaniaMalaysiaMexicoMicronesiaMiddle AfricaMoldovaMoroccoNepalNetherlandsNicaraguaNigeriaNorth AmericaNorth MacedoniaNorthern AfricaNorthern EuropeNorwayOceaniaPakistanPanamaPeruPhilippinesPolandPortugalRomaniaRussiaSaudi ArabiaScotlandSenegalSerbiaSierra LeoneSingaporeSomaliaSouth AfricaSouth AmericaSouth Central AsiaSouth Eastern AsiaSouthern EuropeSpainSri LankaSt. Vincent and the GrenadinesSudanSwedenSwitzerlandSyriaTaiwanThailandTrinidad and TobagoTurkeyUgandaUkraineUruguayUzbekistanVenezuelaVietnamWest IndiesWestern AfricaWestern AsiaWestern EuropeYemenZaireZimbabweAzores
2 or more Vehicles in Household
Income
Poverty
Unemployment
Labor Participation
Family Structure
Vehicle Availability
Education Level
Disability

2 or more Vehicles in Household Comparison

Immigrants from Ecuador

Immigrants from Northern Africa

Tragic
Tragic
40.5%
2 OR MORE VEHICLES IN HOUSEHOLD
0.0/ 100
METRIC RATING
333rd/ 347
METRIC RANK
52.3%
2 OR MORE VEHICLES IN HOUSEHOLD
0.4/ 100
METRIC RATING
262nd/ 347
METRIC RANK

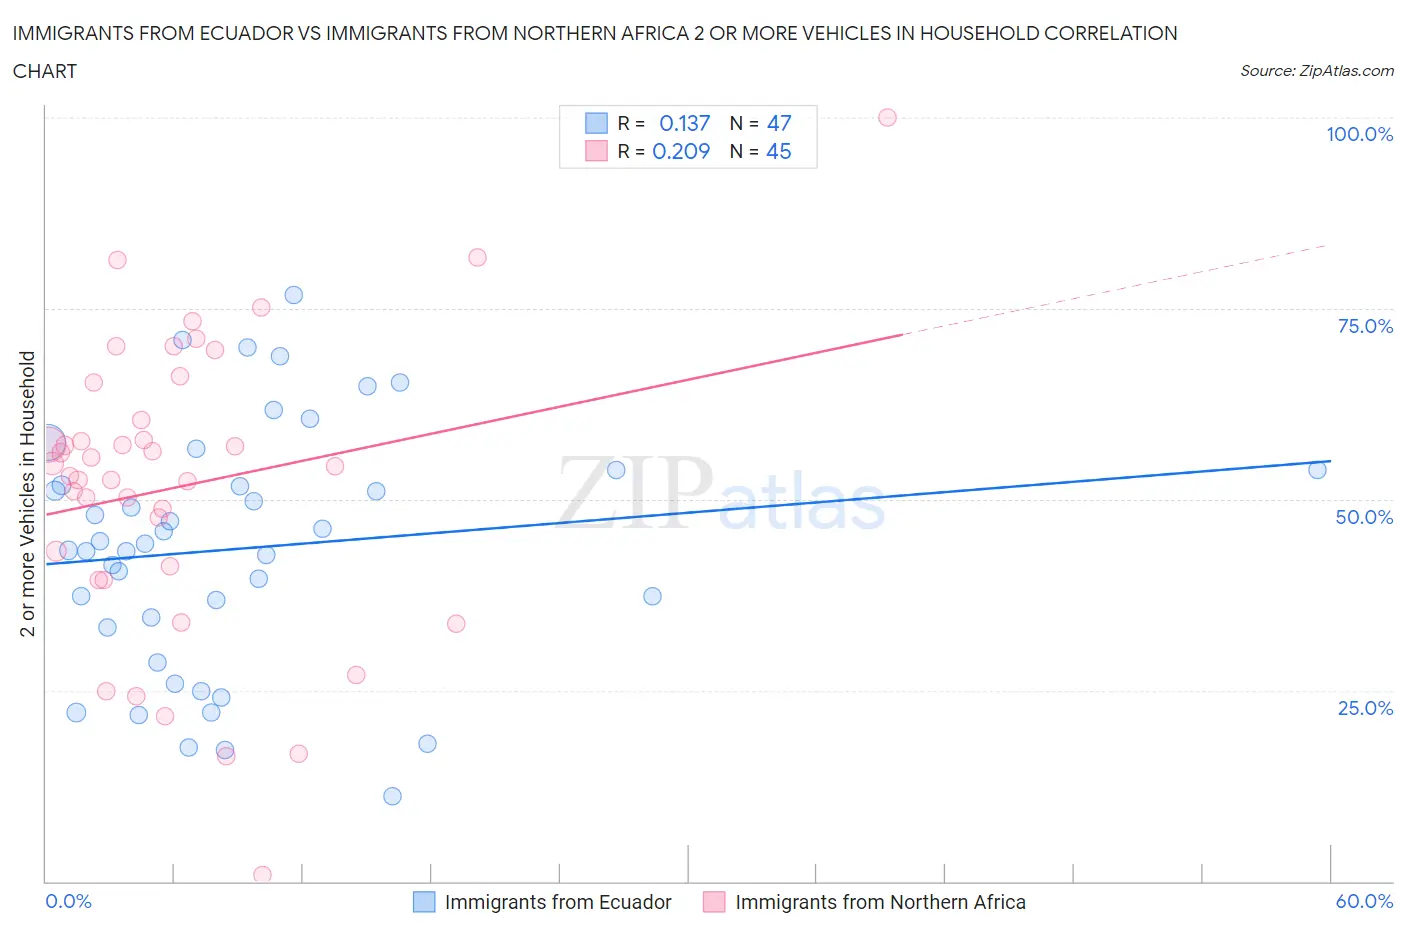
Immigrants from Ecuador vs Immigrants from Northern Africa 2 or more Vehicles in Household Correlation Chart

The statistical analysis conducted on geographies consisting of 270,900,230 people shows a poor positive correlation between the proportion of Immigrants from Ecuador and percentage of households with 2 or more vehicles available in the United States with a correlation coefficient (R) of 0.137 and weighted average of 40.5%. Similarly, the statistical analysis conducted on geographies consisting of 321,098,836 people shows a weak positive correlation between the proportion of Immigrants from Northern Africa and percentage of households with 2 or more vehicles available in the United States with a correlation coefficient (R) of 0.209 and weighted average of 52.3%, a difference of 29.2%.
Immigrants from Ecuador vs Immigrants from Northern Africa 2 or more Vehicles in Household

2 or more Vehicles in Household Correlation Summary

MeasurementImmigrants from EcuadorImmigrants from Northern Africa
Minimum11.1%0.83%
Maximum76.8%100.0%
Range65.7%99.2%
Mean43.6%51.7%
Median44.2%54.3%
Interquartile 25% (IQ1)33.2%40.4%
Interquartile 75% (IQ3)53.8%62.8%
Interquartile Range (IQR)20.6%22.4%
Standard Deviation (Sample)16.0%19.3%
Standard Deviation (Population)15.8%19.1%

Similar Demographics by 2 or more Vehicles in Household

Demographics Similar to Immigrants from Ecuador by 2 or more Vehicles in Household

In terms of 2 or more vehicles in household, the demographic groups most similar to Immigrants from Ecuador are Immigrants from Trinidad and Tobago (40.3%, a difference of 0.58%), Trinidadian and Tobagonian (40.9%, a difference of 0.92%), West Indian (41.3%, a difference of 1.9%), Immigrants from Dominica (41.6%, a difference of 2.8%), and Ecuadorian (42.0%, a difference of 3.6%).
DemographicsRating | Rank2 or more Vehicles in Household
Immigrants | Senegal
0.0
/100
|
#326
Tragic
43.0%
Immigrants | Yemen
0.0
/100
|
#327
Tragic
42.8%
Inupiat
0.0
/100
|
#328
Tragic
42.6%
Ecuadorians
0.0
/100
|
#329
Tragic
42.0%
Immigrants | Dominica
0.0
/100
|
#330
Tragic
41.6%
West Indians
0.0
/100
|
#331
Tragic
41.3%
Trinidadians and Tobagonians
0.0
/100
|
#332
Tragic
40.9%
Immigrants | Ecuador
0.0
/100
|
#333
Tragic
40.5%
Immigrants | Trinidad and Tobago
0.0
/100
|
#334
Tragic
40.3%
Immigrants | Bangladesh
0.0
/100
|
#335
Tragic
38.8%
Vietnamese
0.0
/100
|
#336
Tragic
38.5%
Barbadians
0.0
/100
|
#337
Tragic
38.3%
Immigrants | Uzbekistan
0.0
/100
|
#338
Tragic
37.9%
Immigrants | Barbados
0.0
/100
|
#339
Tragic
35.8%
British West Indians
0.0
/100
|
#340
Tragic
35.4%

Demographics Similar to Immigrants from Northern Africa by 2 or more Vehicles in Household

In terms of 2 or more vehicles in household, the demographic groups most similar to Immigrants from Northern Africa are Immigrants from Southern Europe (52.3%, a difference of 0.13%), Immigrants from Latvia (52.2%, a difference of 0.17%), Immigrants from Australia (52.4%, a difference of 0.20%), Immigrants from Bahamas (52.5%, a difference of 0.23%), and Alsatian (52.5%, a difference of 0.30%).
DemographicsRating | Rank2 or more Vehicles in Household
Uruguayans
0.7
/100
|
#255
Tragic
52.7%
Immigrants | Eritrea
0.7
/100
|
#256
Tragic
52.6%
Immigrants | Hong Kong
0.6
/100
|
#257
Tragic
52.6%
Central American Indians
0.6
/100
|
#258
Tragic
52.5%
Alsatians
0.6
/100
|
#259
Tragic
52.5%
Immigrants | Bahamas
0.5
/100
|
#260
Tragic
52.5%
Immigrants | Australia
0.5
/100
|
#261
Tragic
52.4%
Immigrants | Northern Africa
0.4
/100
|
#262
Tragic
52.3%
Immigrants | Southern Europe
0.4
/100
|
#263
Tragic
52.3%
Immigrants | Latvia
0.4
/100
|
#264
Tragic
52.2%
Immigrants | Congo
0.3
/100
|
#265
Tragic
52.1%
Immigrants | France
0.2
/100
|
#266
Tragic
52.0%
Immigrants | Colombia
0.2
/100
|
#267
Tragic
52.0%
Pima
0.2
/100
|
#268
Tragic
52.0%
Hondurans
0.2
/100
|
#269
Tragic
52.0%