French American Indian vs Slovene 3 or more Vehicles in Household
COMPARE
French American Indian
Slovene
3 or more Vehicles in Household
3 or more Vehicles in Household Comparison
French American Indians
Slovenes
20.1%
3 OR MORE VEHICLES IN HOUSEHOLD
85.3/ 100
METRIC RATING
140th/ 347
METRIC RANK
20.2%
3 OR MORE VEHICLES IN HOUSEHOLD
85.5/ 100
METRIC RATING
139th/ 347
METRIC RANK
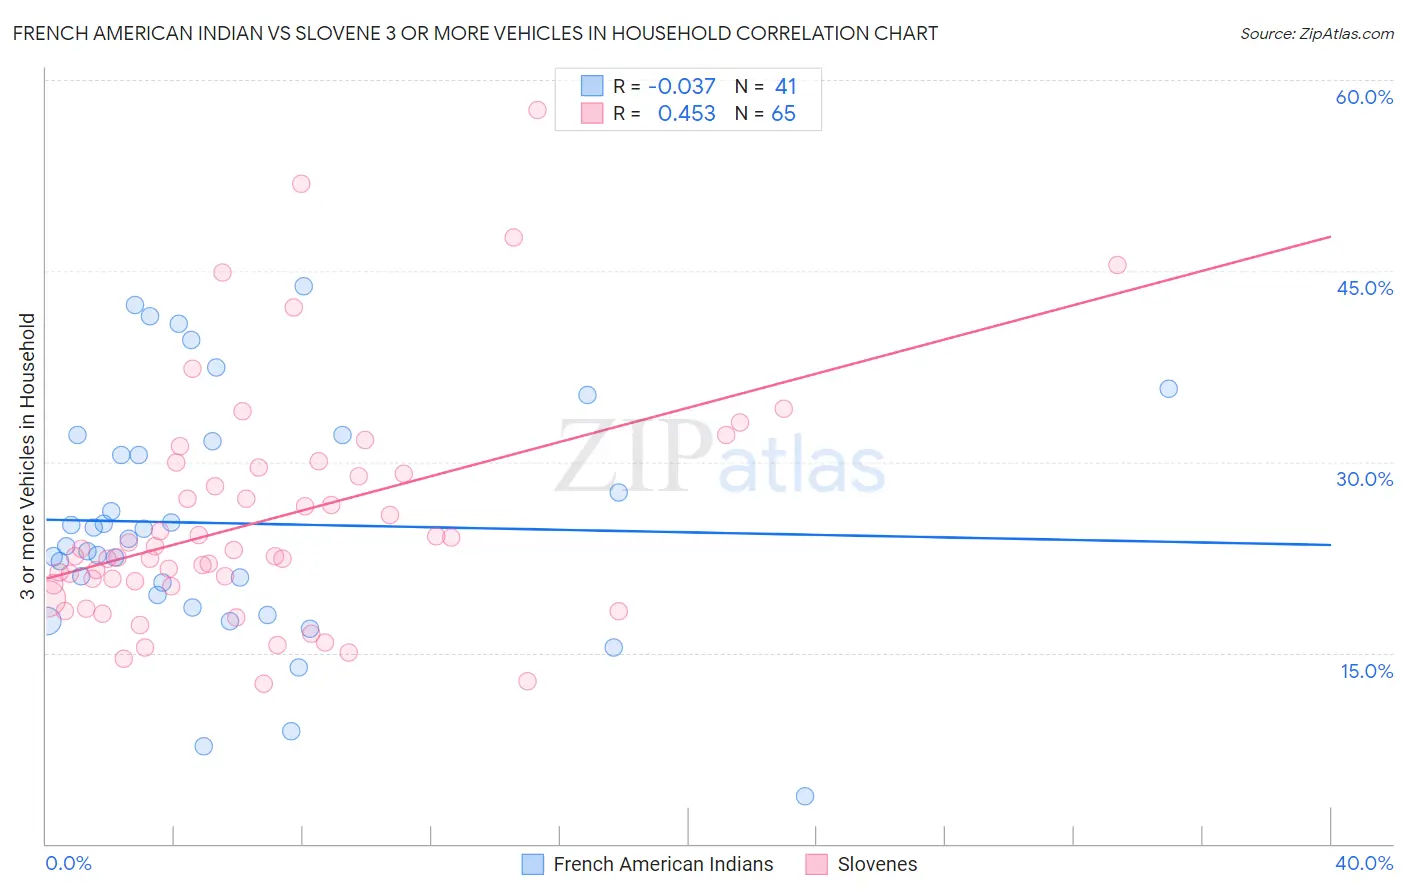
French American Indian vs Slovene 3 or more Vehicles in Household Correlation Chart
The statistical analysis conducted on geographies consisting of 131,968,007 people shows no correlation between the proportion of French American Indians and percentage of households with 3 or more vehicles available in the United States with a correlation coefficient (R) of -0.037 and weighted average of 20.1%. Similarly, the statistical analysis conducted on geographies consisting of 261,197,281 people shows a moderate positive correlation between the proportion of Slovenes and percentage of households with 3 or more vehicles available in the United States with a correlation coefficient (R) of 0.453 and weighted average of 20.2%, a difference of 0.030%.
3 or more Vehicles in Household Correlation Summary
| Measurement | French American Indian | Slovene |
| Minimum | 3.7% | 12.5% |
| Maximum | 43.8% | 57.7% |
| Range | 40.0% | 45.2% |
| Mean | 25.2% | 25.5% |
| Median | 24.0% | 22.6% |
| Interquartile 25% (IQ1) | 19.0% | 20.3% |
| Interquartile 75% (IQ3) | 31.9% | 29.3% |
| Interquartile Range (IQR) | 12.8% | 9.0% |
| Standard Deviation (Sample) | 9.5% | 9.2% |
| Standard Deviation (Population) | 9.4% | 9.2% |
Demographics Similar to French American Indians and Slovenes by 3 or more Vehicles in Household
In terms of 3 or more vehicles in household, the demographic groups most similar to French American Indians are Ottawa (20.1%, a difference of 0.060%), Jordanian (20.1%, a difference of 0.12%), Lithuanian (20.1%, a difference of 0.13%), Aleut (20.2%, a difference of 0.15%), and Iranian (20.1%, a difference of 0.18%). Similarly, the demographic groups most similar to Slovenes are Ottawa (20.1%, a difference of 0.090%), Aleut (20.2%, a difference of 0.12%), Jordanian (20.1%, a difference of 0.15%), Lithuanian (20.1%, a difference of 0.16%), and Iranian (20.1%, a difference of 0.21%).
| Demographics | Rating | Rank | 3 or more Vehicles in Household |
| Zimbabweans | 88.7 /100 | #129 | Excellent 20.3% |
| Greeks | 88.6 /100 | #130 | Excellent 20.3% |
| Immigrants | Asia | 88.1 /100 | #131 | Excellent 20.2% |
| Immigrants | Canada | 87.8 /100 | #132 | Excellent 20.2% |
| Immigrants | North America | 87.8 /100 | #133 | Excellent 20.2% |
| Poles | 87.3 /100 | #134 | Excellent 20.2% |
| Immigrants | India | 87.2 /100 | #135 | Excellent 20.2% |
| Immigrants | Nicaragua | 87.1 /100 | #136 | Excellent 20.2% |
| Immigrants | Iraq | 87.1 /100 | #137 | Excellent 20.2% |
| Aleuts | 86.3 /100 | #138 | Excellent 20.2% |
| Slovenes | 85.5 /100 | #139 | Excellent 20.2% |
| French American Indians | 85.3 /100 | #140 | Excellent 20.1% |
| Ottawa | 84.9 /100 | #141 | Excellent 20.1% |
| Jordanians | 84.4 /100 | #142 | Excellent 20.1% |
| Lithuanians | 84.4 /100 | #143 | Excellent 20.1% |
| Iranians | 84.0 /100 | #144 | Excellent 20.1% |
| Palestinians | 83.9 /100 | #145 | Excellent 20.1% |
| Australians | 83.6 /100 | #146 | Excellent 20.1% |
| Slovaks | 83.0 /100 | #147 | Excellent 20.1% |
| Guatemalans | 82.6 /100 | #148 | Excellent 20.1% |
| Immigrants | Iran | 80.9 /100 | #149 | Excellent 20.0% |