Choctaw vs Blackfeet 3 or more Vehicles in Household

COMPARE

Choctaw
Race
Ancestry
AfghanAfricanAlaska NativeAlaskan AthabascanAlbanianAleutAlsatianAmericanApacheArabArapahoArgentineanArmenianAssyrian/Chaldean/SyriacAustralianAustrianBahamianBangladeshiBarbadianBasqueBelgianBelizeanBermudanBhutaneseBolivianBrazilianBritishBritish West IndianBulgarianBurmeseCajunCambodianCanadianCape VerdeanCarpatho RusynCelticCentral AmericanCentral American IndianCherokeeCheyenneChickasawChileanChineseChippewaChoctawColombianColvilleComancheCosta RicanCreeCreekCroatianCrowCubanCypriotCzechCzechoslovakianDanishDelawareDominicanDutchDutch West IndianEastern EuropeanEcuadorianEgyptianEnglishEstonianEthiopianEuropeanFijianFilipinoFinnishFrenchFrench American IndianFrench CanadianGermanGerman RussianGhanaianGreekGuamanian/ChamorroGuatemalanGuyaneseHaitianHmongHonduranHopiHoumaHungarianIcelanderIndian (Asian)IndonesianInupiatIranianIraqiIrishIroquoisIsraeliItalianJamaicanJapaneseJordanianKenyanKiowaKoreanLaotianLatvianLebaneseLiberianLithuanianLumbeeLuxembourgerMacedonianMalaysianMalteseMarshalleseMenomineeMexicanMexican American IndianMongolianMoroccanNative HawaiianNavajoNepaleseNew ZealanderNicaraguanNigerianNorthern EuropeanNorwegianOkinawanOsageOttawaPaiutePakistaniPalestinianPanamanianParaguayanPennsylvania GermanPeruvianPimaPolishPortuguesePotawatomiPuebloPuerto RicanPuget Sound SalishRomanianRussianSalvadoranSamoanScandinavianScotch-IrishScottishSeminoleSenegaleseSerbianShoshoneSierra LeoneanSiouxSlavicSlovakSloveneSomaliSouth AfricanSouth AmericanSouth American IndianSoviet UnionSpaniardSpanishSpanish AmericanSpanish American IndianSri LankanSubsaharan AfricanSudaneseSwedishSwissSyrianTaiwaneseThaiTlingit-HaidaTohono O'OdhamTonganTrinidadian and TobagonianTsimshianTurkishU.S. Virgin IslanderUgandanUkrainianUruguayanUteVenezuelanVietnameseWelshWest IndianYakamaYaquiYugoslavianYumanYup'ikZimbabwean
Immigration
NonimmigrantsImmigrantsAfghanistanAfricaAlbaniaArgentinaArmeniaAsiaAustraliaAustriaBahamasBangladeshBarbadosBelarusBelgiumBelizeBoliviaBosnia and HerzegovinaBrazilBulgariaBurma/MyanmarCabo VerdeCambodiaCameroonCanadaCaribbeanCentral AmericaChileChinaColombiaCongoCosta RicaCroatiaCubaCzechoslovakiaDenmarkDominicaDominican RepublicEastern AfricaEastern AsiaEastern EuropeEcuadorEgyptEl SalvadorEnglandEritreaEthiopiaEuropeFijiFranceGermanyGhanaGreeceGrenadaGuatemalaGuyanaHaitiHondurasHong KongHungaryIndiaIndonesiaIranIraqIrelandIsraelItalyJamaicaJapanJordanKazakhstanKenyaKoreaKuwaitLaosLatin AmericaLatviaLebanonLiberiaLithuaniaMalaysiaMexicoMicronesiaMiddle AfricaMoldovaMoroccoNepalNetherlandsNicaraguaNigeriaNorth AmericaNorth MacedoniaNorthern AfricaNorthern EuropeNorwayOceaniaPakistanPanamaPeruPhilippinesPolandPortugalRomaniaRussiaSaudi ArabiaScotlandSenegalSerbiaSierra LeoneSingaporeSomaliaSouth AfricaSouth AmericaSouth Central AsiaSouth Eastern AsiaSouthern EuropeSpainSri LankaSt. Vincent and the GrenadinesSudanSwedenSwitzerlandSyriaTaiwanThailandTrinidad and TobagoTurkeyUgandaUkraineUruguayUzbekistanVenezuelaVietnamWest IndiesWestern AfricaWestern AsiaWestern EuropeYemenZaireZimbabweAzores
Blackfeet
Race
Ancestry
AfghanAfricanAlaska NativeAlaskan AthabascanAlbanianAleutAlsatianAmericanApacheArabArapahoArgentineanArmenianAssyrian/Chaldean/SyriacAustralianAustrianBahamianBangladeshiBarbadianBasqueBelgianBelizeanBermudanBhutaneseBlackfeetBolivianBrazilianBritishBritish West IndianBulgarianBurmeseCajunCambodianCanadianCape VerdeanCarpatho RusynCelticCentral AmericanCentral American IndianCherokeeCheyenneChickasawChileanChineseChippewaColombianColvilleComancheCosta RicanCreeCreekCroatianCrowCubanCypriotCzechCzechoslovakianDanishDelawareDominicanDutchDutch West IndianEastern EuropeanEcuadorianEgyptianEnglishEstonianEthiopianEuropeanFijianFilipinoFinnishFrenchFrench American IndianFrench CanadianGermanGerman RussianGhanaianGreekGuamanian/ChamorroGuatemalanGuyaneseHaitianHmongHonduranHopiHoumaHungarianIcelanderIndian (Asian)IndonesianInupiatIranianIraqiIrishIroquoisIsraeliItalianJamaicanJapaneseJordanianKenyanKiowaKoreanLaotianLatvianLebaneseLiberianLithuanianLumbeeLuxembourgerMacedonianMalaysianMalteseMarshalleseMenomineeMexicanMexican American IndianMongolianMoroccanNative HawaiianNavajoNepaleseNew ZealanderNicaraguanNigerianNorthern EuropeanNorwegianOkinawanOsageOttawaPaiutePakistaniPalestinianPanamanianParaguayanPennsylvania GermanPeruvianPimaPolishPortuguesePotawatomiPuebloPuerto RicanPuget Sound SalishRomanianRussianSalvadoranSamoanScandinavianScotch-IrishScottishSeminoleSenegaleseSerbianShoshoneSierra LeoneanSiouxSlavicSlovakSloveneSomaliSouth AfricanSouth AmericanSouth American IndianSoviet UnionSpaniardSpanishSpanish AmericanSpanish American IndianSri LankanSubsaharan AfricanSudaneseSwedishSwissSyrianTaiwaneseThaiTlingit-HaidaTohono O'OdhamTonganTrinidadian and TobagonianTsimshianTurkishU.S. Virgin IslanderUgandanUkrainianUruguayanUteVenezuelanVietnameseWelshWest IndianYakamaYaquiYugoslavianYumanYup'ikZimbabwean
Immigration
NonimmigrantsImmigrantsAfghanistanAfricaAlbaniaArgentinaArmeniaAsiaAustraliaAustriaBahamasBangladeshBarbadosBelarusBelgiumBelizeBoliviaBosnia and HerzegovinaBrazilBulgariaBurma/MyanmarCabo VerdeCambodiaCameroonCanadaCaribbeanCentral AmericaChileChinaColombiaCongoCosta RicaCroatiaCubaCzechoslovakiaDenmarkDominicaDominican RepublicEastern AfricaEastern AsiaEastern EuropeEcuadorEgyptEl SalvadorEnglandEritreaEthiopiaEuropeFijiFranceGermanyGhanaGreeceGrenadaGuatemalaGuyanaHaitiHondurasHong KongHungaryIndiaIndonesiaIranIraqIrelandIsraelItalyJamaicaJapanJordanKazakhstanKenyaKoreaKuwaitLaosLatin AmericaLatviaLebanonLiberiaLithuaniaMalaysiaMexicoMicronesiaMiddle AfricaMoldovaMoroccoNepalNetherlandsNicaraguaNigeriaNorth AmericaNorth MacedoniaNorthern AfricaNorthern EuropeNorwayOceaniaPakistanPanamaPeruPhilippinesPolandPortugalRomaniaRussiaSaudi ArabiaScotlandSenegalSerbiaSierra LeoneSingaporeSomaliaSouth AfricaSouth AmericaSouth Central AsiaSouth Eastern AsiaSouthern EuropeSpainSri LankaSt. Vincent and the GrenadinesSudanSwedenSwitzerlandSyriaTaiwanThailandTrinidad and TobagoTurkeyUgandaUkraineUruguayUzbekistanVenezuelaVietnamWest IndiesWestern AfricaWestern AsiaWestern EuropeYemenZaireZimbabweAzores
3 or more Vehicles in Household
Income
Poverty
Unemployment
Labor Participation
Family Structure
Vehicle Availability
Education Level
Disability

3 or more Vehicles in Household Comparison

Choctaw

Blackfeet

Exceptional
Exceptional
23.0%
3 OR MORE VEHICLES IN HOUSEHOLD
100.0/ 100
METRIC RATING
35th/ 347
METRIC RANK
20.9%
3 OR MORE VEHICLES IN HOUSEHOLD
97.9/ 100
METRIC RATING
101st/ 347
METRIC RANK

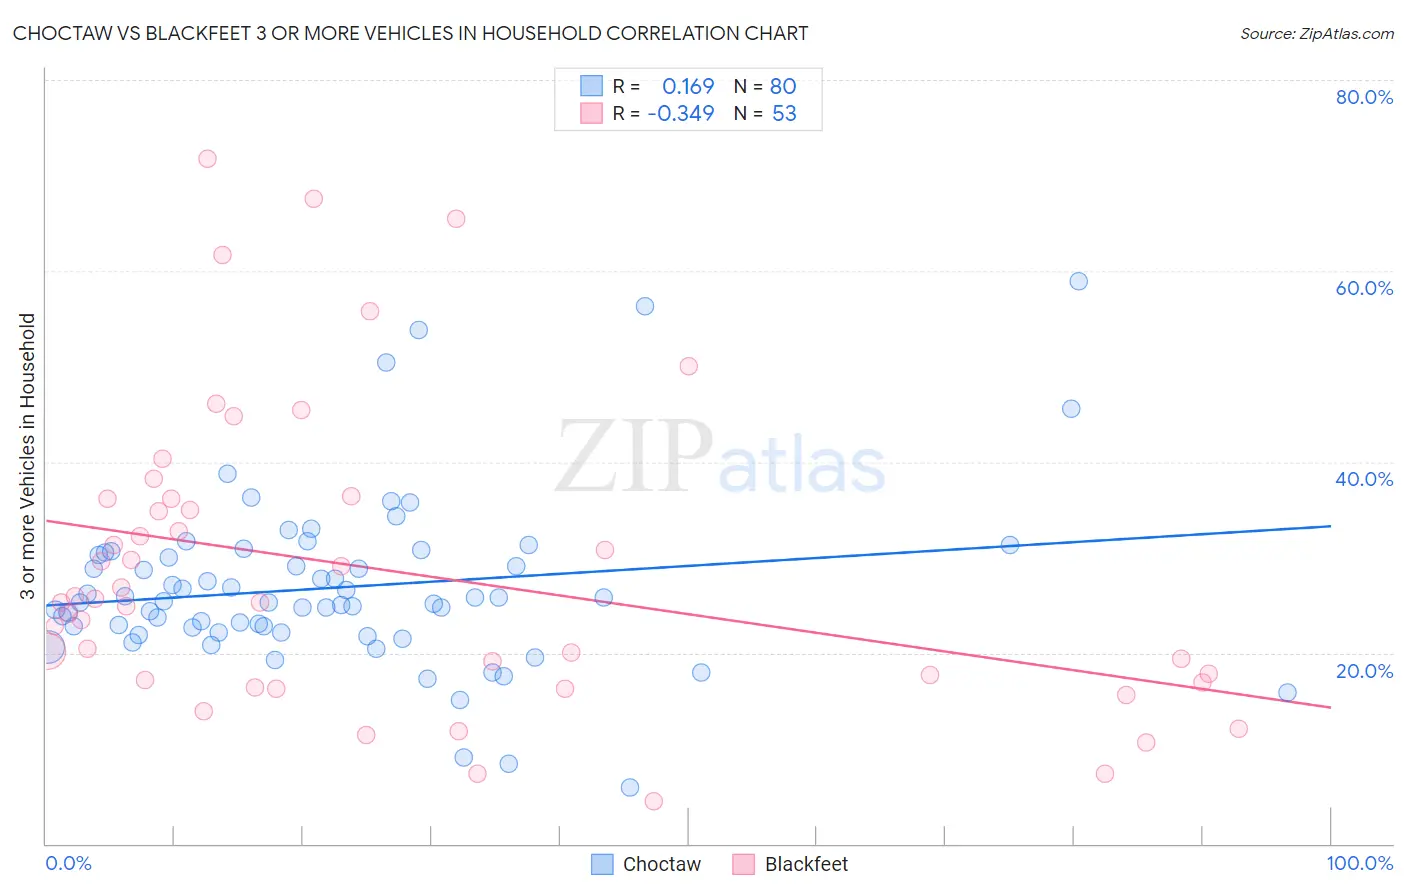
Choctaw vs Blackfeet 3 or more Vehicles in Household Correlation Chart

The statistical analysis conducted on geographies consisting of 269,608,745 people shows a poor positive correlation between the proportion of Choctaw and percentage of households with 3 or more vehicles available in the United States with a correlation coefficient (R) of 0.169 and weighted average of 23.0%. Similarly, the statistical analysis conducted on geographies consisting of 309,447,787 people shows a mild negative correlation between the proportion of Blackfeet and percentage of households with 3 or more vehicles available in the United States with a correlation coefficient (R) of -0.349 and weighted average of 20.9%, a difference of 10.0%.
Choctaw vs Blackfeet 3 or more Vehicles in Household

3 or more Vehicles in Household Correlation Summary

MeasurementChoctawBlackfeet
Minimum5.9%4.5%
Maximum58.9%71.7%
Range53.0%67.2%
Mean26.8%28.6%
Median25.3%25.3%
Interquartile 25% (IQ1)22.4%17.1%
Interquartile 75% (IQ3)30.4%36.1%
Interquartile Range (IQR)7.9%19.1%
Standard Deviation (Sample)9.1%15.8%
Standard Deviation (Population)9.0%15.6%

Similar Demographics by 3 or more Vehicles in Household

Demographics Similar to Choctaw by 3 or more Vehicles in Household

In terms of 3 or more vehicles in household, the demographic groups most similar to Choctaw are Swiss (23.0%, a difference of 0.020%), Cherokee (23.0%, a difference of 0.040%), Spanish American (23.0%, a difference of 0.070%), Swedish (23.0%, a difference of 0.070%), and Pueblo (23.0%, a difference of 0.13%).
DemographicsRating | Rank3 or more Vehicles in Household
Lumbee
100.0
/100
|
#28
Exceptional
23.1%
Spanish
100.0
/100
|
#29
Exceptional
23.1%
Immigrants | South Eastern Asia
100.0
/100
|
#30
Exceptional
23.1%
English
100.0
/100
|
#31
Exceptional
23.1%
Pueblo
100.0
/100
|
#32
Exceptional
23.0%
Spanish Americans
100.0
/100
|
#33
Exceptional
23.0%
Swiss
100.0
/100
|
#34
Exceptional
23.0%
Choctaw
100.0
/100
|
#35
Exceptional
23.0%
Cherokee
100.0
/100
|
#36
Exceptional
23.0%
Swedes
100.0
/100
|
#37
Exceptional
23.0%
Dutch
100.0
/100
|
#38
Exceptional
22.9%
Yaqui
100.0
/100
|
#39
Exceptional
22.9%
Europeans
100.0
/100
|
#40
Exceptional
22.9%
Germans
100.0
/100
|
#41
Exceptional
22.7%
Natives/Alaskans
100.0
/100
|
#42
Exceptional
22.7%

Demographics Similar to Blackfeet by 3 or more Vehicles in Household

In terms of 3 or more vehicles in household, the demographic groups most similar to Blackfeet are Seminole (20.9%, a difference of 0.030%), Dutch West Indian (20.9%, a difference of 0.070%), Luxembourger (20.9%, a difference of 0.15%), Austrian (20.9%, a difference of 0.25%), and Comanche (21.0%, a difference of 0.31%).
DemographicsRating | Rank3 or more Vehicles in Household
Immigrants | Cambodia
98.6
/100
|
#94
Exceptional
21.1%
Pakistanis
98.5
/100
|
#95
Exceptional
21.0%
Cree
98.4
/100
|
#96
Exceptional
21.0%
Canadians
98.3
/100
|
#97
Exceptional
21.0%
Hmong
98.2
/100
|
#98
Exceptional
21.0%
Alaska Natives
98.2
/100
|
#99
Exceptional
21.0%
Comanche
98.2
/100
|
#100
Exceptional
21.0%
Blackfeet
97.9
/100
|
#101
Exceptional
20.9%
Seminole
97.8
/100
|
#102
Exceptional
20.9%
Dutch West Indians
97.8
/100
|
#103
Exceptional
20.9%
Luxembourgers
97.7
/100
|
#104
Exceptional
20.9%
Austrians
97.5
/100
|
#105
Exceptional
20.9%
Bolivians
97.4
/100
|
#106
Exceptional
20.8%
Immigrants | Germany
97.4
/100
|
#107
Exceptional
20.8%
Immigrants | Scotland
97.1
/100
|
#108
Exceptional
20.8%