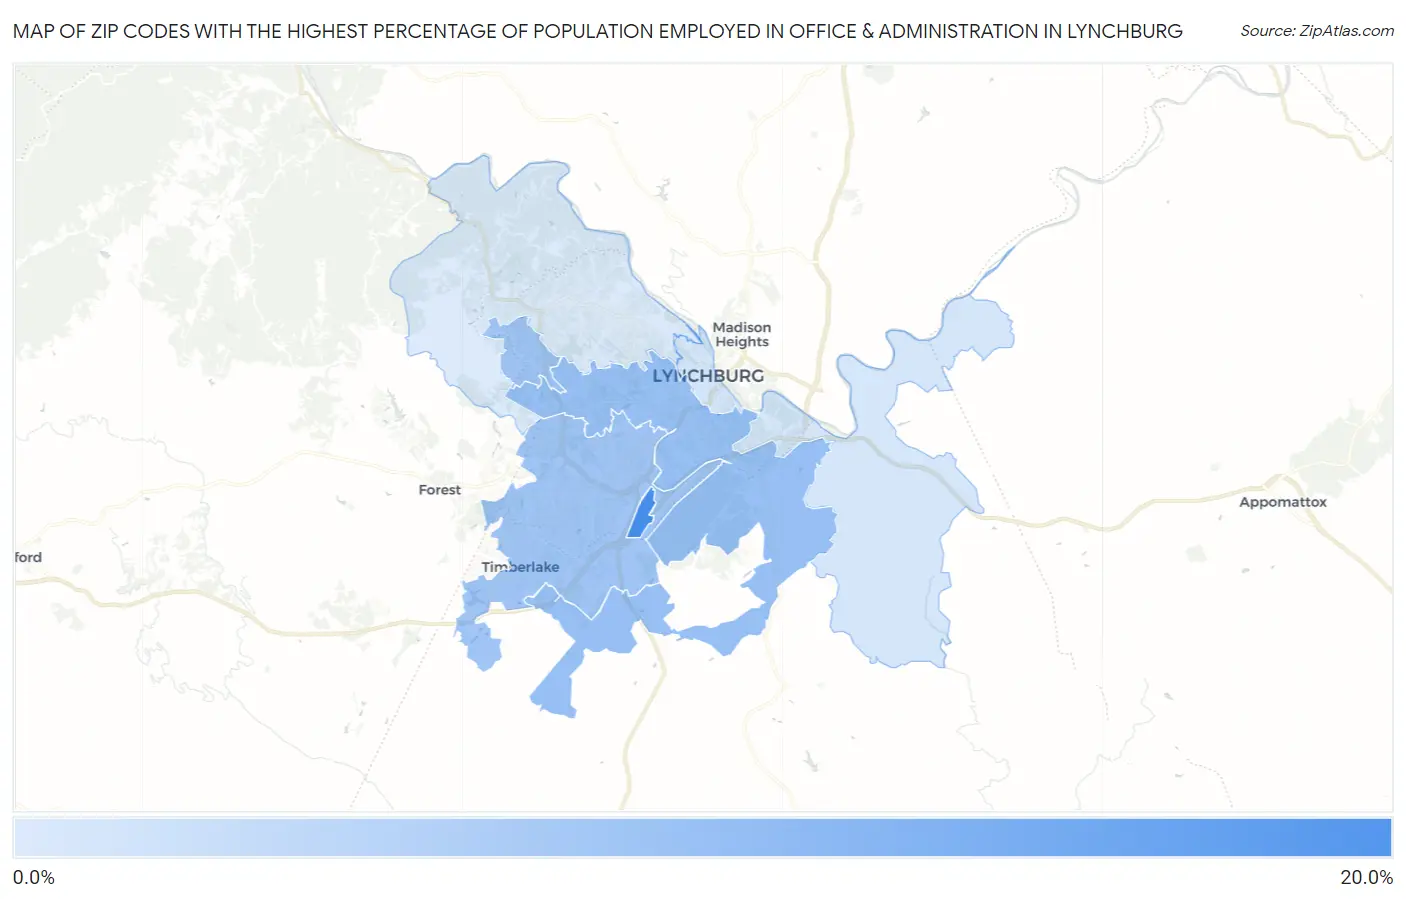
Zip Codes with the Highest Percentage of Population Employed in Office & Administration in Lynchburg, VA
RELATED REPORTS & OPTIONS
Office & Administration
Lynchburg
Compare Zip Codes
Map of Zip Codes with the Highest Percentage of Population Employed in Office & Administration in Lynchburg
0.0%
20.0%
Zip Codes with the Highest Percentage of Population Employed in Office & Administration in Lynchburg, VA
| Zip Code | % Employed | vs State | vs National | |
| 1. | 24515 | 19.9% | 10.0%(+9.90)#62 | 10.9%(+9.03)#1,721 |
| 2. | 24501 | 12.6% | 10.0%(+2.63)#212 | 10.9%(+1.76)#8,989 |
| 3. | 24502 | 11.8% | 10.0%(+1.82)#265 | 10.9%(+0.950)#11,322 |
| 4. | 24504 | 7.3% | 10.0%(-2.65)#603 | 10.9%(-3.52)#24,542 |
| 5. | 24503 | 6.7% | 10.0%(-3.27)#638 | 10.9%(-4.15)#25,738 |
1
Common Questions
What are the Top 3 Zip Codes with the Highest Percentage of Population Employed in Office & Administration in Lynchburg, VA?
Top 3 Zip Codes with the Highest Percentage of Population Employed in Office & Administration in Lynchburg, VA are:
What zip code has the Highest Percentage of Population Employed in Office & Administration in Lynchburg, VA?
24515 has the Highest Percentage of Population Employed in Office & Administration in Lynchburg, VA with 19.9%.
What is the Percentage of Population Employed in Office & Administration in Lynchburg, VA?
Percentage of Population Employed in Office & Administration in Lynchburg is 11.0%.
What is the Percentage of Population Employed in Office & Administration in Virginia?
Percentage of Population Employed in Office & Administration in Virginia is 10.0%.
What is the Percentage of Population Employed in Office & Administration in the United States?
Percentage of Population Employed in Office & Administration in the United States is 10.9%.