Zip Codes with the Highest Percentage of Population Employed in Office & Administration in Chantilly, VA
RELATED REPORTS & OPTIONS
Office & Administration
Chantilly
Compare Zip Codes
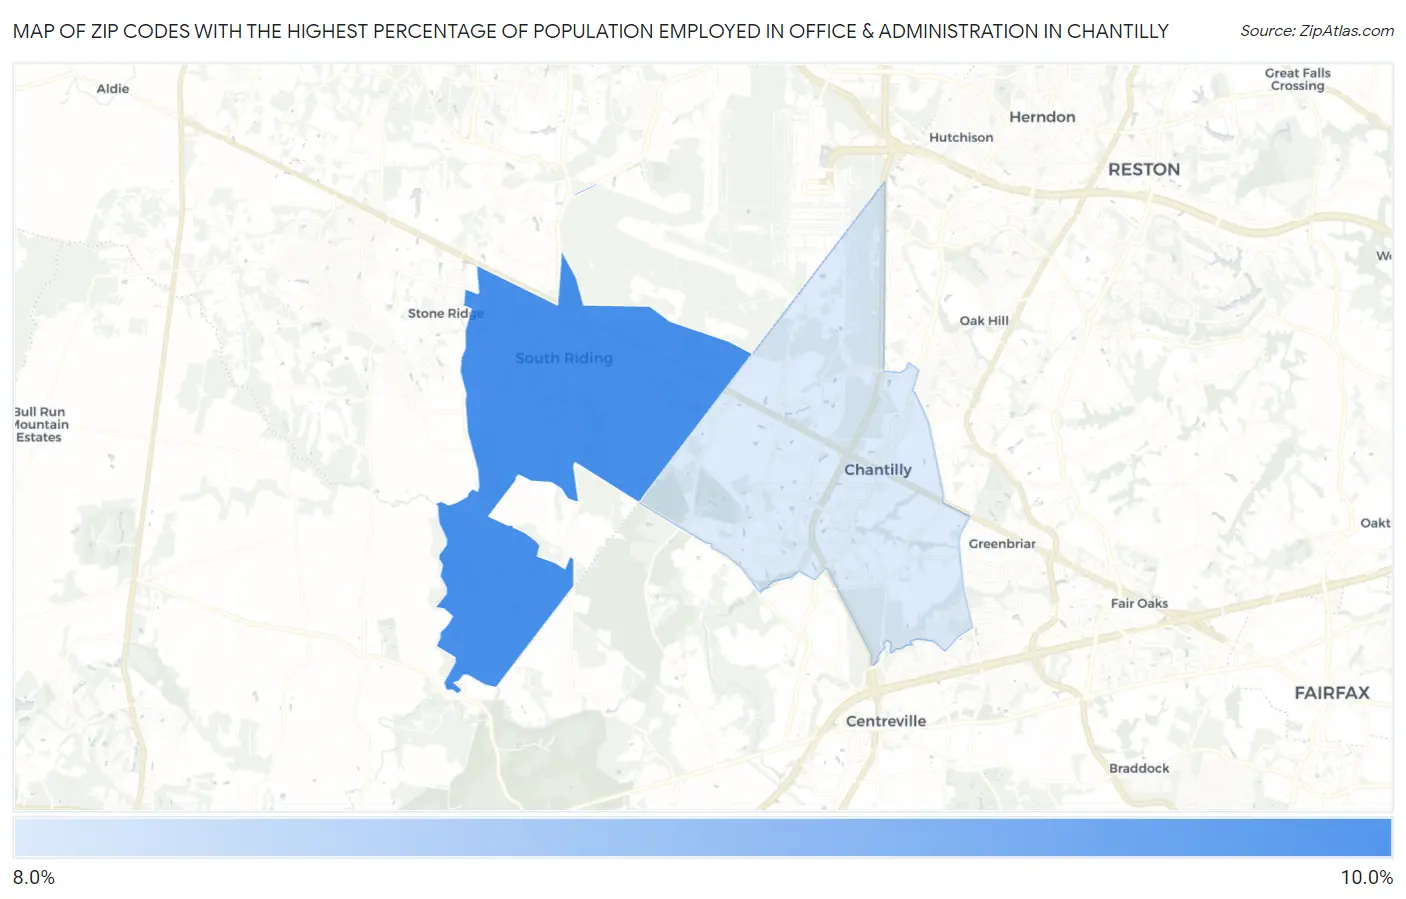
Map of Zip Codes with the Highest Percentage of Population Employed in Office & Administration in Chantilly
0.0%
10.0%
Zip Codes with the Highest Percentage of Population Employed in Office & Administration in Chantilly, VA
| Zip Code | % Employed | vs State | vs National | |
| 1. | 20152 | 9.2% | 10.0%(-0.809)#462 | 10.9%(-1.68)#19,733 |
| 2. | 20151 | 8.7% | 10.0%(-1.27)#495 | 10.9%(-2.15)#21,125 |
1
Common Questions
What are the Top Zip Codes with the Highest Percentage of Population Employed in Office & Administration in Chantilly, VA?
Top Zip Codes with the Highest Percentage of Population Employed in Office & Administration in Chantilly, VA are:
What zip code has the Highest Percentage of Population Employed in Office & Administration in Chantilly, VA?
20152 has the Highest Percentage of Population Employed in Office & Administration in Chantilly, VA with 9.2%.
What is the Percentage of Population Employed in Office & Administration in Chantilly, VA?
Percentage of Population Employed in Office & Administration in Chantilly is 8.8%.
What is the Percentage of Population Employed in Office & Administration in Virginia?
Percentage of Population Employed in Office & Administration in Virginia is 10.0%.
What is the Percentage of Population Employed in Office & Administration in the United States?
Percentage of Population Employed in Office & Administration in the United States is 10.9%.