Zip Codes with the Highest Percentage of Population Employed in Community & Social Service in Vienna, VA

RELATED REPORTS & OPTIONS

Community & Social Service
Population
Families and Households
Female Fertility
Female Fertility (Unmarried)
Race (Community Size)
Race (Percentage)
Ancestry (Community Size)
AfghanAfricanAmericanArabArgentineanArmenianAustralianAustrianBelgianBhutaneseBolivianBrazilianBritishBurmeseCanadianCape VerdeanCelticCentral AmericanCentral American IndianCherokeeChileanColombianCosta RicanCroatianCubanCzechCzechoslovakianDanishDutchEastern EuropeanEcuadorianEgyptianEnglishEthiopianEuropeanFilipinoFinnishFrenchFrench CanadianGermanGreekGuatemalanHaitianHonduranHungarianIndian (Asian)IranianIraqiIrishIsraeliItalianJamaicanJapaneseJordanianKoreanLaotianLebaneseLithuanianMexicanMexican American IndianMongolianNorthern EuropeanNorwegianPakistaniPalestinianPanamanianParaguayanPeruvianPolishPortuguesePuerto RicanRomanianRussianSalvadoranScandinavianScotch-IrishScottishSerbianSlavicSlovakSloveneSouth AfricanSouth AmericanSpaniardSpanishSri LankanSubsaharan AfricanSudaneseSwedishSwissSyrianThaiTurkishUkrainianVenezuelanVietnameseWelshWest Indian
Ancestry (Percentage)
AfghanAfricanAmericanArabArgentineanArmenianAustralianAustrianBelgianBhutaneseBolivianBrazilianBritishBurmeseCanadianCape VerdeanCelticCentral AmericanCentral American IndianCherokeeChileanColombianCosta RicanCroatianCubanCzechCzechoslovakianDanishDutchEastern EuropeanEcuadorianEgyptianEnglishEthiopianEuropeanFilipinoFinnishFrenchFrench CanadianGermanGreekGuatemalanHaitianHonduranHungarianIndian (Asian)IranianIraqiIrishIsraeliItalianJamaicanJapaneseJordanianKoreanLaotianLebaneseLithuanianMexicanMexican American IndianMongolianNorthern EuropeanNorwegianPakistaniPalestinianPanamanianParaguayanPeruvianPolishPortuguesePuerto RicanRomanianRussianSalvadoranScandinavianScotch-IrishScottishSerbianSlavicSlovakSloveneSouth AfricanSouth AmericanSpaniardSpanishSri LankanSubsaharan AfricanSudaneseSwedishSwissSyrianThaiTurkishUkrainianVenezuelanVietnameseWelshWest Indian
Immigrant Origin (Total)
Immigrant Origin (Percentage)
Income
Income (Families)
Income (Households)
Poverty
Poverty (Families)
Unemployment
Employment Occupations
Employment Industries
Employer Class
Commute Time
Commute Means
School Enrollment
Education by Degree Field
Occupancy
Finances
Physical Characteristics
Vienna
Compare Zip Codes
Comparison Subject

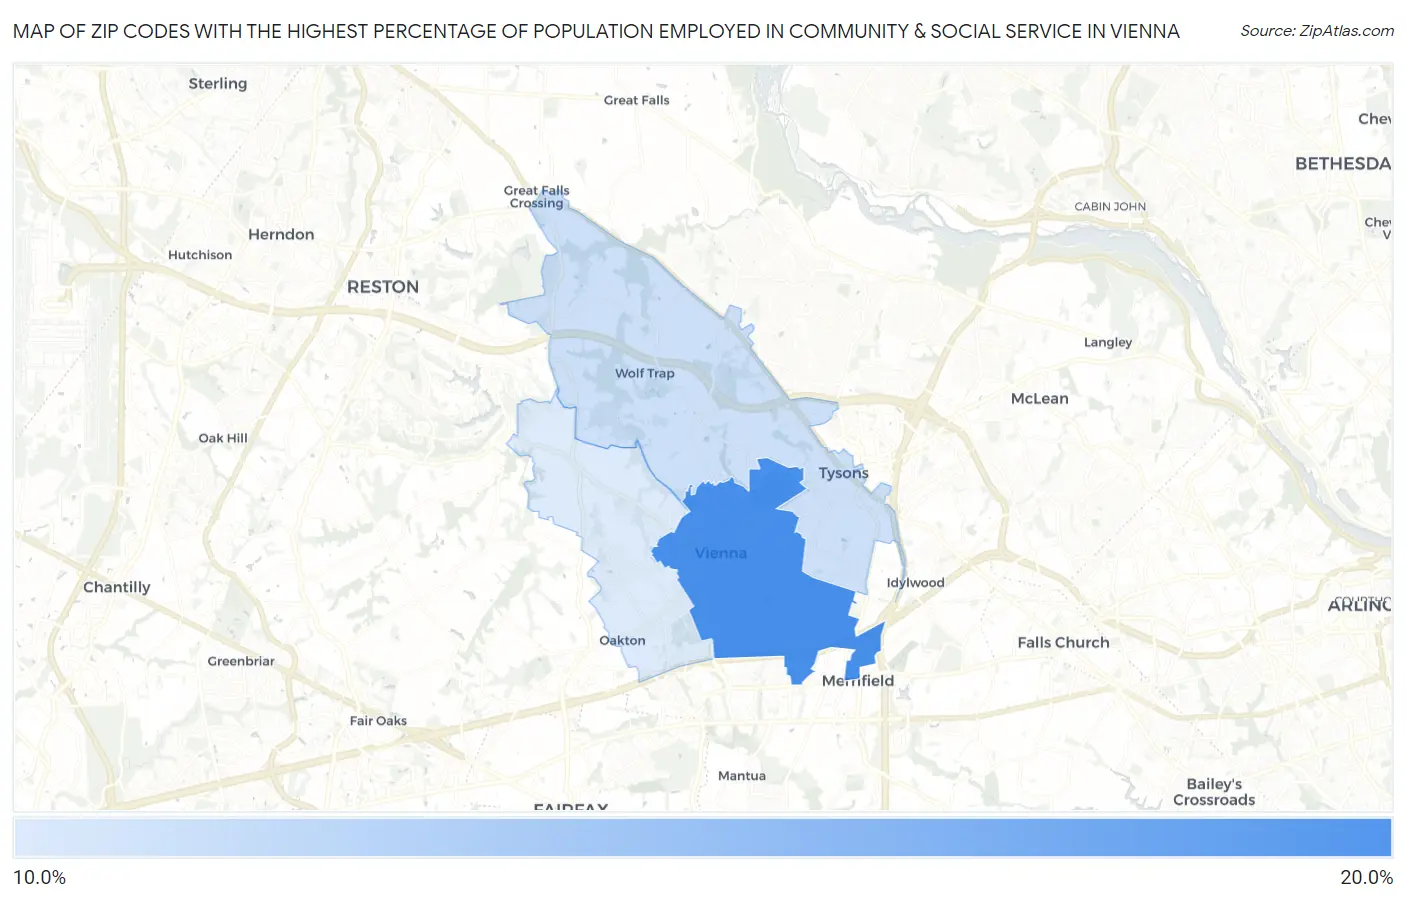
Map of Zip Codes with the Highest Percentage of Population Employed in Community & Social Service in Vienna

0.0%
20.0%
Zip Codes with the Highest Percentage of Population Employed in Community & Social Service  in Vienna Map

Zip Codes with the Highest Percentage of Population Employed in Community & Social Service in Vienna, VA

Zip Code % Employed vs State vs National
1.2218017.1%12.1%(+4.98)#11711.2%(+5.90)#3,307
2.2218215.0%12.1%(+2.82)#16611.2%(+3.74)#5,003
3.2218114.7%12.1%(+2.56)#17711.2%(+3.48)#5,268

Common Questions

What are the Top Zip Codes with the Highest Percentage of Population Employed in Community & Social Service in Vienna, VA?
Top Zip Codes with the Highest Percentage of Population Employed in Community & Social Service in Vienna, VA are:
#1
17.1%
#2
15.0%
#3
14.7%
What zip code has the Highest Percentage of Population Employed in Community & Social Service in Vienna, VA?
22180 has the Highest Percentage of Population Employed in Community & Social Service in Vienna, VA with 17.1%.
What is the Percentage of Population Employed in Community & Social Service in Vienna, VA?
Percentage of Population Employed in Community & Social Service in Vienna is 16.7%.
What is the Percentage of Population Employed in Community & Social Service in Virginia?
Percentage of Population Employed in Community & Social Service in Virginia is 12.1%.
What is the Percentage of Population Employed in Community & Social Service in the United States?
Percentage of Population Employed in Community & Social Service in the United States is 11.2%.