Zip Codes with the Highest Percentage of Population with a Degree in Visual and Performing Arts in Herndon, VA
RELATED REPORTS & OPTIONS
Visual and Performing Arts
Herndon
Compare Zip Codes
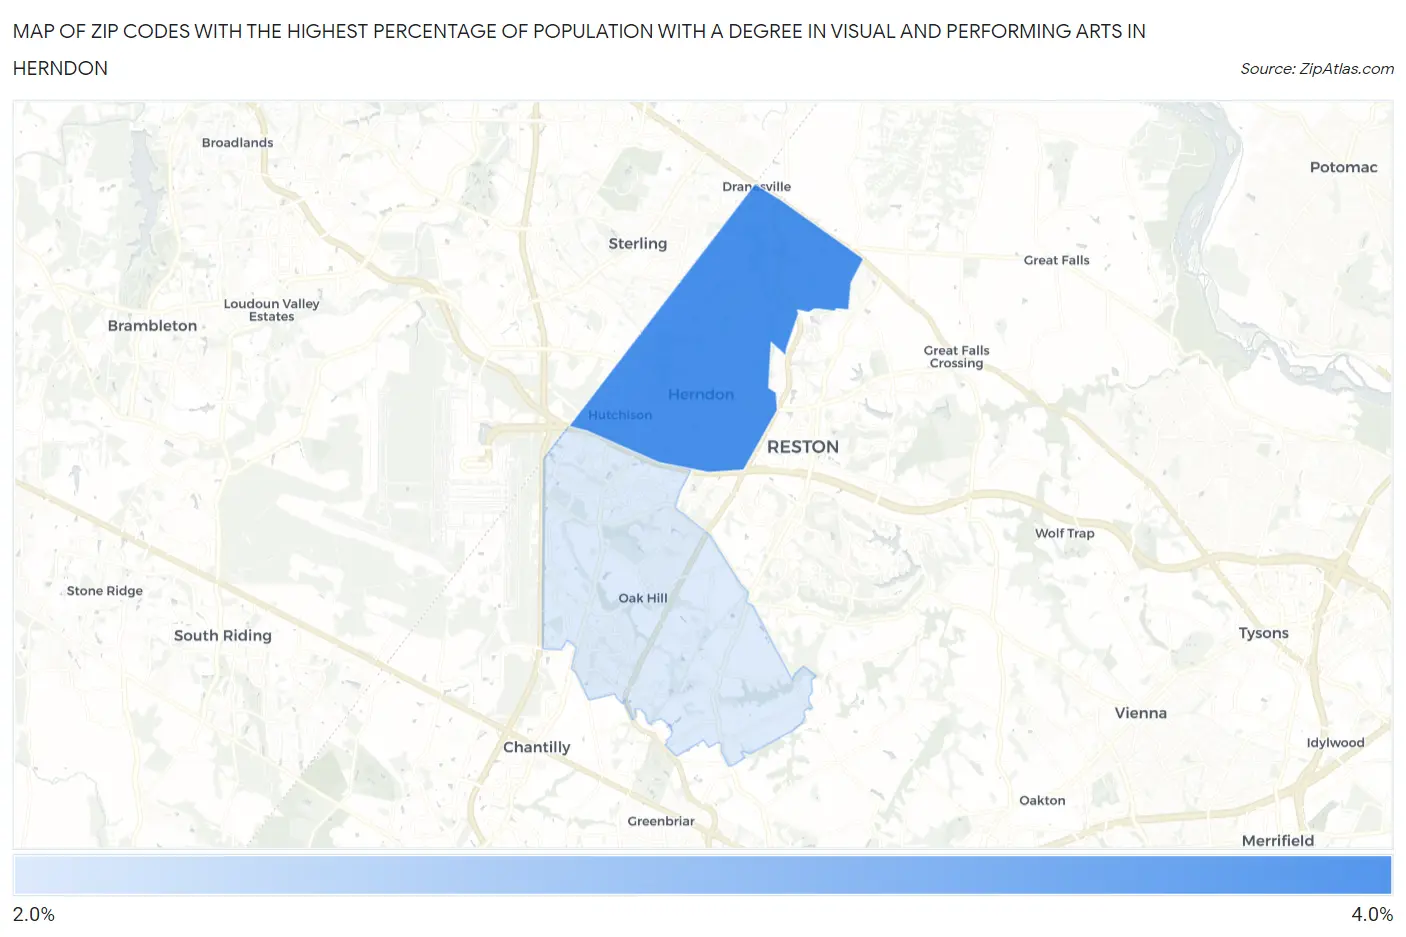
Map of Zip Codes with the Highest Percentage of Population with a Degree in Visual and Performing Arts in Herndon
0.0%
4.0%
Zip Codes with the Highest Percentage of Population with a Degree in Visual and Performing Arts in Herndon, VA
| Zip Code | % Graduates | vs State | vs National | |
| 1. | 20170 | 3.2% | 3.7%(-0.551)#323 | 4.3%(-1.09)#12,098 |
| 2. | 20171 | 2.2% | 3.7%(-1.51)#441 | 4.3%(-2.04)#15,668 |
1
Common Questions
What are the Top Zip Codes with the Highest Percentage of Population with a Degree in Visual and Performing Arts in Herndon, VA?
Top Zip Codes with the Highest Percentage of Population with a Degree in Visual and Performing Arts in Herndon, VA are:
What zip code has the Highest Percentage of Population with a Degree in Visual and Performing Arts in Herndon, VA?
20170 has the Highest Percentage of Population with a Degree in Visual and Performing Arts in Herndon, VA with 3.2%.
What is the Percentage of Population with a Degree in Visual and Performing Arts in Herndon, VA?
Percentage of Population with a Degree in Visual and Performing Arts in Herndon is 2.9%.
What is the Percentage of Population with a Degree in Visual and Performing Arts in Virginia?
Percentage of Population with a Degree in Visual and Performing Arts in Virginia is 3.7%.
What is the Percentage of Population with a Degree in Visual and Performing Arts in the United States?
Percentage of Population with a Degree in Visual and Performing Arts in the United States is 4.3%.