Zip Codes with the Highest Percentage of Population Employed in Real Estate, Rental & Leasing in Herndon, VA
RELATED REPORTS & OPTIONS
Real Estate, Rental & Leasing
Herndon
Compare Zip Codes
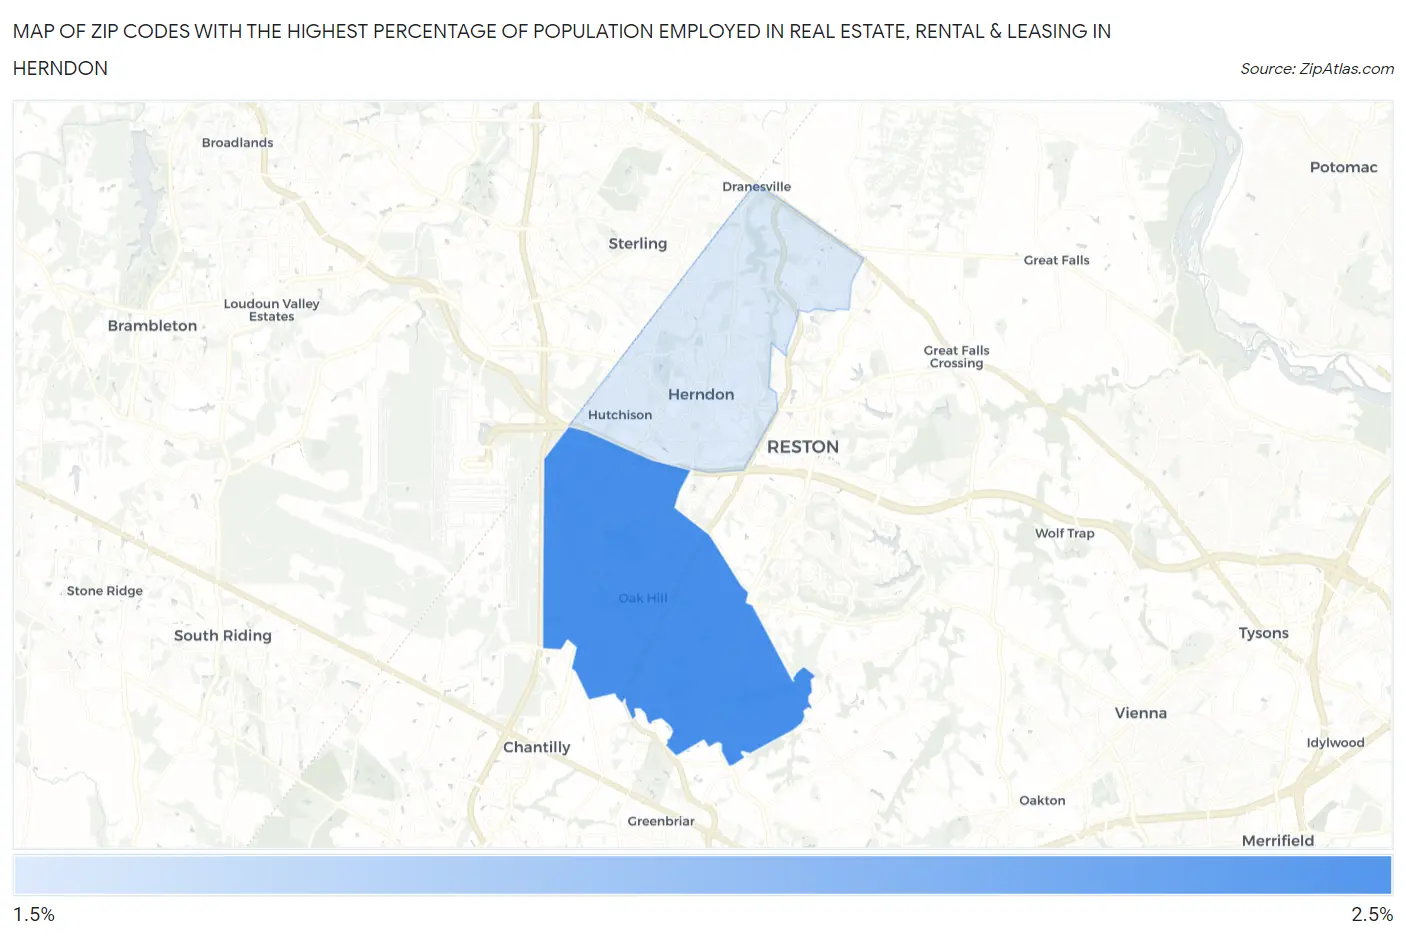
Map of Zip Codes with the Highest Percentage of Population Employed in Real Estate, Rental & Leasing in Herndon
0.0%
2.5%
Zip Codes with the Highest Percentage of Population Employed in Real Estate, Rental & Leasing in Herndon, VA
| Zip Code | % Employed | vs State | vs National | |
| 1. | 20171 | 2.4% | 1.9%(+0.503)#173 | 1.9%(+0.468)#6,061 |
| 2. | 20170 | 2.3% | 1.9%(+0.422)#181 | 1.9%(+0.387)#6,408 |
1
Common Questions
What are the Top Zip Codes with the Highest Percentage of Population Employed in Real Estate, Rental & Leasing in Herndon, VA?
Top Zip Codes with the Highest Percentage of Population Employed in Real Estate, Rental & Leasing in Herndon, VA are:
What zip code has the Highest Percentage of Population Employed in Real Estate, Rental & Leasing in Herndon, VA?
20171 has the Highest Percentage of Population Employed in Real Estate, Rental & Leasing in Herndon, VA with 2.4%.
What is the Percentage of Population Employed in Real Estate, Rental & Leasing in Herndon, VA?
Percentage of Population Employed in Real Estate, Rental & Leasing in Herndon is 2.2%.
What is the Percentage of Population Employed in Real Estate, Rental & Leasing in Virginia?
Percentage of Population Employed in Real Estate, Rental & Leasing in Virginia is 1.9%.
What is the Percentage of Population Employed in Real Estate, Rental & Leasing in the United States?
Percentage of Population Employed in Real Estate, Rental & Leasing in the United States is 1.9%.