Zip Codes with the Highest Percentage of Population Employed in Arts, Entertainment & Recreation in Herndon, VA
RELATED REPORTS & OPTIONS
Arts, Entertainment & Recreation
Herndon
Compare Zip Codes
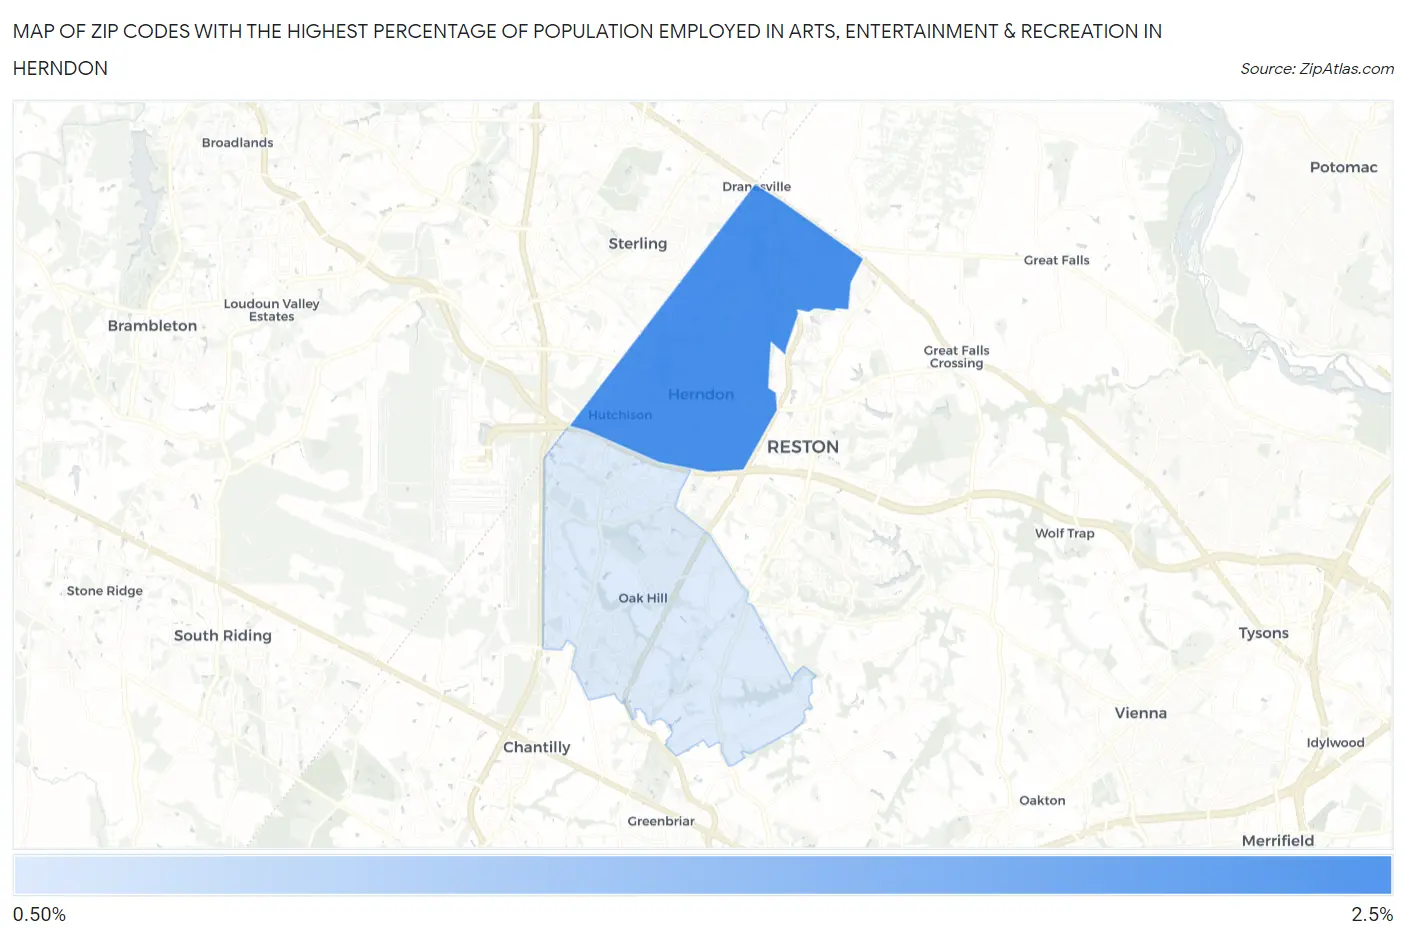
Map of Zip Codes with the Highest Percentage of Population Employed in Arts, Entertainment & Recreation in Herndon
0.0%
2.5%
Zip Codes with the Highest Percentage of Population Employed in Arts, Entertainment & Recreation in Herndon, VA
| Zip Code | % Employed | vs State | vs National | |
| 1. | 20170 | 2.3% | 1.9%(+0.425)#199 | 2.1%(+0.193)#8,248 |
| 2. | 20171 | 1.5% | 1.9%(-0.355)#333 | 2.1%(-0.587)#13,257 |
1
Common Questions
What are the Top Zip Codes with the Highest Percentage of Population Employed in Arts, Entertainment & Recreation in Herndon, VA?
Top Zip Codes with the Highest Percentage of Population Employed in Arts, Entertainment & Recreation in Herndon, VA are:
What zip code has the Highest Percentage of Population Employed in Arts, Entertainment & Recreation in Herndon, VA?
20170 has the Highest Percentage of Population Employed in Arts, Entertainment & Recreation in Herndon, VA with 2.3%.
What is the Percentage of Population Employed in Arts, Entertainment & Recreation in Herndon, VA?
Percentage of Population Employed in Arts, Entertainment & Recreation in Herndon is 1.9%.
What is the Percentage of Population Employed in Arts, Entertainment & Recreation in Virginia?
Percentage of Population Employed in Arts, Entertainment & Recreation in Virginia is 1.9%.
What is the Percentage of Population Employed in Arts, Entertainment & Recreation in the United States?
Percentage of Population Employed in Arts, Entertainment & Recreation in the United States is 2.1%.