Zip Codes with the Highest Percentage of Population with a Degree in Visual and Performing Arts in Abingdon, VA
RELATED REPORTS & OPTIONS
Visual and Performing Arts
Abingdon
Compare Zip Codes
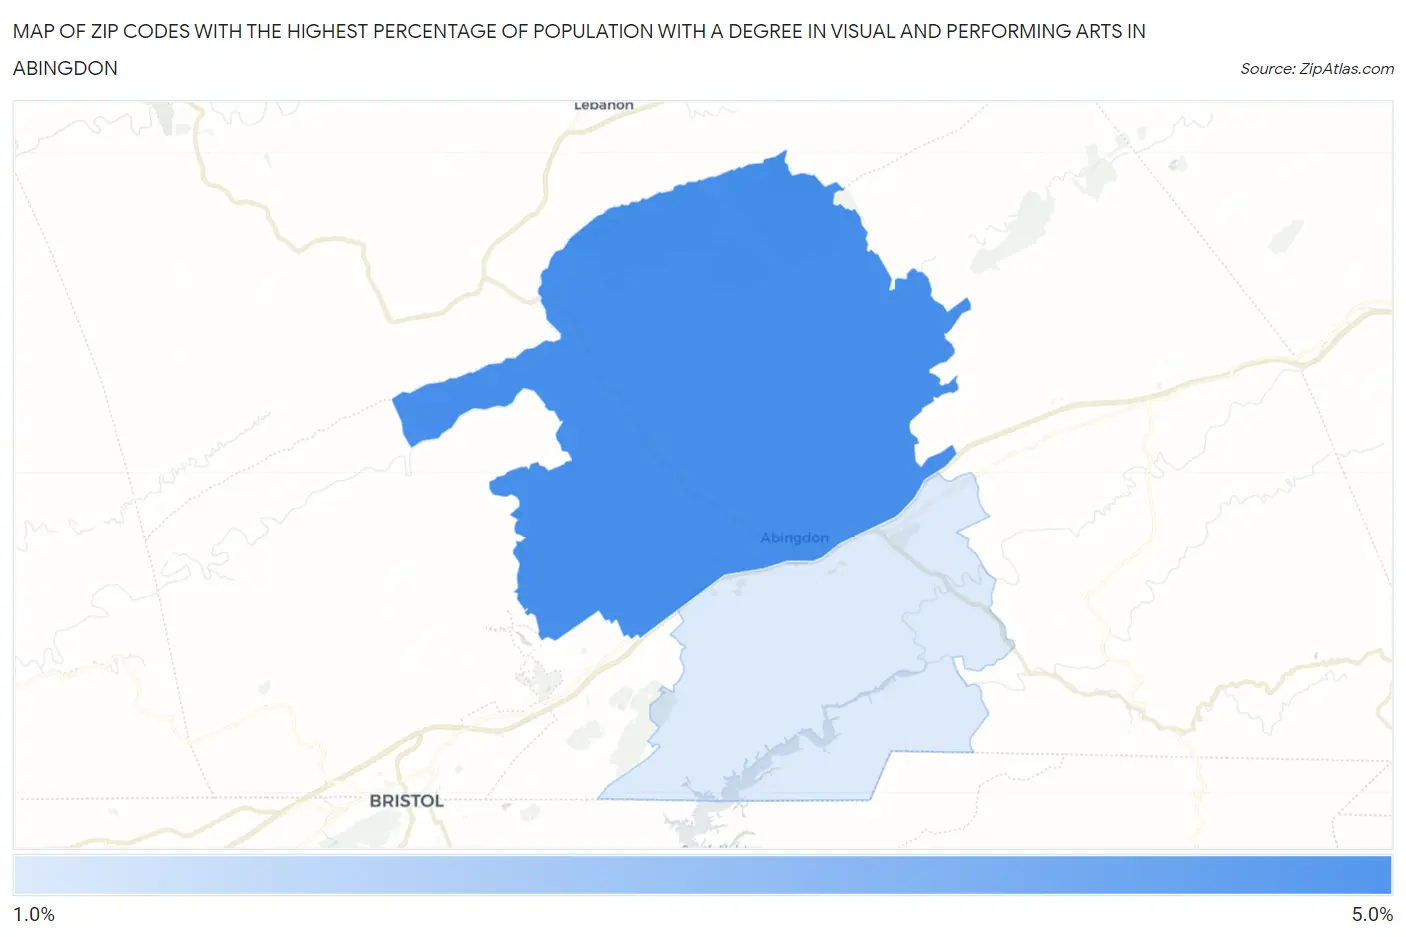
Map of Zip Codes with the Highest Percentage of Population with a Degree in Visual and Performing Arts in Abingdon
0.0%
5.0%
Zip Codes with the Highest Percentage of Population with a Degree in Visual and Performing Arts in Abingdon, VA
| Zip Code | % Graduates | vs State | vs National | |
| 1. | 24210 | 4.0% | 3.7%(+0.309)#237 | 4.3%(-0.226)#9,173 |
| 2. | 24211 | 1.7% | 3.7%(-2.02)#483 | 4.3%(-2.56)#17,517 |
1
Common Questions
What are the Top Zip Codes with the Highest Percentage of Population with a Degree in Visual and Performing Arts in Abingdon, VA?
Top Zip Codes with the Highest Percentage of Population with a Degree in Visual and Performing Arts in Abingdon, VA are:
What zip code has the Highest Percentage of Population with a Degree in Visual and Performing Arts in Abingdon, VA?
24210 has the Highest Percentage of Population with a Degree in Visual and Performing Arts in Abingdon, VA with 4.0%.
What is the Percentage of Population with a Degree in Visual and Performing Arts in Abingdon, VA?
Percentage of Population with a Degree in Visual and Performing Arts in Abingdon is 3.1%.
What is the Percentage of Population with a Degree in Visual and Performing Arts in Virginia?
Percentage of Population with a Degree in Visual and Performing Arts in Virginia is 3.7%.
What is the Percentage of Population with a Degree in Visual and Performing Arts in the United States?
Percentage of Population with a Degree in Visual and Performing Arts in the United States is 4.3%.