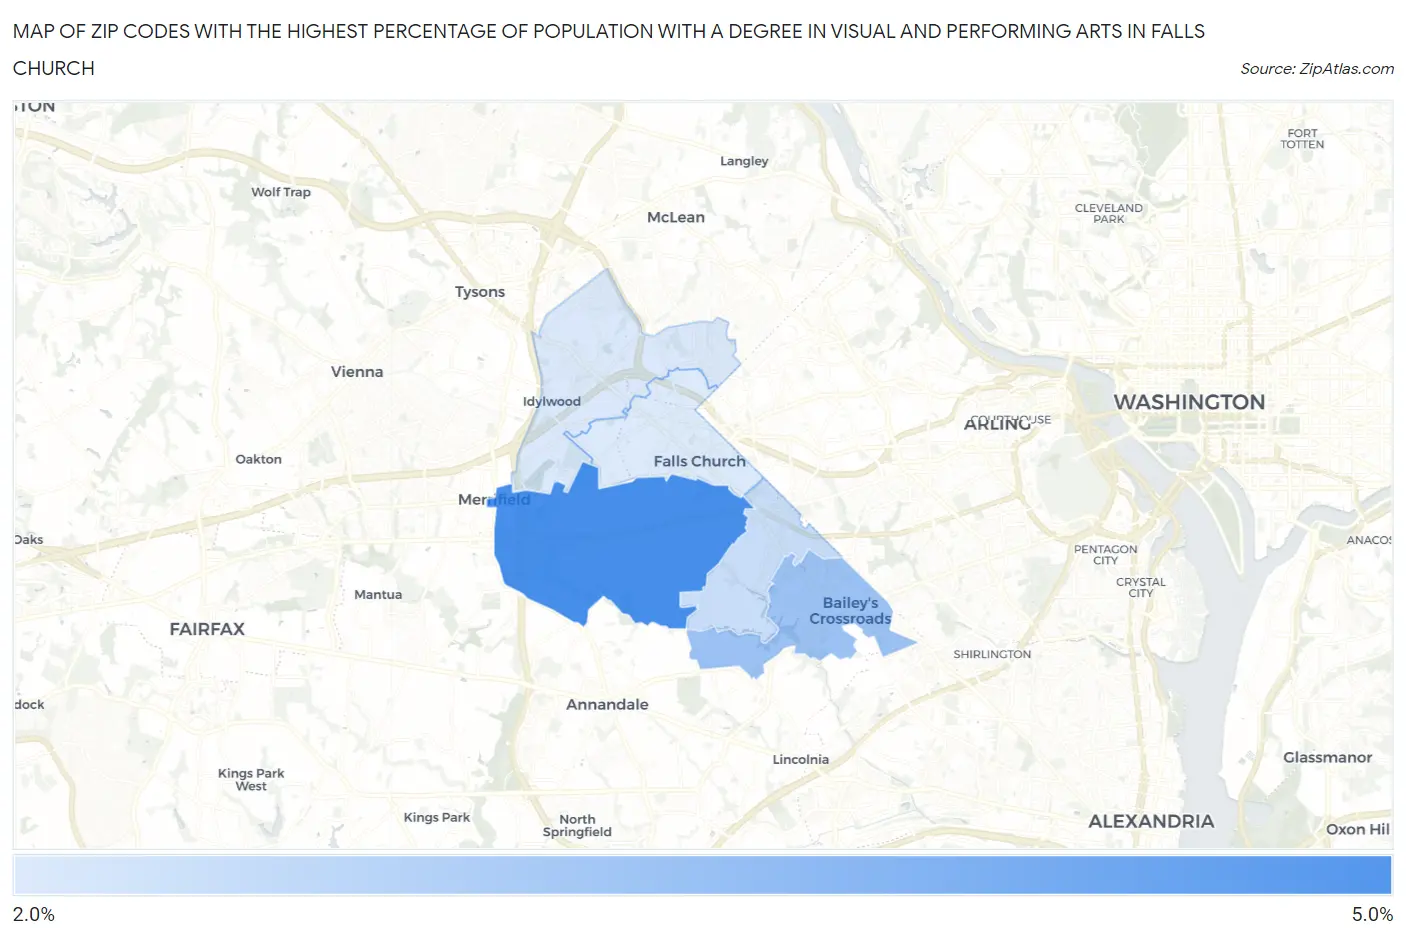
Zip Codes with the Highest Percentage of Population with a Degree in Visual and Performing Arts in Falls Church, VA
RELATED REPORTS & OPTIONS
Visual and Performing Arts
Falls Church
Compare Zip Codes
Map of Zip Codes with the Highest Percentage of Population with a Degree in Visual and Performing Arts in Falls Church
0.0%
5.0%
Zip Codes with the Highest Percentage of Population with a Degree in Visual and Performing Arts in Falls Church, VA
| Zip Code | % Graduates | vs State | vs National | |
| 1. | 22042 | 4.9% | 3.7%(+1.21)#175 | 4.3%(+0.678)#6,807 |
| 2. | 22041 | 3.4% | 3.7%(-0.340)#302 | 4.3%(-0.875)#11,324 |
| 3. | 22044 | 2.6% | 3.7%(-1.15)#403 | 4.3%(-1.69)#14,383 |
| 4. | 22043 | 2.2% | 3.7%(-1.52)#444 | 4.3%(-2.05)#15,708 |
| 5. | 22046 | 2.2% | 3.7%(-1.54)#445 | 4.3%(-2.08)#15,791 |
1
Common Questions
What are the Top 3 Zip Codes with the Highest Percentage of Population with a Degree in Visual and Performing Arts in Falls Church, VA?
Top 3 Zip Codes with the Highest Percentage of Population with a Degree in Visual and Performing Arts in Falls Church, VA are:
What zip code has the Highest Percentage of Population with a Degree in Visual and Performing Arts in Falls Church, VA?
22042 has the Highest Percentage of Population with a Degree in Visual and Performing Arts in Falls Church, VA with 4.9%.
What is the Percentage of Population with a Degree in Visual and Performing Arts in Falls Church, VA?
Percentage of Population with a Degree in Visual and Performing Arts in Falls Church is 2.5%.
What is the Percentage of Population with a Degree in Visual and Performing Arts in Virginia?
Percentage of Population with a Degree in Visual and Performing Arts in Virginia is 3.7%.
What is the Percentage of Population with a Degree in Visual and Performing Arts in the United States?
Percentage of Population with a Degree in Visual and Performing Arts in the United States is 4.3%.