Zip Codes with the Highest Percentage of Population Employed in Health Diagnosing & Treating in Danville, VA
RELATED REPORTS & OPTIONS
Health Diagnosing & Treating
Danville
Compare Zip Codes
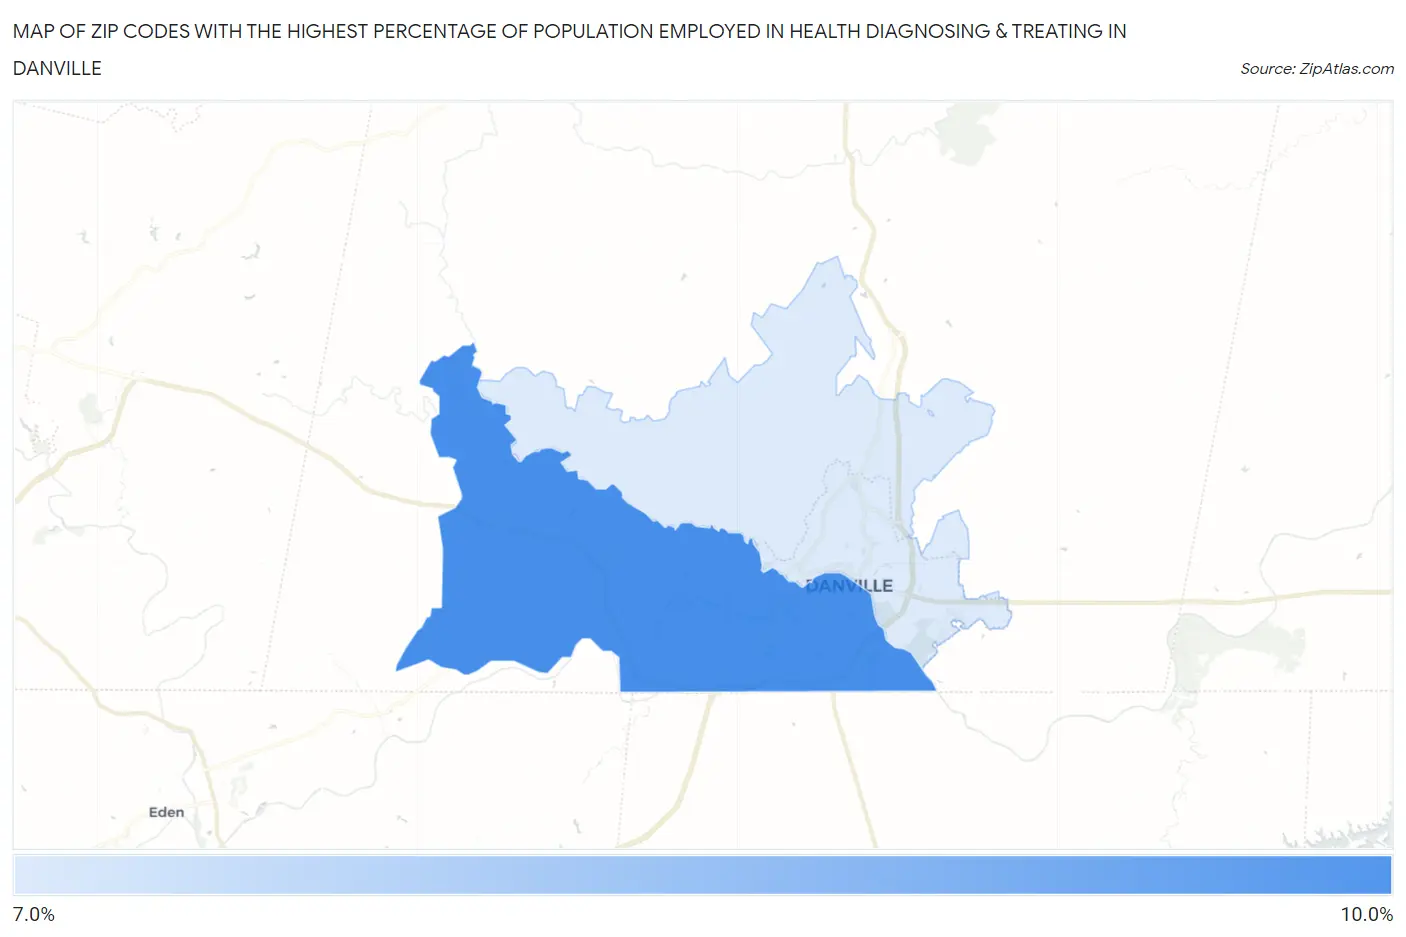
Map of Zip Codes with the Highest Percentage of Population Employed in Health Diagnosing & Treating in Danville
0.0%
10.0%
Zip Codes with the Highest Percentage of Population Employed in Health Diagnosing & Treating in Danville, VA
| Zip Code | % Employed | vs State | vs National | |
| 1. | 24541 | 8.9% | 5.7%(+3.22)#148 | 6.2%(+2.63)#5,565 |
| 2. | 24540 | 7.1% | 5.7%(+1.44)#252 | 6.2%(+0.849)#10,061 |
1
Common Questions
What are the Top Zip Codes with the Highest Percentage of Population Employed in Health Diagnosing & Treating in Danville, VA?
Top Zip Codes with the Highest Percentage of Population Employed in Health Diagnosing & Treating in Danville, VA are:
What zip code has the Highest Percentage of Population Employed in Health Diagnosing & Treating in Danville, VA?
24541 has the Highest Percentage of Population Employed in Health Diagnosing & Treating in Danville, VA with 8.9%.
What is the Percentage of Population Employed in Health Diagnosing & Treating in Danville, VA?
Percentage of Population Employed in Health Diagnosing & Treating in Danville is 7.0%.
What is the Percentage of Population Employed in Health Diagnosing & Treating in Virginia?
Percentage of Population Employed in Health Diagnosing & Treating in Virginia is 5.7%.
What is the Percentage of Population Employed in Health Diagnosing & Treating in the United States?
Percentage of Population Employed in Health Diagnosing & Treating in the United States is 6.2%.